All Activity
- Past hour
-
Yeah thats why I said we might have days of rain starting Tuesday, now it looks like it might begin Monday =\
-

July 2025 Discussion-OBS - seasonable summer variability
LibertyBell replied to wdrag's topic in New York City Metro
Thats how the roof at my other property was destroyed by falling oak trees, they don't have a deep root system and are vulnerable to microbursts and other strong wind events. -
July 2025 Discussion-OBS - seasonable summer variability
LibertyBell replied to wdrag's topic in New York City Metro
absolutely wild Chris.... and after the historic heatwave we had in July 1977. -
July 2025 Discussion-OBS - seasonable summer variability
LibertyBell replied to wdrag's topic in New York City Metro
This is why I advocate for the heliport (KJRB peaked at 105 in June). Besides the heliport, we can use rooftop stations. They would definitely be hotter than the shaded areas you speak of. -
July 2025 Discussion-OBS - seasonable summer variability
LibertyBell replied to wdrag's topic in New York City Metro
With the exception of June, this is why our heatwaves are weaker and do not last as long as they did in the 90s and the decades before then. -

July 2025 Discussion-OBS - seasonable summer variability
bluewave replied to wdrag's topic in New York City Metro
A grassy clearing in Central Park like the Great Lawn is among of the warmest parts of Manhattan Island and NYC. It’s one of the few spots that gets full sun during the summer. As the midtown streets are often in the shade with the increase in the ultra tall skyscrapers. Plus Central Park has an unusual amount of exposed bedrock which really heats up. This is why Central Park would often have similar temperatures as Newark and sometimes warmer during the summer from the 1930s to around 1980. -
July 2025 Discussion-OBS - seasonable summer variability
LibertyBell replied to wdrag's topic in New York City Metro
nice, EWR and JFK hotter than everyone else and also low humidity and deep blue skies.... -

July 2025 Obs/Disco ... possible historic month for heat
tamarack replied to Typhoon Tip's topic in New England
Lots of sites in the Northeast had their coldest August morning during the last few days of that month in 1965. Also, MWN had a couple inches of snow. -
July 2025 Discussion-OBS - seasonable summer variability
LibertyBell replied to wdrag's topic in New York City Metro
Mighty hot July 1999 just getting started on this date.... Records:Highs:EWR: 103 (1999)NYC: 101 (1999)LGA: 100 (1999)JFK: 102 (1999)New Brnswck: 100 (1999) This day ranks with the hottest days ever in our area, when all official reporting stations recorded record highs in the triple digits on the same date! -
I just came here to post about it. Horrific.
-
July 2025 Discussion-OBS - seasonable summer variability
LibertyBell replied to wdrag's topic in New York City Metro
If you go by decades rather than 30 year periods, our number of 90 degree days peaked during the 90s. You can run the numbers for all the locations you mentioned and also JFK. We had multiple historically hot summers during the 90s (91,93,95,99) and we have not had that kind of sustained heat since then (with the exception of 2010.) -
Horrible, horrible situation in Texas.
-
I am getting sick and tired of this shyte right now. It's pouring again. We are in the process of getting Kerr Countied today. I have to go out in this crap to take Ashley B to St David's to her work this morning! Low water crossings today are all like New Orleans in fracking Katrina. I can't even believe this malarkey about being warned for possibly ten more inches today. This is south central Texas not the southeastern Carolinas with Chantal.
-
July 2025 Discussion-OBS - seasonable summer variability
LibertyBell replied to wdrag's topic in New York City Metro
But we should have local cooling breezes because New York City exists on islands (besides The Bronx of course.) I just don't believe that a park could ever be representative of urban conditions and the equipment should NEVER have been in a park to begin with. We have a heliport in lower Manhattan, that's where it should be. LGA is also hotter than most of the area because of how densely packed that region is and its overnight lows are always elevated compared to both JFK and Central Park. For Manhattan urban area purposes the equipment in Central Park needs to be taken out of the park and relocated to the heliport. -
July 2025 Discussion-OBS - seasonable summer variability
LibertyBell replied to wdrag's topic in New York City Metro
Just get the equipment out of Central Park and the problem is solved. Government needs to step in since NWS won't do a thing. -
July 2025 Discussion-OBS - seasonable summer variability
LibertyBell replied to wdrag's topic in New York City Metro
This might be the days of rain I saw on the forecast yesterday. Sunday might be our last good day for awhile. -
July 2025 Discussion-OBS - seasonable summer variability
LibertyBell replied to wdrag's topic in New York City Metro
The usual suspects are in the top 20, the summers I always talk about lol. Question though, why are we using 31 not 30? A month is scientifically speaking, the amount of time it takes for the moon to revolve around the earth and that averages out to 30 days (it's really 29.53 but we can round that to 30.) 1. 1966 June 20 to July 20 ___________91.97 2. 1993 July 5 to Aug 4 ______________91.61 3. 1999 July 3 or 4 to Aug 2 or 3 ____ 90.94 4. 1955 July 8 to Aug 7 ______________ 90.90 5. 1944 July 22 to Aug 21 ___________ 90.84 6. 1980 July 14 to Aug 13 ____________ 90.71 t7. 1988A July 16 to Aug 15 ___________ 90.29 t7. 2010 June 27 to July 27 __________ 90.29 (or July 3 to Aug 2 was also 90.29) 9. 2005 July 15 to Aug 14 ___________ 89.87 10. 2011 July 4 to Aug 3 _____________ 89.84 11. 1983 July 11 to Aug 10 ____________ 89.71 12. 1952 June 24 to July 24 _________ 89.35 t13. 1977 July 13 to Aug 12 ___________ 89.29 t13. 1995 July 13 to Aug 12 ___________ 89.29 t15. 1876 June 23 to July 23 __________ 89.26 t15. 1991 June 24 to July 24 __________ 89.26 t15. 2006 July 11 to Aug 10 ____________89.26 18. 1949 July 13 to Aug 12 ____________ 89.13 __ a non-overlapping 31d interval June 11 to July 11 was 86.74 19. 1953 June 20 to July 20 __________ 88.90 __ non-overlapping 31d intervals Aug 8 (or 10) to Sep 7 (or 9) 87.00 20. 2002 Jul 20 or 22 to Aug 19 or 21_ 88.87 __ non-overlapping 31d interval June 20 or 21 to July 20 or 21 was 87.10 -

July 2025 Discussion-OBS - seasonable summer variability
psv88 replied to wdrag's topic in New York City Metro
61. Beautiful morning -

July 2025 Discussion-OBS - seasonable summer variability
FPizz replied to wdrag's topic in New York City Metro
56 this morning -
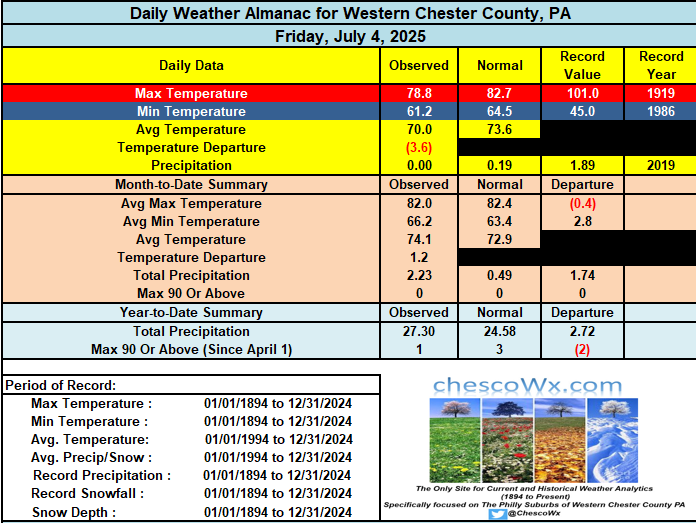
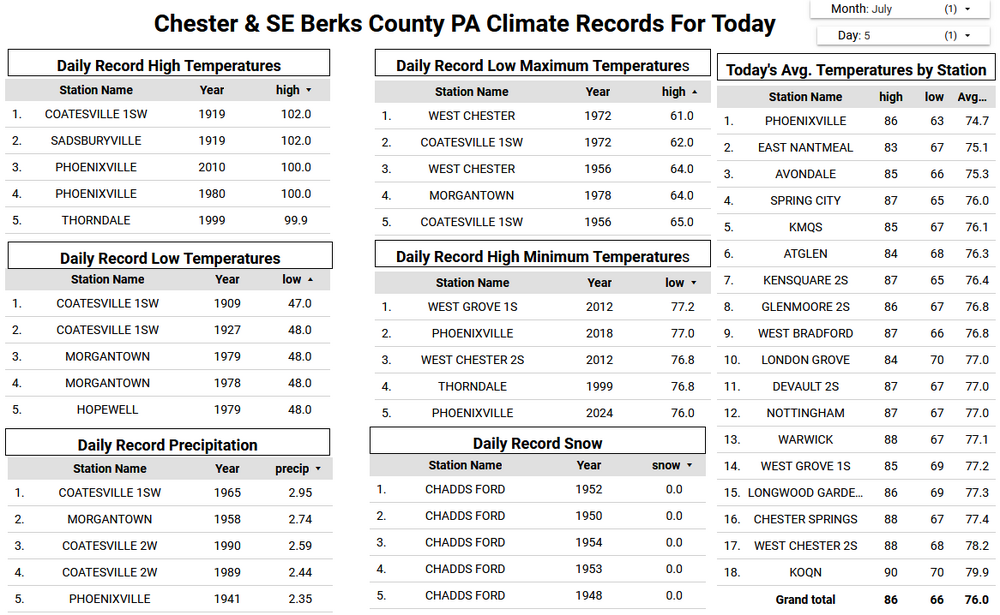
Some of the higher spots in the County like West Grove and East Nantmeal Township had highs remaining in the upper 70’s – most other spots hit the low 80’s. Plenty of cool and comfortable 50’s overnight with Warwick Township being the coolest spot with a low down to 55.3 degrees. Another beautiful couple of days producing temperatures warming to the mid 80’s today and maybe some upper 80’s tomorrow especially across valley locations. Rain chances increase by Monday night with the best chance by Tuesday.
-

E PA/NJ/DE Summer 2025 Obs/Discussion
ChescoWx replied to Hurricane Agnes's topic in Philadelphia Region
Some of the higher spots in the County like West Grove and East Nantmeal Township had highs remaining in the upper 70’s – most other spots hit the low 80’s. Plenty of cool and comfortable 50’s overnight with Warwick Township being the coolest spot with a low down to 55.3 degrees. Another beautiful couple of days producing temperatures warming to the mid 80’s today and maybe some upper 80’s tomorrow especially across valley locations. Rain chances increase by Monday night with the best chance by Tuesday.
-
Remember. The Euro is giving us 3 month averages on each forecast map, so keep that in mind when looking at the forecasts. The trend is what you need to consider as well as actual numbers.
-
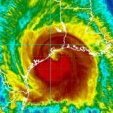
Several buoys just east of Charleston are now measuring gusts around 40 kts on the west side of the circulation. With strongest winds on east side it may be a little stronger than 35 kts already
-
July 2025 Discussion-OBS - seasonable summer variability
bluewave replied to wdrag's topic in New York City Metro
The Euro brings in Chantal’s remnants Monday into Tuesday. 2.00-2.50 PWATS and mid 70s dewpoints for heavy rain potential. Will probably have to within the SPC HREF range to guess the peak amounts.


-
There were numerous warnings well ahead of the river overflowing