All Activity
- Past hour
-
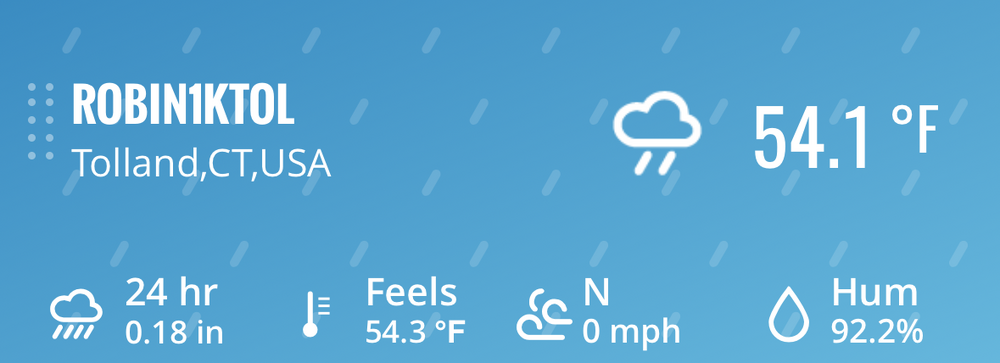
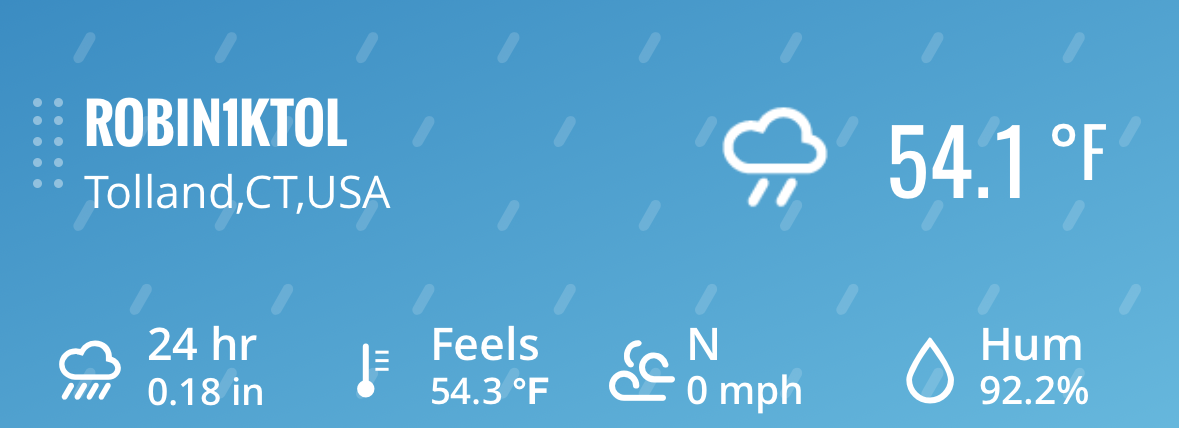
 .18 at my station
 -
That shows near surface too (the top temperature on it) and there are a million examples online from sites you probably whack to. I will wait for Tips answer since he is actually smart and has the credentials and you really didn't answer anything at all.
-

Hurricane Erin: 100 MPH - 954 mb - NNW @ 13
Wannabehippie replied to BarryStantonGBP's topic in Tropical Headquarters
Is that an outer eye wall forming? New ERC ongoing? -
Congrats HFD and south. . That’s the rain Jack . North of there meh
-
Hurricane Erin: 100 MPH - 954 mb - NNW @ 13
Wannabehippie replied to BarryStantonGBP's topic in Tropical Headquarters
I think the only thing holding Erin from regaining cat 3 is that dry slot near the center. If it can clear that out, we probably will get some intensification. -

Hurricane Erin: 100 MPH - 954 mb - NNW @ 13
WxWatcher007 replied to BarryStantonGBP's topic in Tropical Headquarters
Looks like the core is well protected for now. Very impressive MW. -
 I don’t have pcp amounts IMBY, but we’ve been in a steady rain for well over an hour. Maybe it’s the south shores turn
 -
Hurricane Erin: 100 MPH - 954 mb - NNW @ 13
Wannabehippie replied to BarryStantonGBP's topic in Tropical Headquarters
2:00 PM EDT Wed Aug 20 Location: 30.6°N 73.6°W Moving: N at 13 mph Min pressure: 943 mb Max sustained: 110 mph Nice clear eye now, but some dry air near the center of circulation But the wider view looks like it has good outflow to all quadrants. -
GWDLT
-
What a way to run an August afternoon
-
 I have Romaine lettuce out there for the fall that I started from seed about a month ago. This cool rainy weather today is great for it. I can see it having a major growth spurt today. It has been so dry over the last month, so it really needed a day like today.
 -
What a beautiful November day
-
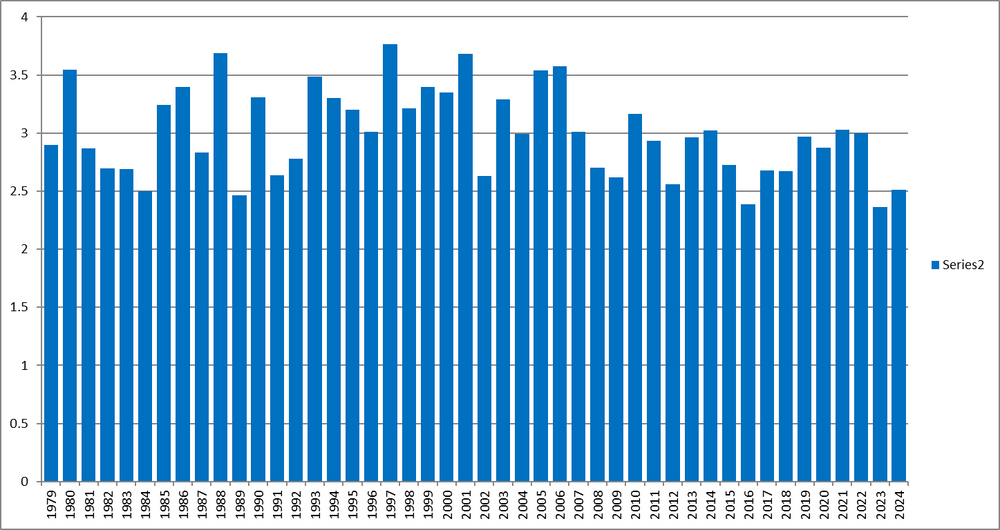
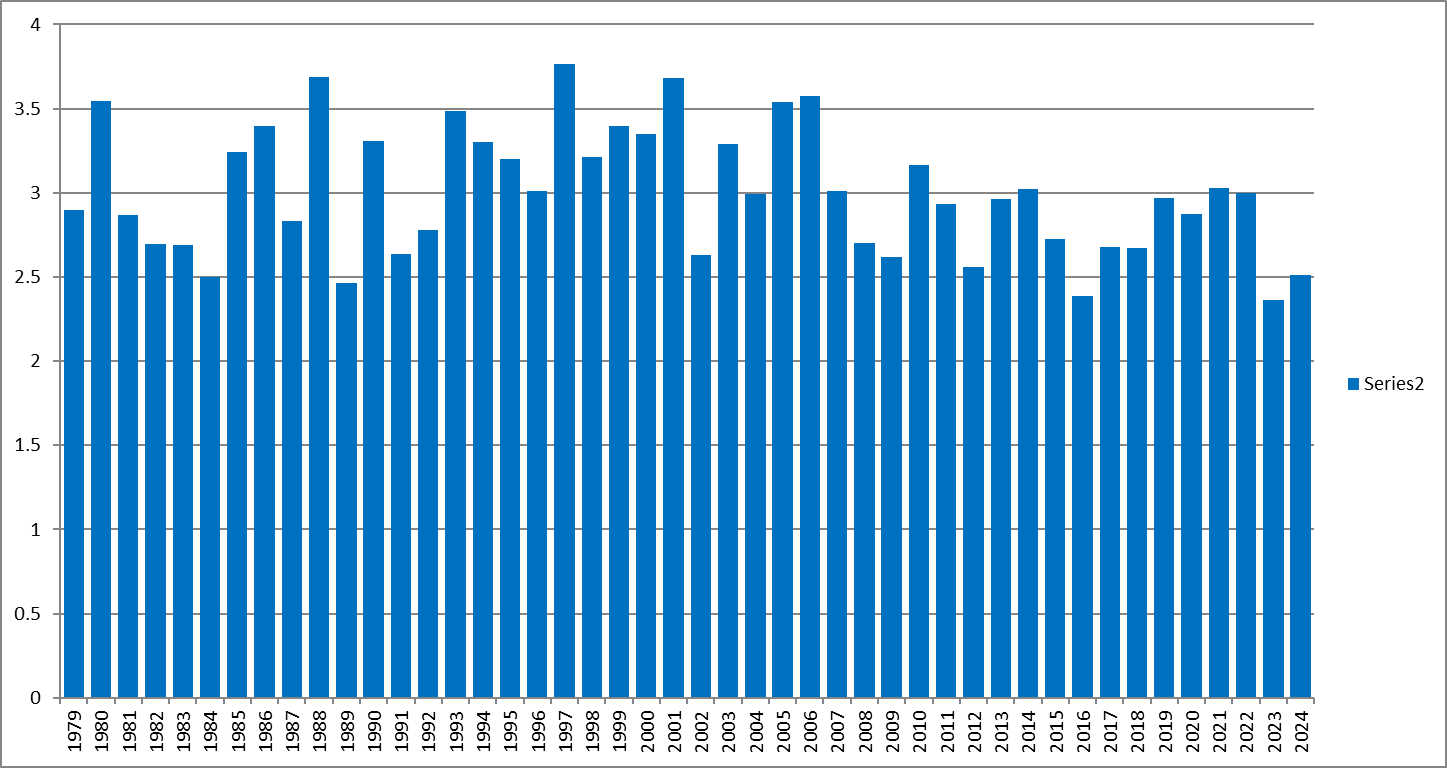
Here's what the prediction on July 1st would have been using this year's data: The sea ice area was at 6.868 million sq km on July 1st which if you take the melt from that point forward of every year since 1979 would give us a final minimum average of 3.0 million sq km. However, whereas the trend for post-July 1st area loss was pretty flat until about 2013-2014, it has since developed into a statistically significant trend, so in recent years, I've used post-2007 numbers to make the forecast. Using post-2007 melt after July 1st would produce an average sea ice area minimum of 2.8 million sq km. We'll see where it ends, but the forecast would've been 2.8 million sqkm (prob around 2.6-3.0 with error bars). For reference, the top 3 lowest are 2.22 million sq km (2012), 2.46 million sq km (2016), and 2.47 million sq km (2024). Area is currently 3.26 million sq km....this late in the season, a top 3 is unreachable. I don't think I'd change the final prediction from what it would have been...maybe shade it toward the higher end of the 2.6-3.0 range.
-
0.18" here so far. It has been light but it's steadily adding up. At least it's enough to give things a watering. We'll have to see if we can get a heavier downpour from the activity in PA later. HRRR isn't picking up on it but it's possible.
-
Hurricane Erin: 100 MPH - 954 mb - NNW @ 13
WxWatcher007 replied to BarryStantonGBP's topic in Tropical Headquarters
Rain bands showing up on KMHX radar. -
This radar has been running hot with a tad of bright banding. Lots of dry air just off the deck helping with that.
-
 Getting a downpour now
 -
pouring cold rain and smoked out airmasses, coc
-
Looked like on radar you were getting more.
-

Occasional Thoughts on Climate Change
TheClimateChanger replied to donsutherland1's topic in Climate Change
Speaking of lows: -
Where the hell have you been?
-
it looks like August will average below normal.. its been awhile since we could say that
-
It's too weak.
-
One of the worst summer days in many many years. Congrats Coc ks


.thumb.png.4150b06c63a21f61052e47a612bf1818.png)