All Activity
- Past hour
-

Hurricane Erin: 100 MPH - 954 mb - NNW @ 13
olafminesaw replied to BarryStantonGBP's topic in Tropical Headquarters

-
68 overcast/chilly/windy here...feels like October
-
Definitely a PRE event generally occur about 36 hours ahead of the main storm passage and as much as 600 miles poleward of the storm center. The presence of a front in the area along with a strong moisture flow from the storm can enhance rainfall in this region, leading to potentially heavy rains that can cause flooding or set up the region for flooding
-
Erin was so close to hitting the coast.
-
We need interesting weather
-

Hurricane Erin: 100 MPH - 954 mb - NNW @ 13
MJO812 replied to BarryStantonGBP's topic in Tropical Headquarters
Definitely This was so close to producing damaging results for the coast . -

Hurricane Erin: 100 MPH - 954 mb - NNW @ 13
BooneWX replied to BarryStantonGBP's topic in Tropical Headquarters
. -

Occasional Thoughts on Climate Change
Typhoon Tip replied to donsutherland1's topic in Climate Change
anyway... the bold is a good question. There's a lot of complexity in there but the simplest explanation is water vapor. When there is more water vapor that has been heated, the total atmosphere hold a lot of energy that way. That keeps the temperature up at night. However, in the day, it can also hold the temp down some, because it takes more energy to heat WV than dry air. The complexity is the relativity of those two. It's still 100/72 on July 10 in Boston ...and that's enough to roast one's nuts.. but, a profile of 104/66 has about the same thermodynamic quotient. Ha ha ... wasn't intending to be all guilty like. It's really more a frustration pointed at that the circumstance. It's a numbers game. Let's think about this logically for a minute. There are 8+ billion human brains walking the Earth. What are the odds that 100% of them are completely capable of objectively intellectualizing CC, and then responding to it with a cogent sanity that is reflected in their response to it and behaviors after the fact? The answer is 0% .... In other words, there is 0% chance that 100% will get it. So that leaves us in a predicament that some portion of 8+ billion are incapable of getting it. What is that number? If it is even 10 percent, we're still talking 800,000,000+ brains powered by carbon fartin' industrialized environmental destruction. This predisposition leads to reticence to the concepts, less likely to react proactively in prevention. And, 800,000,000+ is still enough people that even if the remaining 7+ billion were to completely accept and adapt their technology and principles of living around preventing anthropomorphic GW, we're all still doomed... They are doomed because 800,000,000+ is enough to still ensure environmental collapse still takes place in spite of everyone else. It's kind of a scary untenable scenario really. -

Hurricane Erin: 100 MPH - 954 mb - NNW @ 13
Eskimo Joe replied to BarryStantonGBP's topic in Tropical Headquarters
Eye emerging on Erin again. What a picturesque satellite view. -

Hurricane Erin: 100 MPH - 954 mb - NNW @ 13
NorthHillsWx replied to BarryStantonGBP's topic in Tropical Headquarters
Yes in the discussion it states they used the max winds found in the outer eyewall and an increased reduction given where they were but SFMR winds in that same area were way lower, like 60 kts. Definitely an interesting storm and a ton of wind energy aloft. This thing is exploding in diameter too. We are so lucky this is going ots this storm would be a prolific surge producer and inland wind issue if it was heading towards the coast -
Time sensitive, but if you look at visible satellite, you can see the southeast flow downsloping off the northwest side of the mountains on the Loudoun County border. Pretty neat!
-
 Chilly here with east winds and overcast skies 68
 -
Tropics are cancelled until further notice. I don't count a TS near the mid atlantic rift.
-
Hurricane Erin: 100 MPH - 954 mb - NNW @ 13
olafminesaw replied to BarryStantonGBP's topic in Tropical Headquarters
It seems like highest winds are in banding outside the center, so they may be making the assumption that since they haven't fully sampled the storm they are missing the highest winds. Especially with how impressive the pressure is. Makes me wonder if they need to mix up the flight pattern a bit to get better data, not only on max intensity but the size of the wind-field. -

2025 Atlantic Hurricane Season
WxWatcher007 replied to BarryStantonGBP's topic in Tropical Headquarters
Thanks. I wish I had the JJA number, so at least I had more confidence in inferring what the ASO number would be. -

Hurricane Erin: 100 MPH - 954 mb - NNW @ 13
yoda replied to BarryStantonGBP's topic in Tropical Headquarters
Hurricane Erin Discussion Number 37 NWS National Hurricane Center Miami FL AL052025 1100 AM EDT Wed Aug 20 2025 Observations from an Air Force Hurricane Hunter aircraft indicate that the hurricane has strengthened with peak 700 mb flight-level winds of 115 kt well to the east of the center. Using a reduction factor somewhat greater than that which would be used for eyewall winds, the intensity is set at 95 kt for this advisory. A dropsonde in the eye measured a surface pressure of 943 mb with 9 kt winds so the minimum central pressure has fallen to an estimated 942 mb. The hurricane has become better organized on satellite images this morning with a symmetric-looking cloud pattern and numerous banding features. The eye has again become evident on the imagery and upper-level outflow is well-defined over all quadrants. Erin's is now moving northward with an initial motion estimate of 350/11 kt. There has been no significant change in the track forecast guidance since the last advisory package. Over the next couple of days, Erin should move northward along the western periphery of a 500 mb high, and then turn northeastward as it rounds the northwestern side of the high. Then, the system should accelerate northeastward to east-northeastward while moving within the southern belt of the the mid-latitude westerlies. The official track forecast is close to the previous one and in good agreement with the various dynamical model consensus predictions. Erin still has a rather broad inner core but the eyewall appears to be reforming. The system is over warm waters and within a moist low- to mid-level air mass. Although the vertical wind shear is currently light, the SHIPS model predicts a significant increase in shear in 12-24 hours. Therefore the hurricane has the potential to strengthen some more in the short term, particularly if the inner core becomes even better defined. By 36 hours and beyond, westerly shear is predicted to become prohibitively high, so a weakening trend is likely to commence later on Thursday. Simulated satellite imagery from the global models suggest that Erin will become an extratropical cyclone in 96 hours or sooner. It should be noted that the 34- and 50-kt wind speed probabilities in the text and graphical products are likely underestimating the risk of those winds occurring. This is because the forecast wind field of Erin is considerably larger than average compared to the wind field used to derive the wind speed probability product. KEY MESSAGES: 1. Erin is expected to produce life-threatening surf and rip currents along the beaches of the Bahamas, much of the east coast of the U.S., Bermuda, and Atlantic Canada during the next several days. Beachgoers in those areas should follow advice from lifeguards, local authorities, and beach warning flags. 2. Storm surge flooding and tropical storm conditions are expected in the North Carolina Outer Banks beginning later today. The storm surge will be accompanied by large waves, leading to significant beach erosion and overwash, making some roads impassible. 3. Tropical storm conditions are expected on Thursday along the Virginia coast. Wind gusts to tropical storm force are likely along portions of the remainder of the U.S. Mid-Atlantic and southern New England coasts Thursday through early Friday. 4. Tropical storm conditions are possible on Bermuda on Thursday and Friday. FORECAST POSITIONS AND MAX WINDS INIT 20/1500Z 30.1N 73.7W 95 KT 110 MPH 12H 21/0000Z 32.0N 73.6W 105 KT 120 MPH 24H 21/1200Z 34.4N 72.2W 105 KT 120 MPH 36H 22/0000Z 36.6N 69.4W 100 KT 115 MPH 48H 22/1200Z 38.6N 65.5W 90 KT 105 MPH 60H 23/0000Z 40.4N 60.5W 80 KT 90 MPH 72H 23/1200Z 42.5N 54.3W 65 KT 75 MPH 96H 24/1200Z 47.4N 40.0W 55 KT 65 MPH...POST-TROP/EXTRATROP 120H 25/1200Z 52.5N 27.4W 50 KT 60 MPH...POST-TROP/EXTRATROP $$ Forecaster Pasch -
 Records: Highs: EWR: 97 (1983) NYC: 97 (1955) LGA: 98 (1955) JFK: 100 (1983) Lows: EWR: 52 (1949) NYC: 55 (1949) LGA: 58 (1949) JFK: 55 (1949) Historical: 1794: The "Battle of Fallen Timbers" took place on the Maumee River in northwestern Ohio at the sight of a windfall from a tornado. (Ref. Wilson Wx. History) 1816: The “Year Without a Summer” continued as hard frost occurred in much of New England. Frost was seen as far south as Connecticut. (Ref. Wilson Wx. History) 1863: A tornado struck Charlestown Navy yard, east Boston, MA. (Ref. NOAA Boston Weather Events) 1886 - The 1886 Indianola Hurricane destroyed the town of Indianola, Texas and as such had a significant impact on the history and economic development of Texas. The storm ended the rivalry between Galveston and Indianola as the chief port of Texas. With the abandonment of Indianola and the unwillingness of the former residents to rebuild close to shore, Galveston became the essential Texan port until the 1900 Galveston Hurricane led to the rise of Houston as a major port. It was the fifth hurricane of the 1886 Atlantic hurricane season and one of the most intense hurricanes ever to hit the United States. 1904: A destructive, estimated F4 tornado moved east-southeast from 7 miles west-northwest of Willow Lake, SD through the town, and on into Bryant, SD. All buildings on at least three farms were blown away. One woman died in Bryant, as the tornado swept across the residential west side of town. Another man was killed just west of Willow Lake, as his farm house was scattered for miles. (Ref. Wilson Wx. History) 1910 - The big blow up of forest fires finally came to an end in Idaho. A record dry August fueled 1736 fires which burned three million acres destroying six billion board feet of timber. The fires claimed the lives of 85 persons, 78 of which were fire fighters, and consumed the entire town of Wallace. The smoke spread a third of the way around the world producing some dark days in the U.S. and Canada. The forest fires prompted federal fire protection laws. (David Ludlum) 1928 - A tornado estimated at F4 intensity initially touched down in Winnebago County, Iowa, moved to Freeborn County, Minnesota, and hit the south side of Austin, MN. Five of the six deaths were in Austin with 60 injuries. 1939: On the 19th and 20th the remnants of a tropical storm dumped 14.81 inches of rain on Tuckerton, NJ on the 19th and 20th. That remains the state's greatest 24-hour rainfall at an official weather observation station. (Ref. Hurricane Map and NWS Monthly Weather Review ) 1950: Canadian high pressure brought record low temperatures for the date. The following locations reported record low temperatures for August: Owen, WI: 28°, Blair, WI: 33°, Cresco, IA 34°, Platteville, WI: 38°, Trempealeau, WI: 40°, Alma, WI: 42°, Quincy, IL: 42° and Lynxville, WI: 44°. (Ref. Many Additional Temperatures Listed On This Link) 1955: Diane flood highest in state since 1942; Wisconsin Ave. gauge at 8.75 ft Diane's Storm Track - NOAA. Gov.- National Hurricane Center 1969: Camille on the 20th had 27.00 rain in Nelson Co., VA. 24 hour record 113 drowned. No warning was issued but this would have made little difference since most were asleep as houses were destroyed. It was said that the rain was so heavy that birds, which have nostrils on the tops of their beaks, drowned while perched on trees. The James River in Richmond, VA at Westham crested at 24.8 feet or Richmond's 3rd worst flood. June of 1972 after Hurricane Agnes the crest was 28.62 feet which was Richmond's second worst flood, the worst flood was May 27th, 1771. After this event, the total damage from Camille was $1.4 billion dollars. Camille in Virginia - Wikipedia.org (Ref. More About Hurricane Camille)(Ref. for River level) 1983: The remnants of Hurricane Alicia brought heavy rain and flooding to parts of southern and central Oklahoma. Rainfall of 4 to 6 inches in less than 6 hours occurred in the Oklahoma City metropolitan area, the hardest hit part of the state. Major flooding occurred west of El Reno, while high water crept into a few buildings at the University of Oklahoma campus in Norman. (Ref. Wilson Wx. History) 1983: The temperature at Greenville, GA reached 112 °F to establish a state maximum temperature record for Georgia. (Ref. Lowest and Highest Temperatures for the 50 States) 1987 - Half a dozen cities in the Central Plains Region reported record high temperatures for the date, including Pueblo CO with a reading of 102 degrees, and Goodland KS with a high of 104 degrees. Hill City KS reached 106 degrees. (The National Weather Summary) 1988 - Sheridan, WY, reported a record hot temperature reading of 100 degrees. Evening thunderstorms produced golf ball size hail near Fortuna ND, and wind gusts to 70 mph near Webster SD. (The National Weather Summary) (Storm Data) 1989 - Early morning thunderstorms produced heavy rain in southeast Kansas and northeastern Oklahoma, with up to six inches reported around Tulsa OK. Some roads in the Tulsa area were closed by water 10 to 12 feet deep. Evening thunderstorms produced severe weather in northern Oklahoma and southern Kansas. Thunderstorms produced winds gusts to 75 mph in Major County OK, and hail two inches in diameter at Jennings KS. (The National Weather Summary) (Storm Data) 1992: Tropical Storm Andrew continued his struggle to maintain himself near 22N/63W as strong upper level winds from a cold upper low to its north sheared the convection. Despite Andrew's broad, poorly organized center with a lowest sea level pressure of only 1015 millibars or 29.97 inches of mercury, an Air Force reconnaissance plane still found sustained 80 mph winds at the 1500 foot level in the northeastern quadrant of the storm. Andrew managed to hold his own and once the wind shear abated late on the 21st, the storm began a rapid intensification curve. Andrew eventually became a strong category five hurricane that went on to devastate south Florida as a massive high pressure area built to Andrew's north and steered him westward. Temperatures fall into the 30s in some rural areas in Michigan during the coldest August on record at Grand Rapids. Record lows for the day include 42° at Muskegon, MI and 43° at Grand Rapids, MI. (Ref. Wilson Wx. History) 1997: One of the worst floods in history for parts of southern New Jersey occurred as heavy thunderstorms dumped torrential rain from Delaware into southeastern New Jersey. 11.12 inches of rain at Atlantic City, NJ shattered their record precipitation for the date and for any single date. The rains brought the total for the month to 15.74 inches which broke the old monthly record set in 1967. At the marina in Atlantic City, just 10 miles from the airport, only 2.60 inches fell. 3.17 inches of rain fell in one hour at the airport. The airport and almost every road in the area were closed. (Ref. AccWeather Weather History) 2001: Double jeopardy or triple jeopardy at South Carolina's Isle of Palms, lightning struck the CB antenna of a pickup. When the driver stepped out of the truck to check the damage another bolt hit the bed of the truck throwing him onto the highway but but he wasn't hit and survived. (Weather Guide Calendar with Phenomenal Weather Events 2007 Accord Publishing, USA) Two farmhands in a three-sided, metal, calf-feeding pen were killed by lightning on a farm near Remington in Fauquier County, VA. (Ref. Lightning - Virginia Weather History)
 -
Hurricane Erin: 100 MPH - 954 mb - NNW @ 13
NorthHillsWx replied to BarryStantonGBP's topic in Tropical Headquarters
Little surprised they bumped winds to 95 kts given highest SFMR winds were around 75 kts and strongest FL winds were almost 100 miles from center -
Hurricane Erin: 100 MPH - 954 mb - NNW @ 13
yoda replied to BarryStantonGBP's topic in Tropical Headquarters
BULLETIN Hurricane Erin Advisory Number 37 NWS National Hurricane Center Miami FL AL052025 1100 AM EDT Wed Aug 20 2025 ...LARGE ERIN STRENGTHENS WHILE HEADED NORTH... ...BEACHGOERS ARE CAUTIONED AGAINST SWIMMING AT MOST U.S. EAST COAST BEACHES DUE TO LIFE-THREATENING SURF AND RIP CURRENTS... SUMMARY OF 1100 AM EDT...1500 UTC...INFORMATION ----------------------------------------------- LOCATION...30.1N 73.7W ABOUT 545 MI...880 KM WSW OF BERMUDA ABOUT 365 MI...590 KM SSE OF CAPE HATTERAS NORTH CAROLINA MAXIMUM SUSTAINED WINDS...110 MPH...175 KM/H PRESENT MOVEMENT...N OR 360 DEGREES AT 13 MPH...20 KM/H MINIMUM CENTRAL PRESSURE...941 MB...27.79 INCHES WATCHES AND WARNINGS -------------------- CHANGES WITH THIS ADVISORY: A Tropical Storm Warning has been issued from north of the North Carolina/Virginia border to Chincoteague, Virginia. SUMMARY OF WATCHES AND WARNINGS IN EFFECT: A Storm Surge Warning is in effect for... * Cape Lookout to Duck, North Carolina A Tropical Storm Warning is in effect for... * Beaufort Inlet, North Carolina to Chincoteague, Virginia, including Pamlico and Albemarle sounds. A Tropical Storm Watch is in effect for... * Bermuda -
Thanks. I just found it. This is what I posted on 5/21/24 and thus this analysis doesn’t include what happened in 2024, a really bad year with it scoring 5G/0E. 2024’s ASO RONI was -0.75: ————————— I just did an analysis of CONUS landfalls for RONI ASO -0.50 to -1.00 vs sub -1.00. E = east coast and G = Gulf coast including FL Keys; if storm landfalled on both as a H, I counted it as 1/2 E and 1/2 G (1995’s Erin and 2022’s Ian) ASO RONI -0.50 to -1.00: every season at least 1 1954: 3 (3E) 1955: 2 (2E) 1964: 4 (2E, 2G) 1970: 1 (1G) 1983: 1 (1G) 1995: 2 (0.5E, 1.5G) 1999: 3 (1E, 2G) 2011: 1 (1E) 2017: 3 (3G) 2021: 2 (2G) AVG: 2.20 (0.95E, 1.25G) ASO RONI sub -1.00: less active avg despite 2020 1973: 0 1975: 1 (1G) 1988: 1 (1G) 1998: 3 (1E, 2G) 2007: 1 (1G) 2010: 0 2016: 2 (1E, 1G) 2020: 6 (1E, 5G) 2022: 2 (1.5E, 0.5G) AVG: 1.78 (0.50E, 1.28G) Analysis of ASO RONI wk vs mod+: -sig. more CONUS H landfalls (100%/70% had 1+/2+) -sig. more E coast landfalls (60%/30% had 1+/2+) -slightly fewer G coast landfalls due to 2020 being active -E being nearly as active as G for wk is relatively high for E -2020 ASO is mod+ per RONI but is only wk per ONI H tracks: https://www.nhc.noaa.gov/data/ RONI: https://www.cpc.ncep.noaa.gov/data/indices/RONI.ascii.txt
- Today
-
If you watch radar, you can see those webbed hands pressing everyhting south. Stein working in N-S. This is why it will turn into a SoP deal.
-
 Lots of misery mist/drizzle.
 -
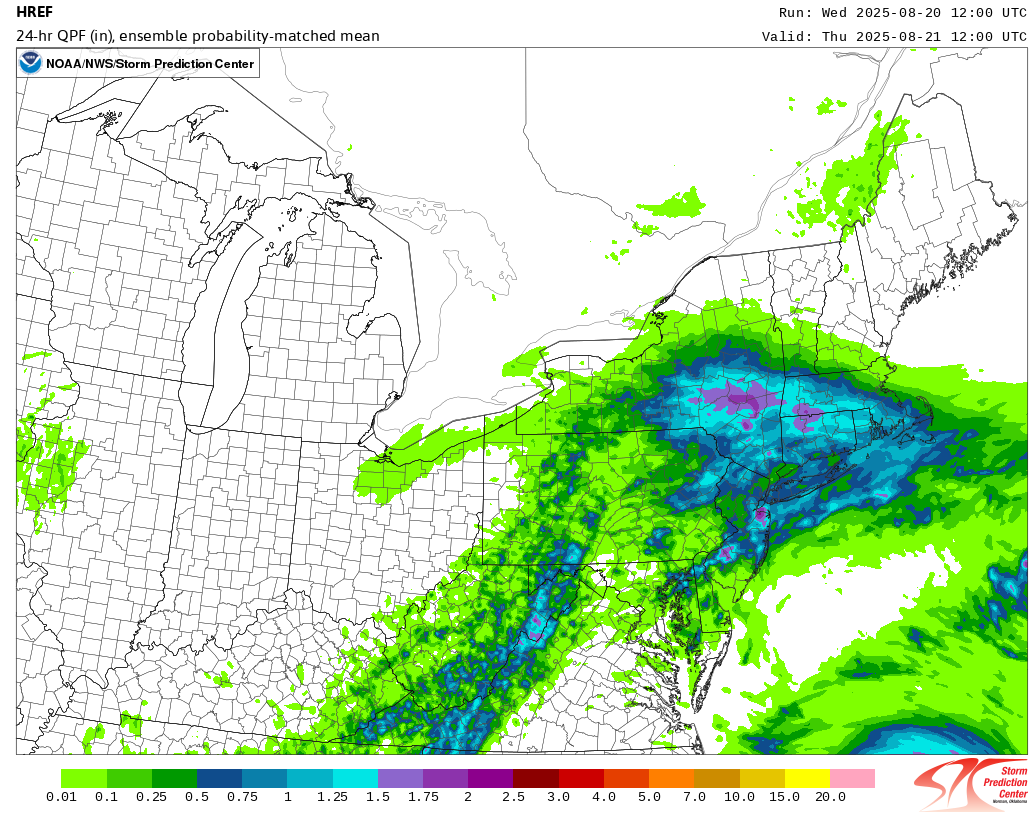
 0.09" here so. A pretty good drizzle is coming down right now. I hope we can get a half inch here from this event. A lot of the models have the heavier action missing to the south and the north.