All Activity
- Past hour
-
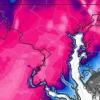
It looks like it might be a rainy morning rush hour. There's a nice batch of rain developing to our south over VA.
-
 cheapest viagra: Viagra tablet online - Buy generic 100mg Viagra online
 -
Viagra without a doctor prescription Canada [url=http://medmennews.com/#]MedMenNews[/url] order viagra
-

2026-2027 Super El Nino
OSUmetstud replied to Stormchaserchuck1's topic in Weather Forecasting and Discussion
The TNI is the more typical way to look at it and with Nino 4 historically warm right now it's going to be hard to more east-based than 1997. - Today
-

E PA/NJ/DE Summer 2026 Obs/Discussion
Hurricane Agnes replied to PhiEaglesfan712's topic in Philadelphia Region
Getting gully washer the past 10 minutes with ,>2"/hr, went from 0.08" to 0.85" in the bucket here in NW Philly. Temp/dp both 76. -
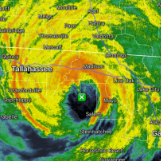
 Dolphin appears to be en route to a very large eye. Inner eyewall is quite thin on W side. Not sure if drier air has got entrained into the W quad of the system or it is artifact of the next ERC. Either way, a lot of time still for this TC to evolve further, and no reason to think it will not end up being a "donut!"
 -
Augdewst 2026: Summer's Last Stand
vortex95 replied to Prismshine Productions's topic in New England
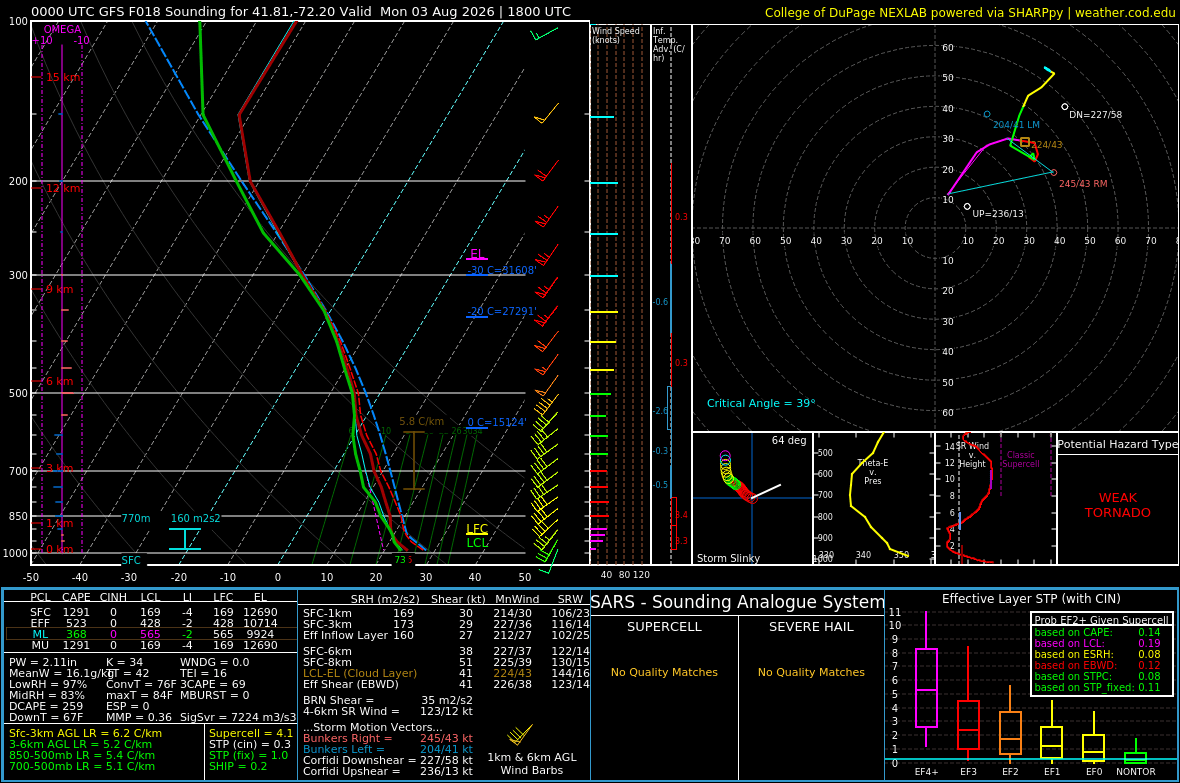
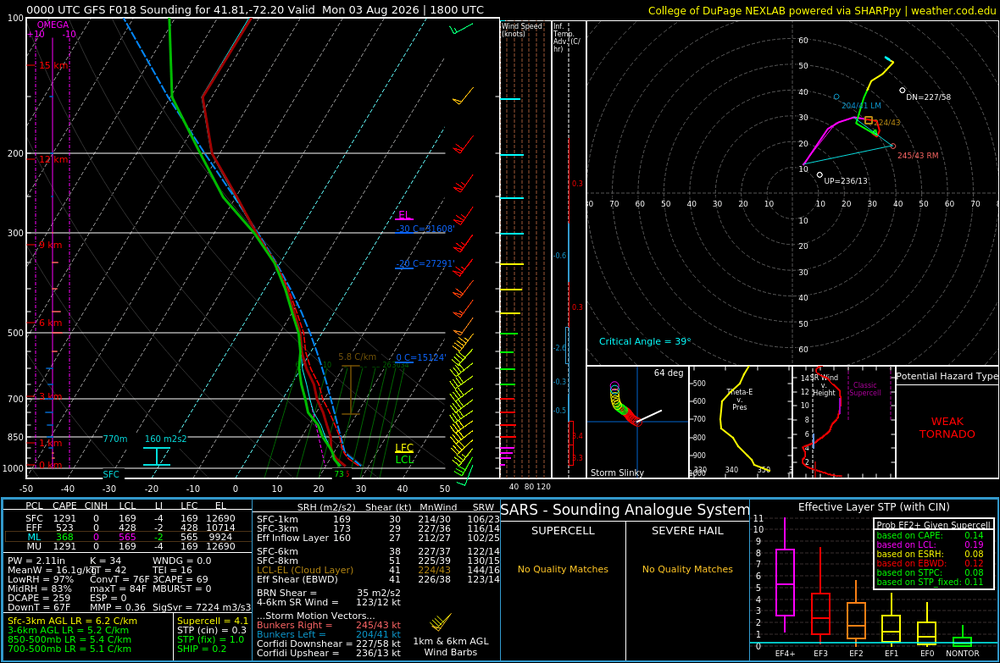
PT time for @weatherwiz b/c 2% spinner risk for CT now! I can see that. Even though winds are unidirectional sfc-aloft, they are quite strong at 925 and 850. 30-50 kt W to E from central CT to ern MA. Anything over 30 kt means spinner business. 30 -50 kt at 850 as well. Attached is GFS sounding for ern CT at 18z. 38 kt 0-6 km shear is enoughs for supercell and 30 kt 0-1 km shear is excellent for spinner potential. HRRR shows large areas of 0-3 km CAPE 100+ so there is your low-level stretching. Classic tropical tor set up where best winds, relatively speaking, are at low-levels.
-
1.1 in 2 downpours. Some of the heaviest rain so far this year.
-
1.1 already this morning.
-
Monsoon outside. Storms building and sliding sw to ne
-
sildenafil over the counter or Cheap generic Viagra online Buy generic 100mg Viagra online https://www.onlinefussballmanager.de/forward.php?tid=174752&url=medmennews.xyz Viagra Tablet price and https://mantiseye.com/community/vjklgudjfl Generic Viagra online [url=http://neurostar.com/en/redirect.php?url=http://medmennews.xyz/]Order Viagra 50 mg online[/url] buy Viagra over the counter or [url=http://www.freeworld.imotor.com/space.php?uid=206341]Viagra tablet online[/url] Viagra online price
-
Viagra online price: Cheapest Sildenafil online - order viagra
-
buy Viagra online: order viagra - Generic Viagra online
-
Cheap Sildenafil 100mg and Cheap generic Viagra over the counter sildenafil http://images.google.com.pk/url?q=http://medmennews.com sildenafil 50 mg price or http://www.garmoniya.uglich.ru/user/tphfmhsqak/ sildenafil over the counter [url=https://maps.google.es/url?q=https://medmennews.com]Sildenafil 100mg price[/url] Viagra generic over the counter or [url=http://bbs.51pinzhi.cn/home.php?mod=space&uid=8151979]Viagra Tablet price[/url] Order Viagra 50 mg online
-
Nice downpour near Toms River heading towards NYC
-
cheapest viagra [url=http://medmennews.com/#]Med Men News[/url] Cheap Sildenafil 100mg
-
 I'm enjoying this Dolphin as the setup is fairly rum. If an eye size is nearing the top percentile I typically take the under but that means the same size remains or an awk transition to a smaller eye. I chuckle watching that wobbly lug of an eye saunter on for days. Those dry air slots are legendary like a whole moon crescent could fit in there
 -
Near record low arctic circle vortex occurring over the next few days. <5100 in the heart of Summer. Since the May 2024 aurora borealis way far south, 2024, 2025, and 2026 have all had the same +AO warm season pattern! It usually carries through Sept. Since 2012, it has flipped for the Winter almost every time. Would you guys take a repeat of 24-25 and 25-26 with a Super Nino STJ? I would. Should be interesting.
-
-PNA may seem out of context in an El Nino thread, but I'm just describing what's happening now - this is the highest El Nino on record for the date, and right now it's not acting like previous Nino's. Will that change for the Winter? perhaps, but I wouldn't expect a monster -150dm N. pacific low in the DJFM mean.
-
PDO is still around -3. 23-24 and 72-73 are the only analogs for both unless it starts rising fast.
-
Augdewst 2026: Summer's Last Stand
WxWatcher007 replied to Prismshine Productions's topic in New England
Bullseye right over mby. There’s a 0.0% chance of that happening. -

2026-2027 Super El Nino
GaWx replied to Stormchaserchuck1's topic in Weather Forecasting and Discussion
Brand new BoM remains full steam ahead to a record shattering RONI! This includes once again a record rapid rise within just one month (July to August). Also, it still doesn’t fall steeply after the peak totally unlike the V-shaped CFSv2 curve: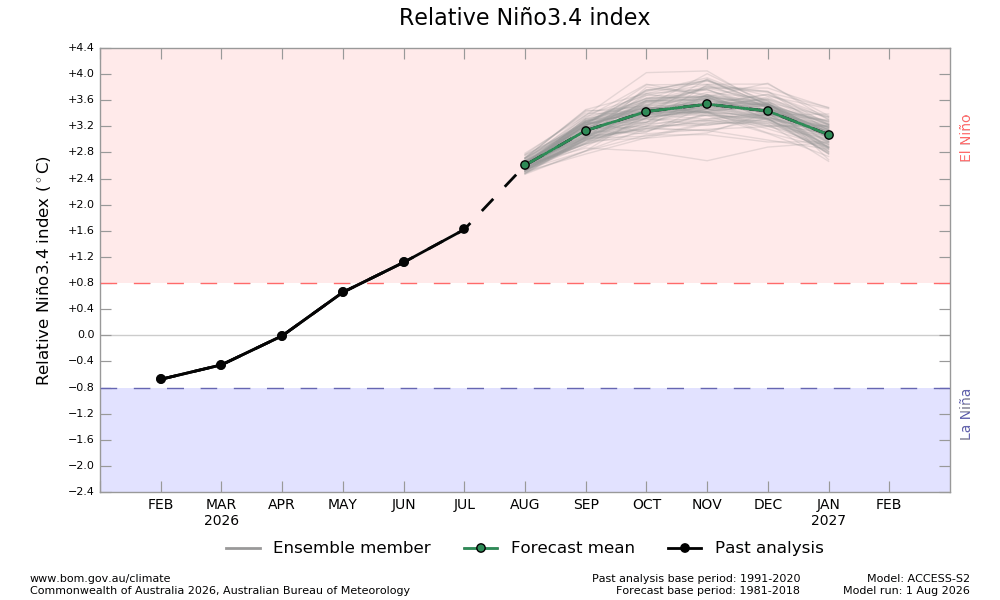
-
Viagra online price: Med Men News - Viagra generic over the counter
-
buy Viagra online: sildenafil over the counter - order viagra
-

2026-2027 Super El Nino
Stormchaserchuck1 replied to Stormchaserchuck1's topic in Weather Forecasting and Discussion
Wow! Keep in mind July 2025 currently holds the all time monthly PDO record in either state, with -4.2. Oct 2024 was the all time monthly record before that, since the mid 1800s, at -3.8. I know they edited the monthly marks so I want to double check but the site is currently down. Aug being possibly the 7th month in a row with -PNA is a big reason why it's dropping so much. Will it start effecting things different as we move toward the cold season? Perhaps, but -PDO decadal is almost as much of an anomaly as El Nino currently is. Having the two together like this is probably coming up on a 6std happening! Exciting!