All Activity
- Past hour
-

2025-2026 ENSO
PhiEaglesfan712 replied to 40/70 Benchmark's topic in Weather Forecasting and Discussion
I think you meant 1979-80 for the record lowest season. 78-79 was a record cold and very snowy February. 79-80 checks out as a record low snow season in the Boston area. -
Back from a week in the PAC NW (SEA-SFO). Seeing cyclic consistency in the EC-AI op strong nor'easter hit since 00z/5 (6 consecutive cycles). EPS EPS AI gaining confidence (50-60 MPH gusts potential coastal spots s LI and NJ, as well as 1-4" rain). BUT as noted previously by others, a little early to be sure though WPC D7 QPF has accepted the likelihood of a significant storm. BOM has not. Also duration of event is in doubt from a decent 18 hr hit to a lengthy 60 hour event. Too soon for a thread but many are monitoring. Have a day and will recheck tomorrow morning.
-

Central PA Fall Discussions and Obs
mahantango#1 replied to ChescoWx's topic in Upstate New York/Pennsylvania
So there wont be enough rain to flood Franklin out of the Penn State football area? -

Central PA Fall Discussions and Obs
Itstrainingtime replied to ChescoWx's topic in Upstate New York/Pennsylvania
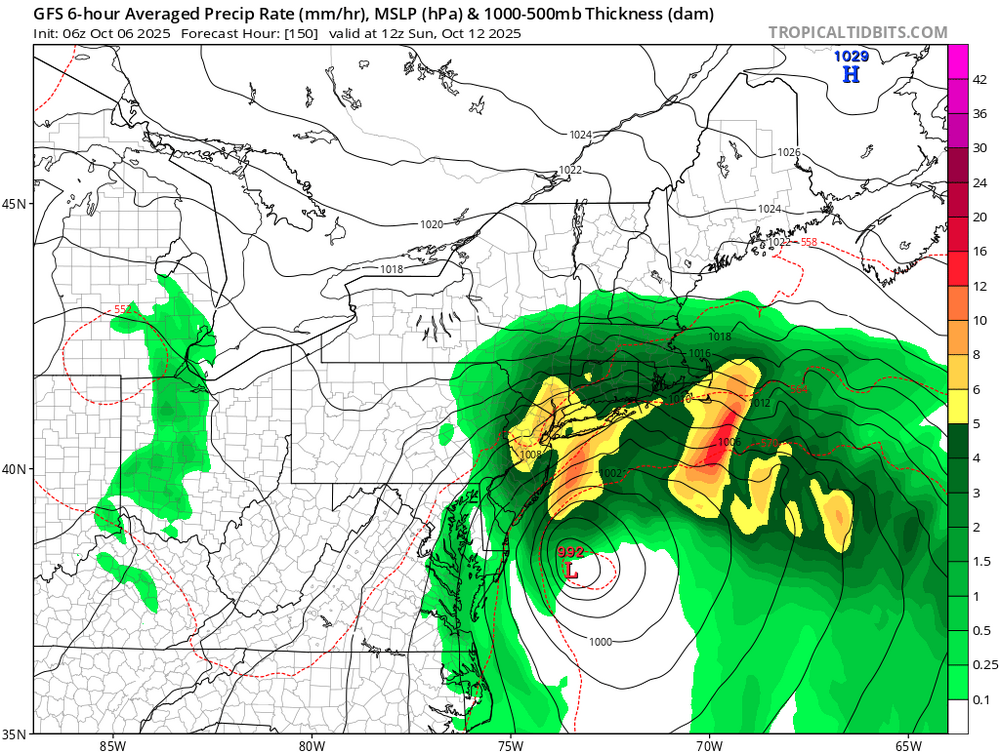
Morning GFS has a huge coastal storm this upcoming weekend. Unfortunately, not much in the way of rainfall makes it west of I95 for now. -

2025-2026 ENSO
40/70 Benchmark replied to 40/70 Benchmark's topic in Weather Forecasting and Discussion
I am not denying CC....we are warming, but I think some are getting a bit carried away with the attribution piece...especially considering the majority of GW impacts radiational cooling nights. Yes, storm days are also warming...but not to the same degree as the former. Now, if the 2030's are as lean as the 2020s, then I will capitulate to greater attribution. Now tell me, Chris...what would need to happen for you to question the attribution piece? Another all-time season seems like a rather lofty bar, no?? -
This would have been a sick snowstorm. The low eventually comes over us but only when it's already rotting and during most of the precip duration it's showing strong northerly to NE winds.
-

Spooky Season (October Disco Thread)
Chrisrotary12 replied to Prismshine Productions's topic in New England
New Hampshire Mid-Am is next Tuesday, Wednesday, Thursday. Talk about experiencing all seasons: Tuesday: sunny 80 Wednesday: wet 60 Thursday: cold 50 -
2025-2026 ENSO
40/70 Benchmark replied to 40/70 Benchmark's topic in Weather Forecasting and Discussion
My record lowest season is 19.9" in 1978-1979...hell, I had only 20.3 in 1988-1989, 28.2" in 1990-1991, 26.6" in 1991-1992 and 22.5" in 1994-1995.....about 23" in 2011-2012; yet in this new, warmer climate, I have managed at least 32.5" in every season since 2018-2019. Thank god for the increased moisture of CC. -
Saw a fireball this morning while driving NWish on MD-32 around 3:26am. Got a video and sent a report to https://www.amsmeteors.org/ - neat!
-
2025-2026 ENSO
40/70 Benchmark replied to 40/70 Benchmark's topic in Weather Forecasting and Discussion
Here is a radical suggestion.....hear me out....maybe, just maybe....all-time record snowfall seasons don't grow on trees and are kind of anomalous?? Just a thought- This harkens back to my point about how there is nothing that could happen that would ever change your mind....had we never set those records, it would be because of CC....now, since we have set them and haven't kept up with that record pace.....it's because of CC. Any guesses on how it would be rationalized if we do it again....."well, it won't happen again in this newer and even warmer climate". You will use that higher record to rationalize that CC is why we have't topped it yet again. -
A nice little soaker on all the models for the Tuesday event on 6z.
-
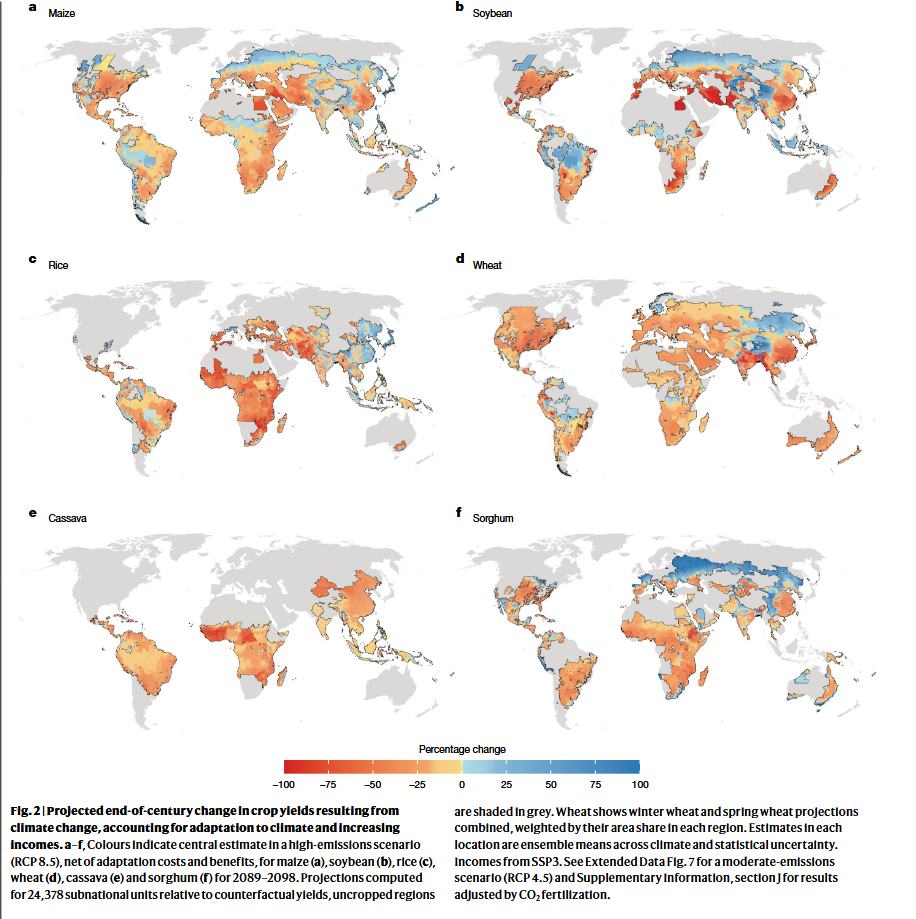
A quick check indicates that CO2science is not a balanced website. Its advocating against US regulation of CO2 emissions and focusing on the benefits of CO2 on plant growth without acknowledging offsetting adverse impacts. I'd put it in the climate denial camp. I ourworldindata piece I linked above is more trustworthy. Recent gains in yields are mainly from improved seed genetics and increased fertilizer and other inputs. You have to strip that out to get climate change impacts. I googled up this recent Nature paper which finds significant future negative impacts on agriculture, even after farmer adaptation, albeit from a high emissions scenario. I haven't gone through the literature review section but that would be a good place to start on recent scientific work in this area. https://www.nature.com/articles/s41586-025-09085-w.pdf

-
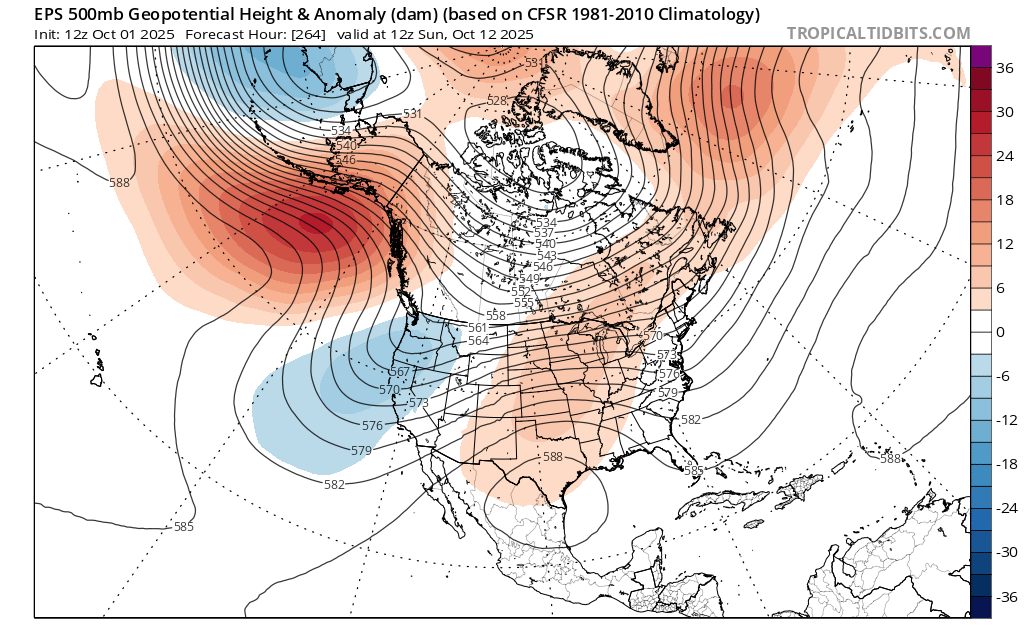
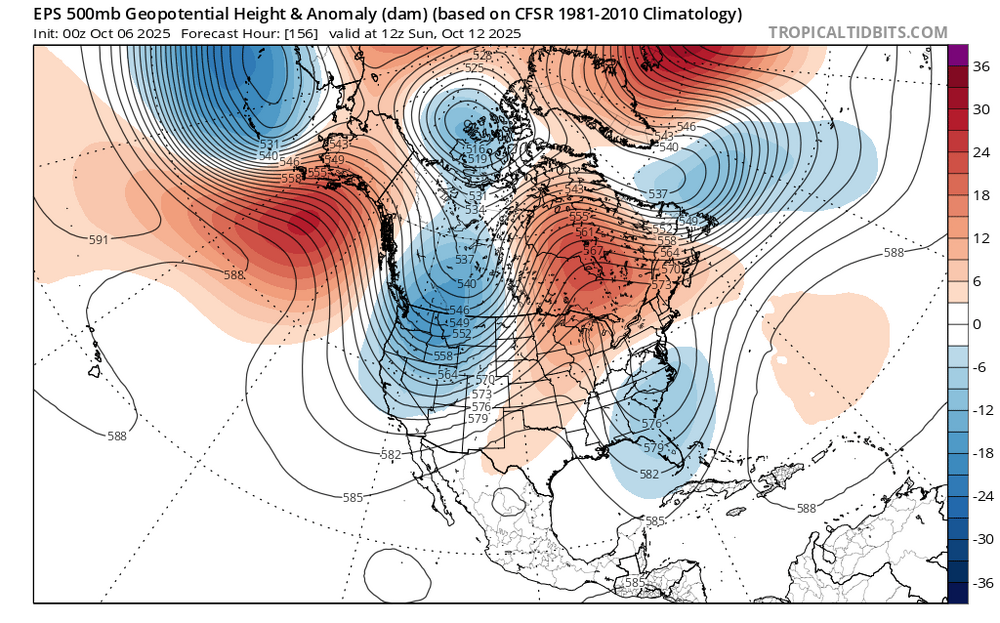
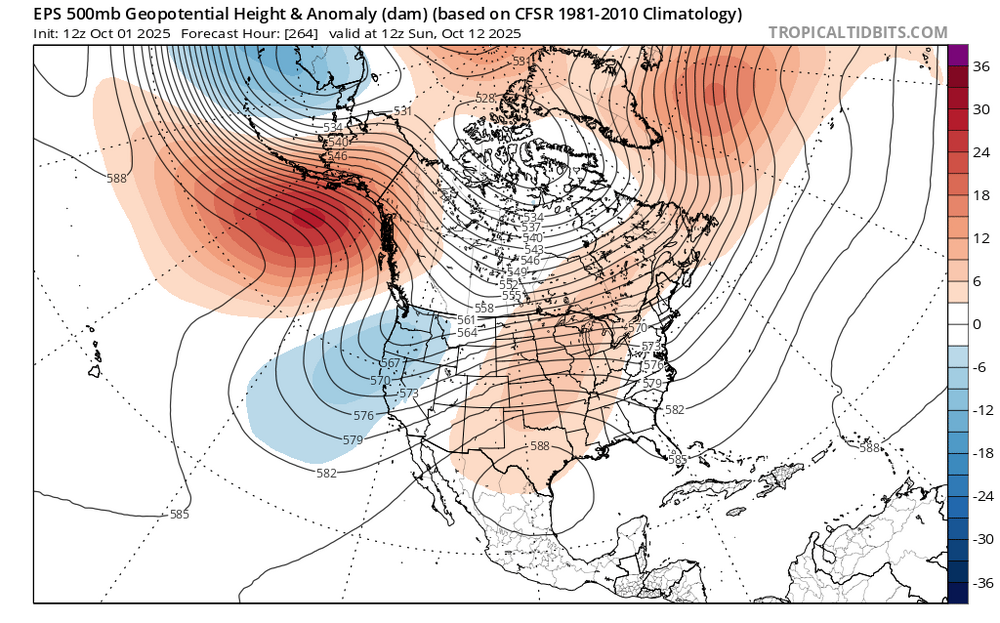
Much stronger blocking forecast now as we approach mid-October. So a cutoff near the mid Atlantic coastline is a plausible scenario. Would like to wait until it gets under 120 hrs to get interested in a soaking rain for at least parts of the area. New run Old run
-
Especially the Euro. It basically washes out the weekend. Of course I have plans so it's definitely a lock. I thought droughts were dry lol
-

Spooky Season (October Disco Thread)
Damage In Tolland replied to Prismshine Productions's topic in New England
We’ll see what Mesos do next 2 days -
The warmer climate is directly to blame for the lowest 7 year snowfall run along the I-95 corridor from DC to Boston. It’s also the reason that this has been the warmest 10 year winter period in U.S. and Northeast history. The dramatic temperature jump since December 2015 and storm track shift since 2019 is the reason that no sites have rivaled their seasonal snowfall records set from 92-93 to 14-15. A few locations were still able to set single storm and monthly records as recently as March 18.
- Today
-
Spooky Season (October Disco Thread)
jbenedet replied to Prismshine Productions's topic in New England
My climo average temps are off by about -5. I know that whimsical “assumption” gonna take a bunch of scrutiny but it’s a simple enough exercise to work through… If I made that change for the year, the distribution of normal, AN, and BN days and the magnitude of the anomalies I believe would better fit today’s climo. -
Spooky Season (October Disco Thread)
jbenedet replied to Prismshine Productions's topic in New England
Coastal storm showing up across guidance next weekend. -
2025-2026 ENSO
40/70 Benchmark replied to 40/70 Benchmark's topic in Weather Forecasting and Discussion
No...reflection event mid January...the warming is after that...anytime from later in January into mid Feb. This is just based on my analogs and research....don't mean to speak in absolutes or sound arrogant. Odds are I am wrong. -
E PA/NJ/DE Autumn 2025 Obs/Discussion
BBasile replied to PhiEaglesfan712's topic in Philadelphia Region
Have some pretty dense fog out there this morning. 59F -
2025-2026 ENSO
40/70 Benchmark replied to 40/70 Benchmark's topic in Weather Forecasting and Discussion
Yes.....GW must be to blame for not having a top 3 all-time snowfall season over the past 9 years. In fact, if I can't score a 40" event this season, then that solidifies it in my mind. No doubt- -
6z gfs has the noreaster
-
It was a top 3 for 100° days for many locations. Time Series Summary for NEWARK LIBERTY INTL AP, NJ - Jan through Dec Click column heading to sort ascending, click again to sort descending. 1 1993 9 0 2 1949 8 0 3 2025 7 87 4 2022 6 0 - 1953 6 0 5 1988 5 0 - 1966 5 0 Time Series Summary for HARRISON, NJ - Jan through Dec Click column heading to sort ascending, click again to sort descending. 1 2025 6 87 2 1999 5 4 3 2022 4 0 - 2010 4 30 - 2006 4 4 - 2005 4 9 4 2024 3 0 - 2012 3 21 - 2011 3 30 - 2001 3 7 5 2021 2 0 - 2019 2 0 - 2013 2 0 Time Series Summary for LAGUARDIA AIRPORT, NY - Jan through Dec Click column heading to sort ascending, click again to sort descending. 1 2006 4 0 - 1955 4 0 2 1953 3 0 3 2025 2 87 - 2013 2 0 - 2010 2 0 - 2005 2 0 - 1999 2 0 - 1991 2 0 - 1966 2 0 Time Series Summary for JFK INTERNATIONAL AIRPORT, NY - Jan through Dec Click column heading to sort ascending, click again to sort descending. 1 2010 3 0 - 1966 3 0 2 2025 2 87 - 2011 2 0 - 1993 2 0 - 1983 2 0 - 1948 2 Time Series Summary for CALDWELL ESSEX COUNTY AP, NJ - Jan through Dec Click column heading to sort ascending, click again to sort descending. 1 2025 3 89 2 2011 2 0 - 2010 2 0 - 1999 2 151 3 2021 1 3 - 2019 1 2 - 2012 1 10 - 2005 1 1 - 2001 1 5
-
2025-2026 ENSO
PhiEaglesfan712 replied to 40/70 Benchmark's topic in Weather Forecasting and Discussion
JAS ONI (NOAA): -0.3 JAS RONI: -0.63 -
Maybe I just hadn’t noticed yet, but overnight runs jumped on this coastal low giving us rain this weekend. Looking back, 18z Saturday Euro AI was the first run to pull it west enough for rain in the metro areas, but overnight 0z runs are really the first showing rain on the physics-based models.