All Activity
- Past hour
-
PD2 was better than ANY of those storms besides January 1996 and January 2016.
-
Nor should anyone ... ... But, if this winter behaves incongruently more so than "average weirdness" ( haha ), which again... was suggested by climate model/predictions all along ( so is not unprecedented in that sense) ... it's fair to consider the classical methods are less reliable. None of these teleconnectors are 1::1 ... never have. They can't be. There is a polymonial of contributing forces, each one more less powerful - so scaling the equations for influence does not result a consistent contribution from their individual parts from year to year. Within that noise, there is tendency in the last 10 years ( rather consistently...) to be "more noisy" lol for lack of better phrase.
-
 Caution Liberty, nycwinter may be on to something. As always …..
-
You forgot PD2, we had 26 inches of snow in that one. February 2006 was very minor compared to that (half the snow and 02-03 was one of our greatest winters ever and only wall to wall besides 95-96).
-
1.89" will do it for me. 3.58" for the month
-
What are the top 3 highest since 2007?
-
 so wild, I think some places reached 100 degrees in 1983 in July, August AND September??? Can you check to see which ones did that-- I'm sure some place in Queens did as JFK hit 100 in both July and August in 1983 and 98 in September (NYC hit 99).
 -
Gee ...any marine taint today ? https://weather.cod.edu/satrad/?parms=local-Rhode_Island-02-24-1-100-1&checked=map&colorbar=undefined
-
 The peak heat in 2010 was focused in July like we typically see. The most unusual heat in 1983 was the record heatwave coming so late on September 10th-11th. Could be related to the drought which developed that summer. That may be the last time that Queens reached 100° so late in the season. Monthly Data for July 2010 for Upton NY NWS CWA Click column heading to sort ascending, click again to sort descending. NY MINEOLA COOP 108 NY WANTAGH CEDAR CREEK COOP 107 NJ CANOE BROOK COOP 107 NJ RINGWOOD COOP 106 NJ HARRISON COOP 106 CT DANBURY COOP 104 NJ CRANFORD COOP 104 NY WEST POINT COOP 103 NJ TETERBORO AIRPORT COOP 103 NY SHIRLEY BROOKHAVEN AIRPORT WBAN 103 NJ NEWARK LIBERTY INTL AP WBAN 103 NY LAGUARDIA AIRPORT WBAN 103 NY NY CITY CENTRAL PARK WBAN 103 NJ TETERBORO AIRPORT WBAN 103 Data for September 10, 1983 through September 11, 1983 Click column heading to sort ascending, click again to sort descending. NJ PLAINFIELD COOP 100 NY NEW YORK LAUREL HILL COOP 100 NJ CRANFORD COOP 99 NJ NEWARK LIBERTY INTL AP WBAN 99 NY NY WESTERLEIGH STAT IS COOP 99 NY NY CITY CENTRAL PARK WBAN 99 NY WESTBURY COOP 99 NJ JERSEY CITY COOP 98 NJ CANOE BROOK COOP 98 NY NEW YORK AVE V BROOKLYN COOP 98 NJ ESSEX FELLS SERVICE BLDG COOP 98 NY DOBBS FERRY-ARDSLEY COOP 98 NY WEST POINT COOP 98 NY GARNERVILLE COOP 98 NY JFK INTERNATIONAL AIRPORT WBAN 98 NY VANDERBILT MUSEUM COOP 98 NY WESTCHESTER CO AP WBAN 98 CT NEW HAVEN COOP 98 Data for September 10, 1983 through September 11, 1983 Click column heading to sort ascending, click again to sort descending. PA PHILADELPHIA WBAN 102 NJ EWING 3 WNW COOP 101 MD CENTREVILLE COOP 100 MD CHESTERTOWN COOP 100 DE BRIDGEVILLE 1 NW COOP 100 DE NEWARK AG FARM COOP 100 DE MIDDLETOWN 3 E COOP 100 PA MARCUS HOOK COOP 100 NJ SHILOH COOP 100 DE WILMINGTON AIRPORT WBAN 100 PA DEVAULT 1 W COOP 100 PA READING 4 NNW COOP 100 NJ AUDUBON COOP 100 NJ LAMBERTVILLE COOP 100
 -
Thanks, Don, I strongly suspect these have become more rare with time just like full length winters like 1995-96 and 2002-03 have become much more rare. 1953 and 1983 really jump out from this list as having the highest frequency of such months.
-
beautiful deep blue skies today, nice change of pace after a summer of hazy/milky garbage free nelson
-
1983 does much better if you include September, that was a scorcher of a month!! My favorite summers would have been: 2011, 2010, 2002, 1999, 1983, 1980, 1966, 1955, 1953, 1949, 1948, 1944 Those would be my top 12.
-
 Here they are: Bridgeport: 1953 Islip: None New York City-Central Park: 1921, 1931, 1953, 1983, 1993 New York City-JFK Airport: 1983 New York City-LaGuardia Airport: 1953, 1983, 2010, 2018 Newark: 1914, 1931, 1944, 1953, 1973, 1983, 1989, 1991, 1993, 2010, 2018 White Plains: 1953
 -
That weather was much better than this weather, Chris, I already turned on my heat for the last two days and my allergies have returned.
-
I have a strong feeling you like your hoodies because you wouldn't look good in anything else lol.
-
It just occurred to me that going back to 96 we've managed big storms at 5 year intervals, with of course other big storms between. Can we keep it going? 95-96 January 96 00-01 December 2000 05-06 Feb 2006 10-11 Boxing day and Jan 2011 15-16 Jan 16 blizzard 20-21 Feb 21 snowstorm 25-26 ???
-
No way, this is the worst weather of the entire year, it's okay to get rain for 6 hours or so, but this is a crap 2 day pattern that has brought my allergies back. I have had the heat on for 2 days too, this wind makes it even worse.
-
 it feels like a late october day this morning chilly breezy perfect hoodie weather.
 -
 We had a nice 2 week stretch with sun. It looks like a nice 3 days Fri - Sun coming up and may see some breaks in the clouds today
 -
the worst weather of the entire year =\
-
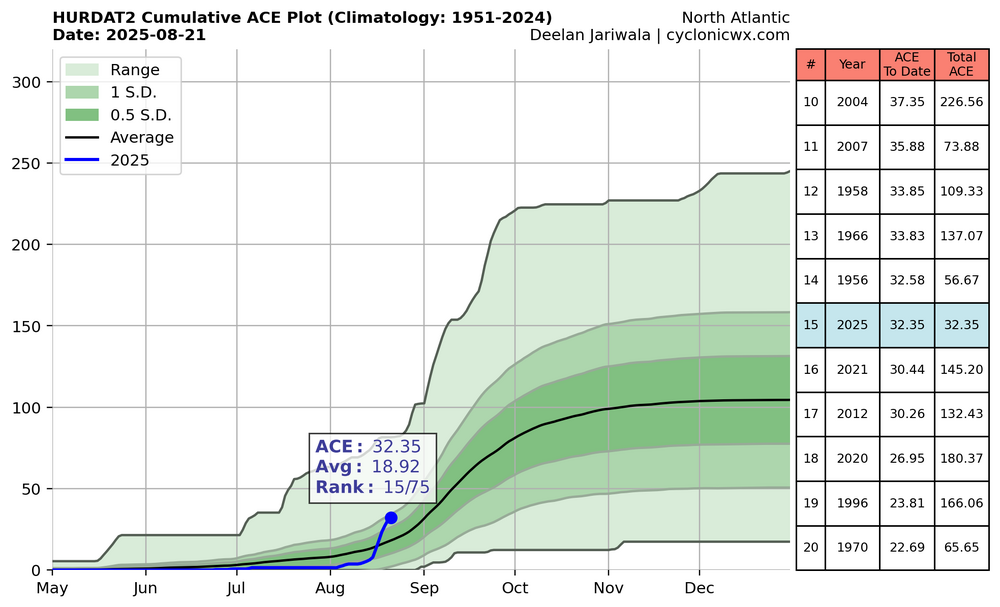
1. Erin will end up with ~33-4 ACE, which you didn’t forecast. Currently, 2024 has sharply risen to 15th of the last 75 years and it will rise several positions from there before Erin winds down, when total ACE should be ~36-38: 2. It does appear quiet ~8/24-9/7 on the ensembles/Euro Weeklies and there could easily be below normal ACE through that period. But even if so and allowing for ~5 added ACE by 9/7, ACE would still be near normal (in the 40s). 3. The Euro Weeklies have then been showing an increase in activity (likely MJO related), especially during 9/15-21: 9/8-14: 10-11 ACE 9/15-21: 13-15 ACE If these verify well, ACE would then be in the 60s. 4. The tendency in recent years, especially during cold ENSO has been for a more active late Sept through Nov. 2024 had its most active period late Sept-mid Oct. If that occurs again, 2025 would end up as another active season.
-
1983 must have been very similar, as there was close to 100 degree heat all the way into mid September. Maybe this kind of pattern is more normal after a big el nino ends and just before a big la nina begins? The good thing about living where I live is the sea breeze comes in after 3 pm, so we usually peak with our high temperatures before then. As a matter of fact, this is why I think it's weird to have a highest temperature after 4 pm since I'm just not used to it. Even on our triple digit days the highest temperature usually happens by 2 pm. Last June was an outlier because I recorded 106 at 4:30 pm.
-
Our summers are more deep than our winter snow packs now
-
Records: Highs: EWR: 97 (2005) NYC: 96 (1955) LGA: 97 (1955) JFK: 91 (2005) Lows: EWR: 53 (1949) NYC: 53 (1922) LGA: 57 (1957) JFK: 50 (1977) Historical: 1856 - The Charter Oak was an unusually large white oak tree growing from around the 12th or 13th century until it fell during a windstorm on this day in 1856. According to tradition, Connecticut's Royal Charter of 1662 was hidden within the hollow of the tree to thwart its confiscation by the English governor-general. The oak became a symbol of American independence and is commemorated on the Connecticut State Quarter. 1883 - An estimated F5 tornado caused extensive damage to Rochester Minnesota on this day. The enormous roar was said to have warned most Rochester residents, as the massive funnel cut through the north side of town. Over 135 homes were destroyed, and another 200 damaged. Many of the 200 plus injuries were severe, and other deaths probably occurred but not listed as part of the 37 total mentioned. This damaging tornado eventually led to the formation of the Mayo Clinic. 1888 - A tornado swarm occurred in Maryland and Delaware. Many waterspouts were seen over Chesapeake Bay. (Sandra and TI Richard Sanders - 1987) 1893 - Four hurricanes are observed in the Atlantic Ocean at the same time. Over a century would pass, 1998 before four hurricanes would again rage together in the Atlantic. 1918 - A tornado struck Tyler, MN, killing 36 persons and destroying most of the business section of the town resulting in a million dollars damage. (David Ludlum) 1974: Gulfport, Miss.--A woman was killed and her two nephews were injured by lightning while taking clothes off a clothesline during a thunderstorm. (Ref. Lightning-The Underrated Killer.pdf) 1977: Illinois experiences its first killer August tornado since at least 1880. The twister was mostly obscured by heavy rain as it killed 6 at the Lake Matoon resort area. Illinois' next August killer tornado, also obscured by heavy rain (and hail), killed 29 on 8/28/90 just southwest of Chicago. (Ref. AccWeather Weather History) 1980: Third consecutive day of heavy rains and flooding in West Virginia. 8.5 inches of rain fell at Webster Springs in 3-day period. Many roads were closed by high water and mudslides. Evacuations were necessary. Near Ripley, WV numerous houses, trailers and a store were washed away. At Spencer, as much as 4 inches of rain fell and Charleston had 60-mph winds. (Ref. AccWeather Weather History) 1983 - The temperature at Fayetteville, NC, soared to 110 degrees to establish a state record. (The Weather Channel) 1984: State fair in Pueblo, CO, had to be closed during vicious hailstorm. Nine people were hurt, one seriously. Damage totaled $40 million and 500 light bulbs were broken by the hail. (Ref. AccWeather Weather History) 1987 - Early morning thunderstorms produced severe weather in eastern Iowa and west central Illinois. Thunderstorms produced wind gusts to 82 mph at Moline IL, and tennis ball size hail at Independence IA. Rock Island IL was drenched with 3.70 inches of rain. Total damage for the seven county area of west central Illinois was estimated at twelve million dollars. (National Weather Summary) (Storm Data) 1988 - Thunderstorms spawned several tornadoes in Iowa, produced wind gusts to 63 mph in the Council Bluffs area, and drenched Sioux Center IA with up to 6.61 inches of rain. (Storm Data) (The National Weather Summary) 1989 - Afternoon and evening thunderstorms produced severe weather from Kansas to Minnesota and North Dakota. Thunderstorms in Minnesota produced baseball size hail from Correll to north of Appleton. Thunderstorms in north central Kansas produced wind gusts higher than 100 mph at Wilson Dam. Thunderstorms around Lincoln NE produced baseball size hail and up to five inches of rain, and Boone NE was deluged with five inches of rain in an hour and a half. (The National Weather Summary) (Storm Data) 1992: Hurricane Andrew strengthens north of Puerto Rico and turns more west. Maximum sustained winds 60 mph.(Ref. AccWeather Weather History) 1994 - Hurricane John, about 345 miles south of Hilo, Hawaii had winds of 175 mph and pressure at 920 millibars or 27.17 inches of mercury, making it one of the strongest hurricanes ever in the Central Pacific. The 31-day existence made John the longest-lasting tropical cyclone recorded in both the Pacific Ocean and worldwide, surpassing both Hurricane Tina's previous record in the Pacific of 24 days in the 1992 season and the 1899 San Ciriaco hurricane's previous world record of 28 days in the 1899 Atlantic season. John was also the farthest-traveling tropical cyclone in both Pacific Ocean and worldwide, with distance traveled of 7,165 miles, out-distancing previous record holders Hurricane Fico in the Pacific of 4,700 miles in the 1978 season and Hurricane Faith worldwide of 6,850 miles in the 1966 Atlantic season. 2005: Record highs throughout the NYC metropolitan and New Jersey area. 96 at New York City and 97 in Newark, NJ.
-
I guess what I meant by deep summer is high 80s-90s. There will def be warm stretches. Dews seem more manageable as well.