All Activity
- Past hour
-
Weeklies
-
40s and 50 down here for my sons baptism
-
April 22 1874: Unseasonably cold air moves into Minnesota. The low is 23 degrees at the Twin Cities. For Wednesday, April 22, 2026 1883 - An outbreak of tornadoes from Louisiana to Kansas claimed the lives to 200 persons. One of the tornadoes destroyed the town of Beauregard MS. (David Ludlum) 1980 - A record April heat wave sent the mercury up to the 100 degree mark in Iowa. (The Weather Channel) 1987 - Fifteen cities in the southeastern U.S. reported new record high temperatures for the date. The afternoon high of 96 degrees at Pensacola FL established a record for the month of April. (The National Weather Summary) 1988 - Heavy snow fell over northern Nebraska, with 15 inches reported at Mullen. Heavy snow also blanketed the mountains of northern Arizona, with 16 inches reported at Munds Park. (The National Weather Summary) (Storm Data) 1989 - Twenty-seven cities in the central U.S. reported record high temperatures for the date. The high of 96 degrees at Omaha was an April record, and the high of 100 degrees at Lubbock TX equaled their record for April. Hill City KS and Liberal KS tied for honors as the hot spot in the nation with afternoon highs of 103 degrees. (The National Weather Summary) 1990 - Thunderstorms produced severe weather from the Southern and Central High Plains to northwest Florida during the afternoon and evening. Thunderstorms produced wind gusts to 67 mph at Gillette WY, hail two inches in diameter west of Roswell NM, and deluged Cheyenne OK with 8.68 inches of rain leaving some parts of the town under five feet of water. Temperatures reached the low 90s in the north central U.S. Chamberlain SD and Pickstown SD tied Presidio TX for honors as the hot spot in the nation with afternoon highs of 94 degrees. (The National Weather Summary) (Storm Data) 2011 - Lambert International Airport in St. Louis experiences extensive damage as it is hit by a group of tornados, blowing out windows in the main terminal and tearing the roof off Concourse C. Five people were taken to the hospital with minor injuries from shattered glass and flying debris.
-
Oh, completely agreed! ( full disclosure, I'm hoping for it). I don't wanna give Kevin any reason at all to start pimping utterly fallacies in attempts to set up the dystopian d-drip doses all summer... meanwhile, my lawn stays green until mid august. Yeah, as far as the NAO handling... it's ( we know this -) obviously a stochastic index domain... but I just sort of ignore the distractions of the individual model runs and just rely on a combination of 3 basics: the 5 day running mean of the synoptic structure; climatology; personal experience - as you mentioned, that -NAOs tend to blossom/lag after a period of usual early warmth - particularly when said warmth is over the eastern mid latitude continent. This latter need correlative proof and is personally anecdotal, but it is a late winter and spring phenomenon I have noted over many years. Just combining all that gunk... -NAO appears set up and well ?
-
An OK call. A little slow with frontal passage that went through yesterday. System will be moving through starting tomorrow.

-
Sorry man, I moved out of Prince Frederick and took the rain (and snow?) with me to the mountains. It really is happening, I knew it would. My old yard in PF is burning up. Driest month ever there since I had started keeping track.
-
People would probably hate this but like I mentioned yesterday, a Nor'easter bringing a region wide soaking wouldn't be the worst thing in the world. But lets just hope we start to flip things not too long after. I've been intrigued by this idea over the past few days and it got me thinking about what you said last week regarding there being some atmospheric hangover in the modeling from the current NAO we are in. Admittedly, I have not looked at ensembles yet and just going off some OP runs, so not sure what kind of signal the ensembles have, but just looking at the NAO forecast, there seems to be a bit of spread in the NAO forecast moving forward, but the signal is for the NAO becoming less negative over time...but if you play out the OP (GFS) that signal looks just opposite. So I am wondering if perhaps the OP might be a bit out too lunch. Looking at ensembles though would certainly help answer this question But I don't really care about that far ahead yet so haven't put any heavy detailed thought into it lol
-
Thought I'd post the GL ice maps. Still some out there in the N areas. Pretty robust year overall. Ships had been getting stuck in DLH earlier, as well as on the upper, and lower sides of the Soo Locks. Much better now, except for the lower Huron side which is keeping the CGC Mackinaw busy.


-
It looks 'to me' like that's sort of symbolic as a last hurrah, like a winter death gasp before those in the room swear to seeing a glow exiting the body... Might even manifest as a bona fide coastal/Nor'easter ( before gallooting, know that it would swept rains). And I wouldn't be shocked if a new moon is scheduled then, too. That's always like that. Jesus. I've stopped fighting why and just assume at this point. The Earth's atmosphere always wants to pick on Block Island during full moon/spring tide. Just use the modeled atmosphere to tell when the spring tide is there - without even using astro charts ... heh. If there isn't a spring tide, then the modeled low ends up not happening. "Seems" is not the same as correlation though so... tfwiw. Anyway, after that would-be event ( or just the 30th -2nd period in general), I sense a significant flip may occur - pun unavoidable. Lately I've seen very very subtle hints in the operational Euro model's extended artistry for blocking breakdowns. As of last night, the control version of both the EPS and the GEFs systems are nose diving the PNA very negative into the first week of the month. Mind us, this is the 22nd of April so it's not like that's a coon's age away. We'll see. I'm wondering if this time next week we're looking at an impressive see-saw warming over the eastern mid latitudes - above season/climo.
-
Nice couple of hours of rain down here. Still a bit of drizzle. Grass/weeds are happy.
-
Hopefully some real rain this weekend
-

2026-2027 El Nino
40/70 Benchmark replied to Stormchaserchuck1's topic in Weather Forecasting and Discussion
It's a more neutral north Pacific response, which means other hemispheric players are more influential. In 2023, the most prominent players were a raging +WPO/+NAO/-PDO. This is why I said that the NAO and the state of the extra tropical Pacific will be so crucial this year. I think that fact that 2023 resembled 1997 was largely due to the extreme +WPO both seasons. Dec 1997 actually had some blocking, hence the major SNE snow right before xmas. The PDO was also positive. 1982 was -WPO....my guess is we end up with a better extra tropical patten than 2023. -
Ray and Chris, If Nino 3.4 is at +2C vs 1991-2020 and surrounding tropics are also at +2C vs 1991-2020, there’s no warm El Niño tongue to do its forcing. Thus, it’s essentially neutral rather than super El Niño and officially is neutral for RONI. So, RONI is a better measure for strength of El Niño and La Niña for that matter. Do y’all agree? @bluewave
-
2026-2027 El Nino
40/70 Benchmark replied to Stormchaserchuck1's topic in Weather Forecasting and Discussion
Think of the information that be gleaned from ENSO concerning the hemispheric response as a continuum of sorts...of both strength AND type. Climate change is exacerbating the perils of a reductive analysis that considers merely strength of ENSO because the fact of the matter is that the hemispheric response is becoming more nuanced and varied. -
Not sure of the year but remember it. Looking at my records, my last freeze in 2016 was on 4/21. In 2020 the last freeze was 5/14 and it was on 5/15 in 2023, maybe one of those years?
-
2026-2027 El Nino
40/70 Benchmark replied to Stormchaserchuck1's topic in Weather Forecasting and Discussion
Simply knowing the strength isn't very helpful if you don't know what the response will be....quite the contrary, it can actually be misleading to a forecaster, which is the trap that I fell into in 2023. -
2026-2027 El Nino
40/70 Benchmark replied to Stormchaserchuck1's topic in Weather Forecasting and Discussion
-
2026-2027 El Nino
40/70 Benchmark replied to Stormchaserchuck1's topic in Weather Forecasting and Discussion
Yea......look at the absolute value of each to obtain a general idea of how strong the event is, but more importantly, it's the relationship between the RONI and ONI that is indicative of the type of response that ENSO may induce around the hemisphere. The latter is what we really need to understand because knowing how strong said response will be is pretty useless if we have no idea what the response will be. I suspect we are going to need the RONI to be at least equivalent or greater than the ONI to avoid yet another muted Aleutian low/se trough couple response. If we have a very strong El Nino with a lagging ONI, as was the case in 2023, then you get a very strong RIDGING response over se Canada and an Aleutian low/se trough that is still meager. -
Not as deep. Those will forever remain with more expected next winter.
-
I agree to a point, but it seems likely we will get multiple opportunities over the next two weeks. Sometimes a few .5" rainfalls is better than one big 2" rainfall for busting drought. Hopefully we can stop the bleeding anyway
- Today
-
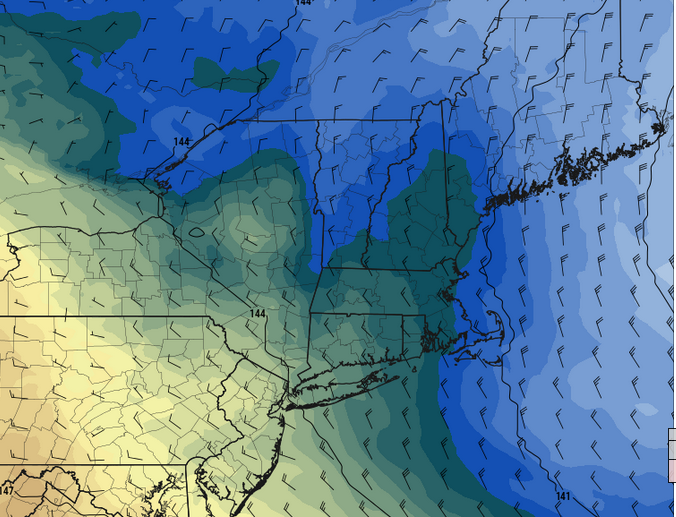
You can actually see the thermal processing of the lower levels on the 06z UKMET for Friday rather nicely... This lobe of modestly warmed 850 mb layout bulbing up over SNE around 21z is definitely because of the sun + compressed d-slope working it over. This is one of those 60 day dandies Brian was mentioning yesterday. I also recall mentioning a couple three days ago that the pattern didn't really look crushingly negative to me - more like neutral with an offsetting lean. It's just hard to get us BN frankly, unless we have more direct feeds of perpetual inject into the region - hint hint, which we did this last winter
-
Are the scars as deep as the ones you have from a series of failed winters?
-
More like the whole state.TN leads leads the nation with 46% being nocturnal tornadoes
-
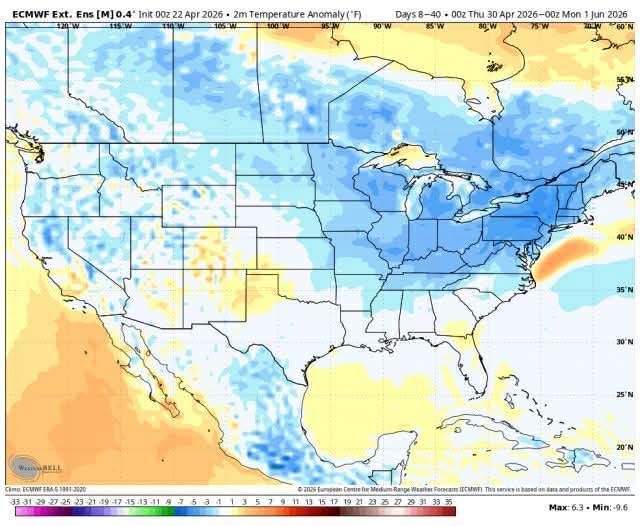
This air mass is both colder than normal, but also... rather prone to machine/automation busts. It's just because the sun is by now seasonally hugely potent, and growing. I was just looking at Friday... that's a general light WNW to NW down slope compression look under an 850mb -2 or -3. Jeez, I've seen it be almost 60 F over a snow pack in mid February due to full sun under 0C 850s. So, although-2 or -3 is a bit of a neg anom, the surface results can be offset quite a bit when compression from air down sloping happens under all that solar power dumping into the environment. Wouldn't shock me to see those MEX numbers verify too cool
-

2026-2027 El Nino
bluewave replied to Stormchaserchuck1's topic in Weather Forecasting and Discussion
Yeah, could be related. Same for the El Nino trough in the East which was much weaker in 2015-2016 and 2023-2024. I also think the much warmer adjacent off equator and subtropical oceans could be warping the response also. Those subtropical seas were so much warmer this winter that the weak La Niña ridge in the Southwest was so much stronger than the 1995-1996 weak La Niña response. It’s a bit challenging to give a specific value to just how much each individual marine heatwave is contributing. I have also been noticing discussions already taking place about the new RONI index. I went back and reread the paper on RONI and seems like most of the value was with La Ninas where the off equator warmth was masking the La Niña response. But when it comes to the strongest El Niños they can appear weaker than the past ONI. But as we saw from 2023-2024, the weaker RONI didn’t correspond to a weaker ridge over Canada and the Northern Tier and any less warmth. Plus the global temperature jump was even more impressive than past even stronger ONI higher end El Niños. But we could make an argument that the weaker RONI and warmer off equator to subtropical SST warmth could have weakened the Aleutian trough and the trough in the East under the big ridge. This could also warp the rainfall response in some way than we normally get with such strong El niños related to the Southern Stream response. This is why we should probably still use the traditional ONI for the actual El Niño intensity and incorporate the RONI for the finer details like how the Aleutian Low and other troughs are responding.