All Activity
- Past hour
-
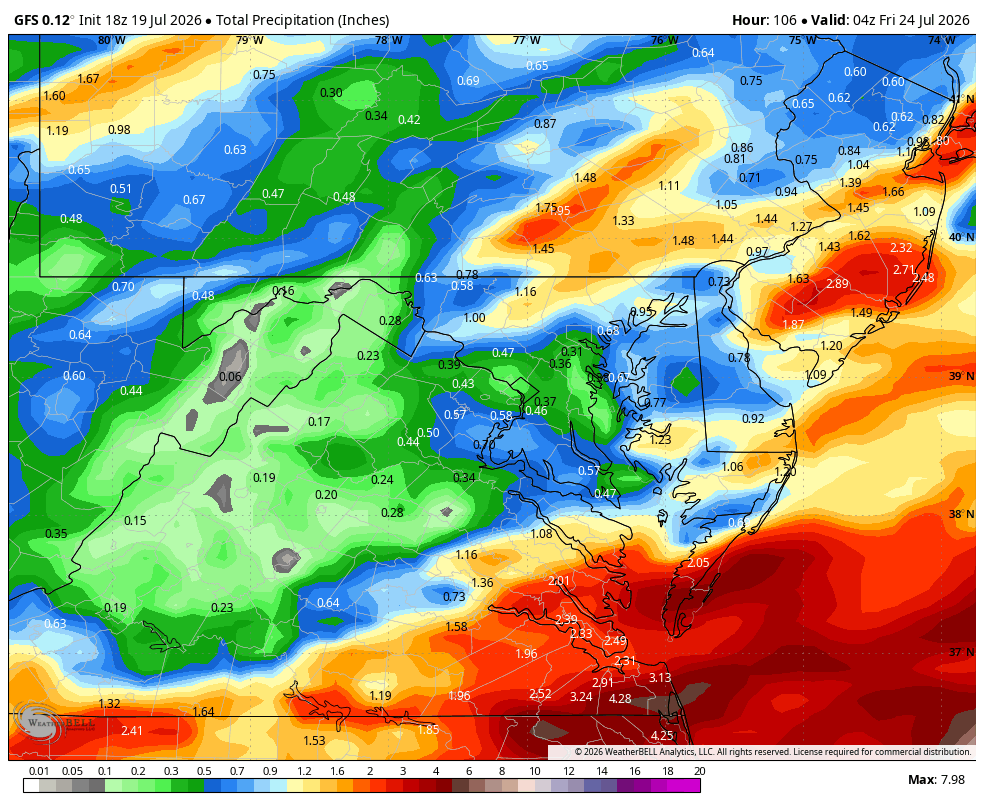
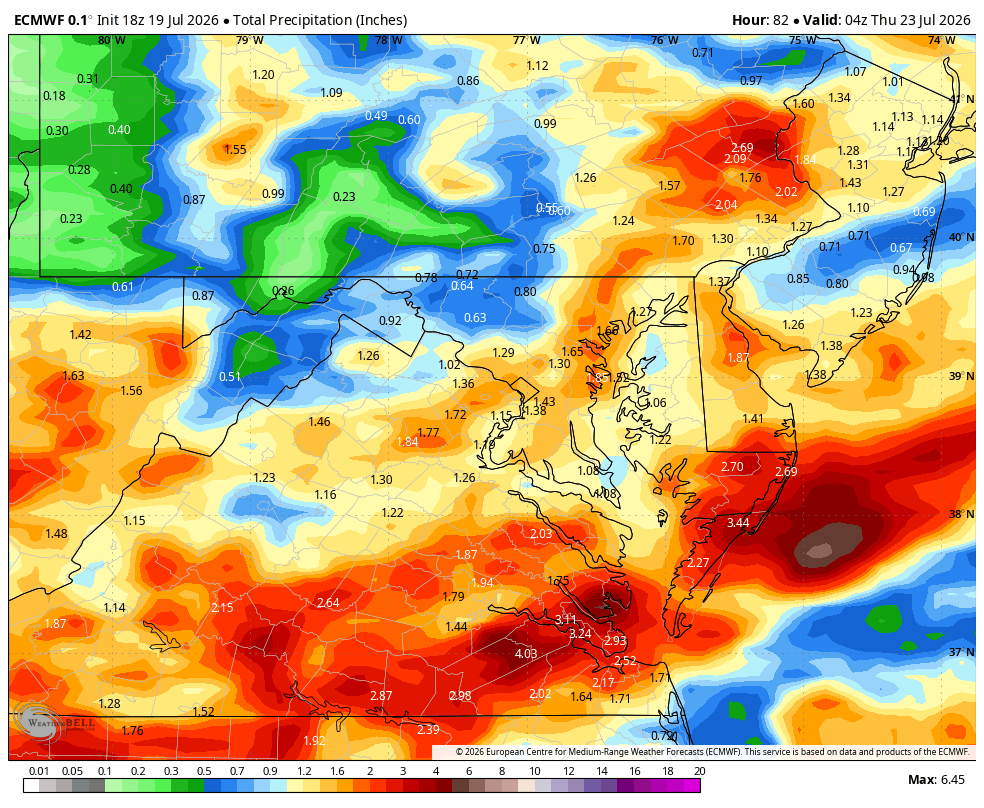
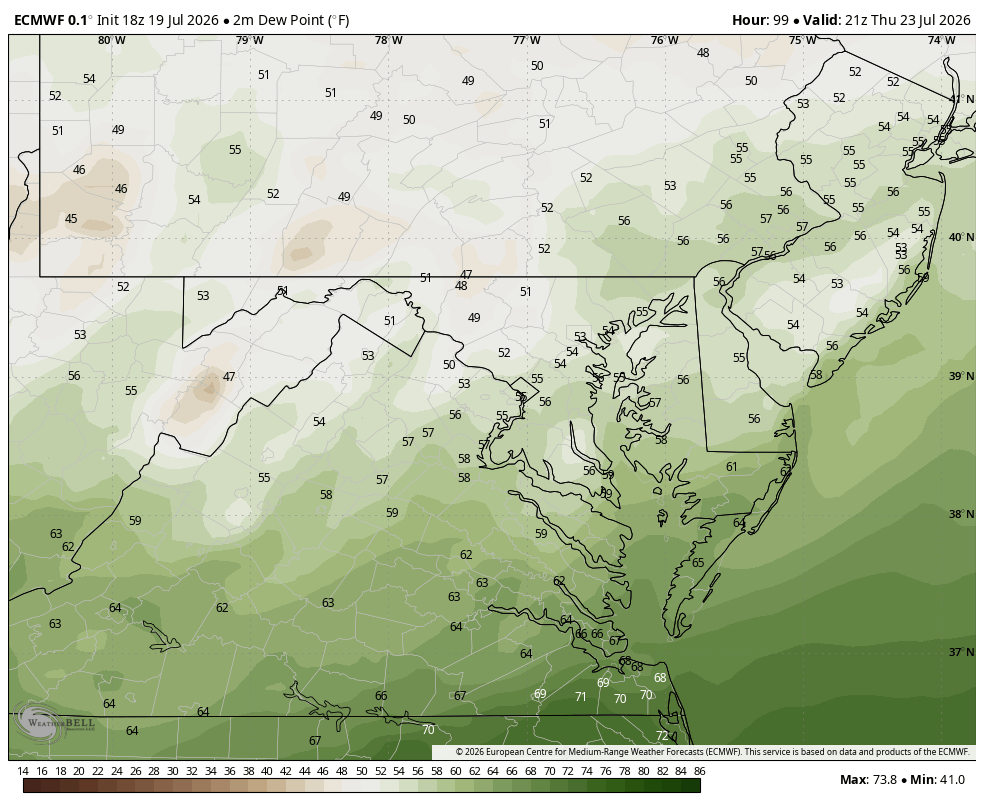
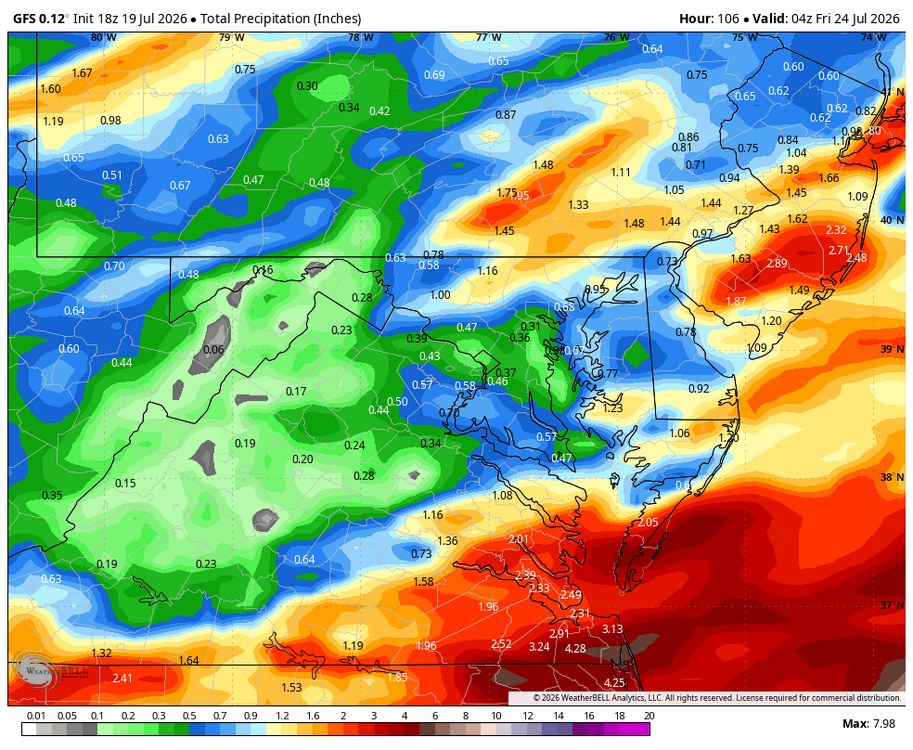
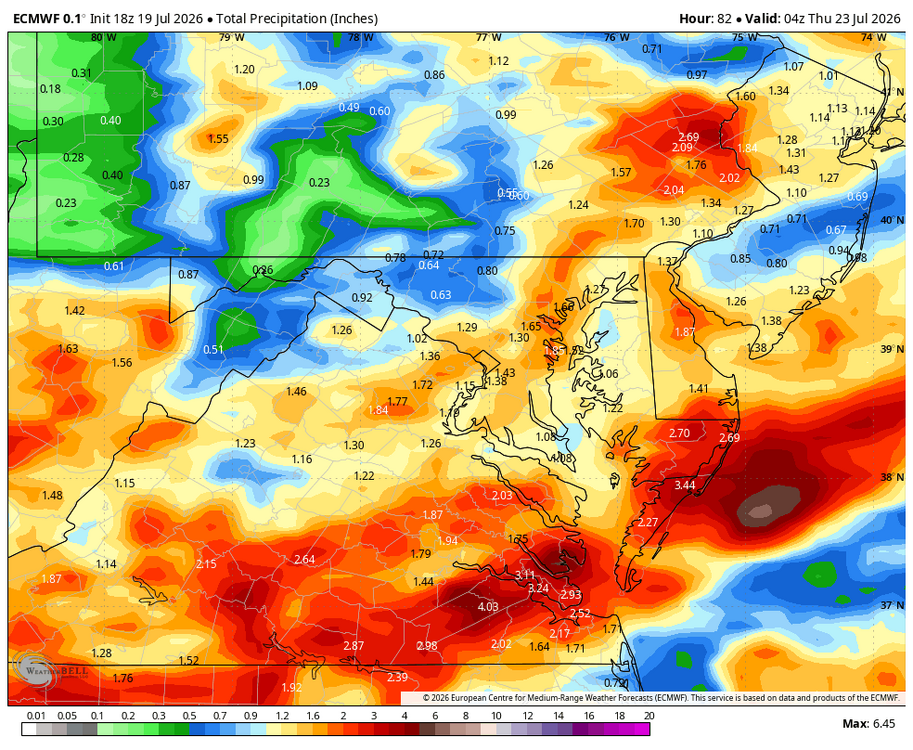
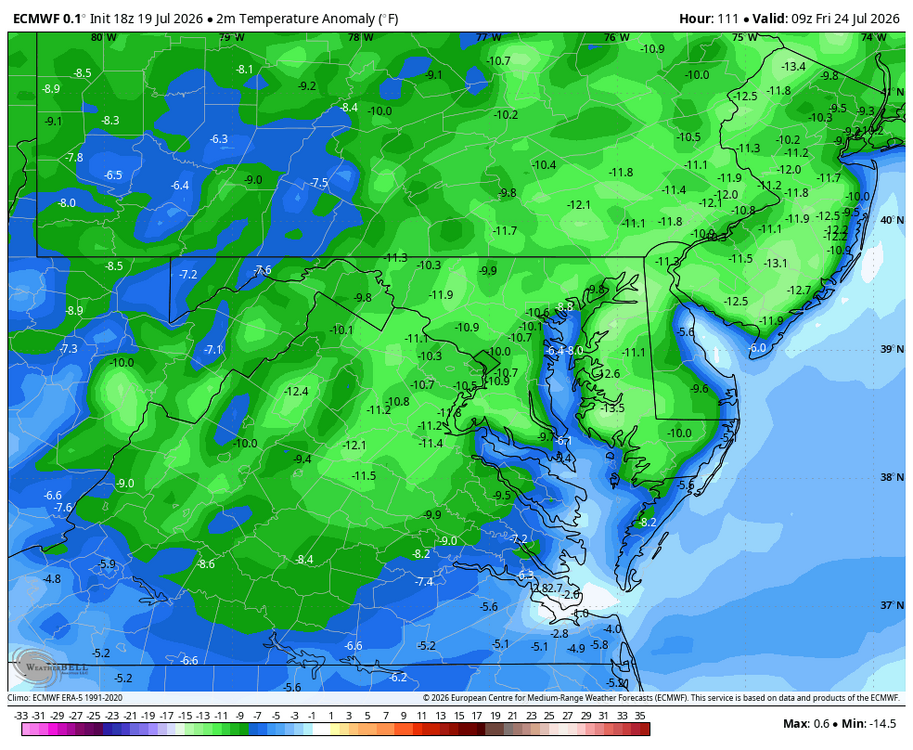
WB 18Z GFS and EURO for midweek rain.
-
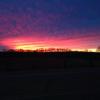 Im going to enjoy the next week of weather.. pretty much perfect for Summer
 -
at least average temps start going back down in a couple days..
-
 This place is something. It’s either wish casting for unbearable cold and snow in the winter or unbearable heat and humidity in the summer. Everything in between is something to bitch about. SMFH!
 -
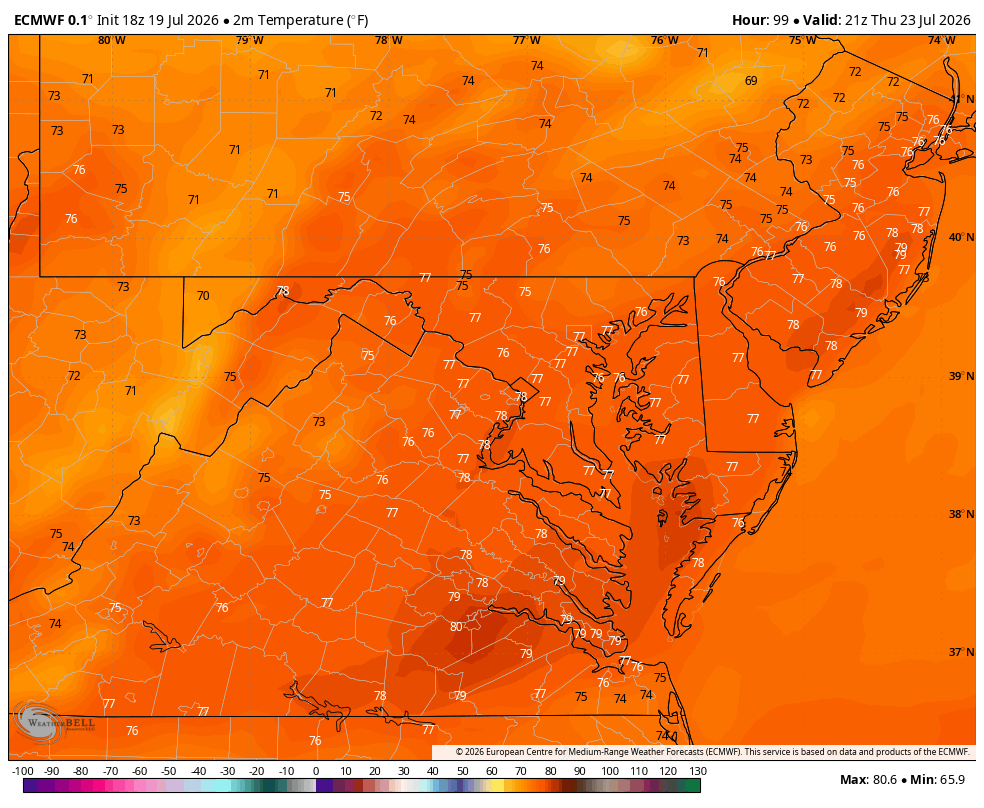
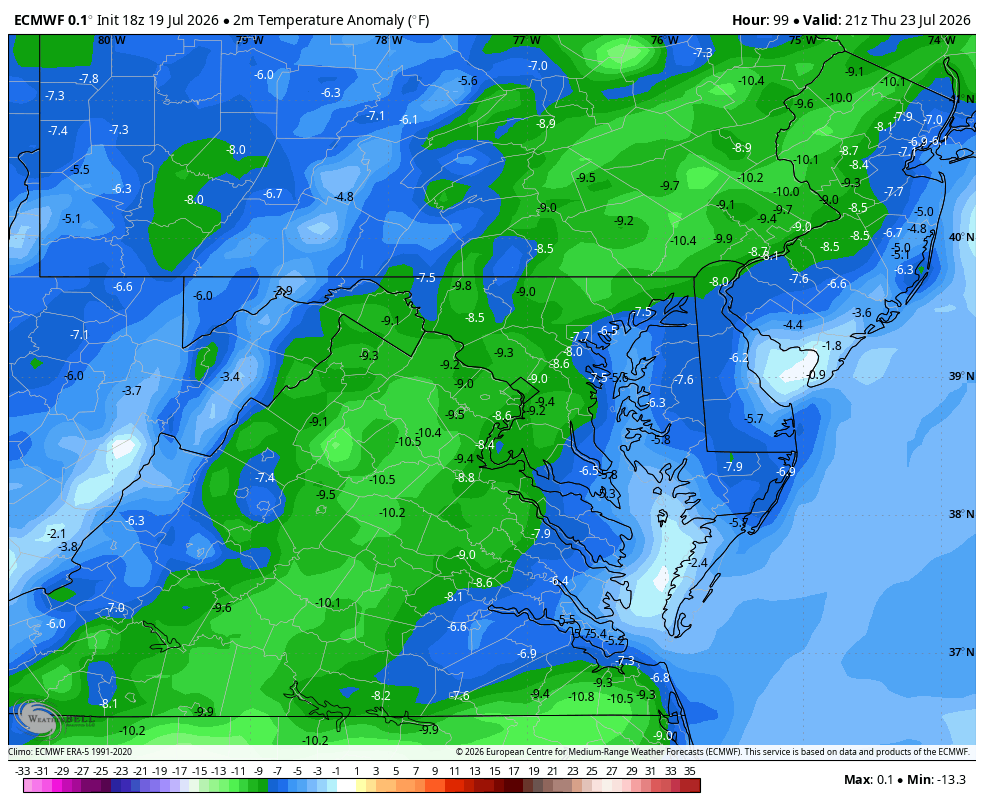
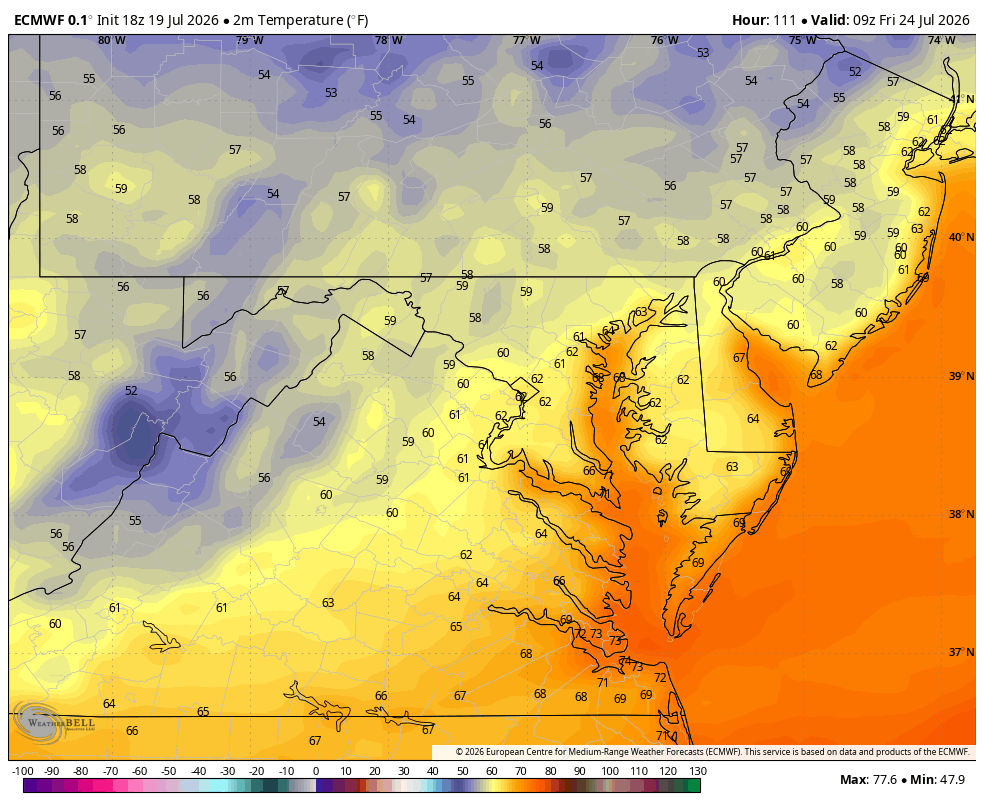
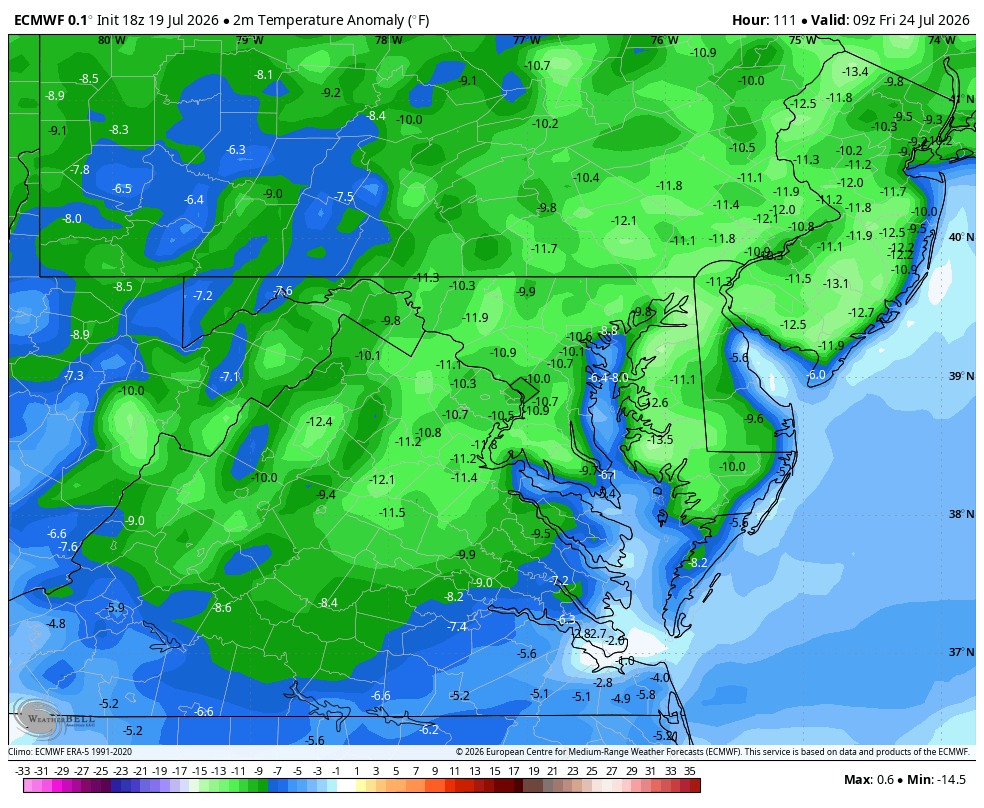
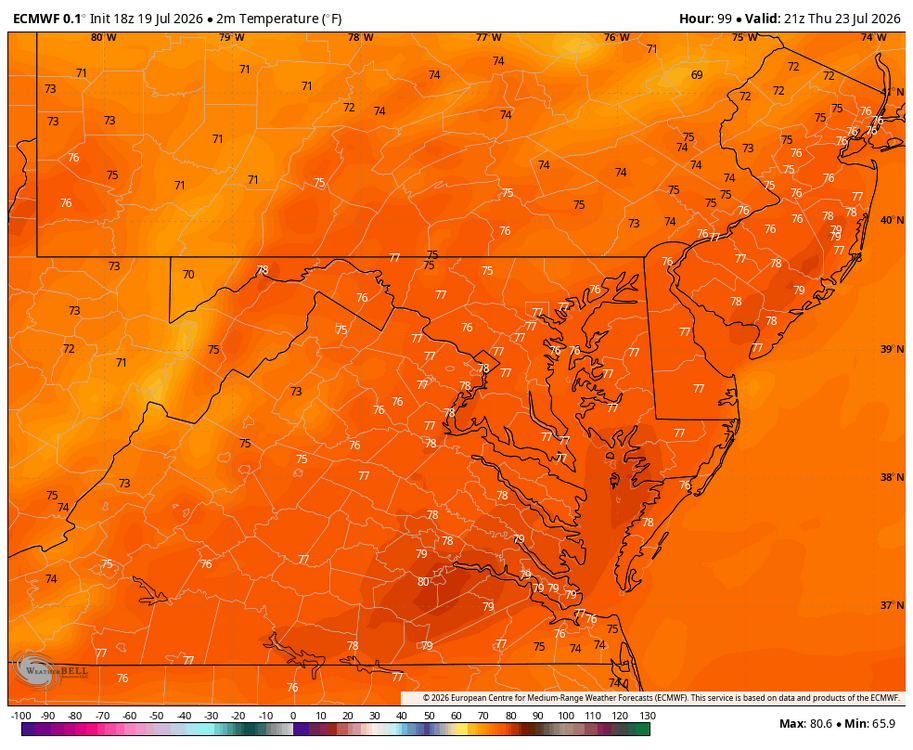
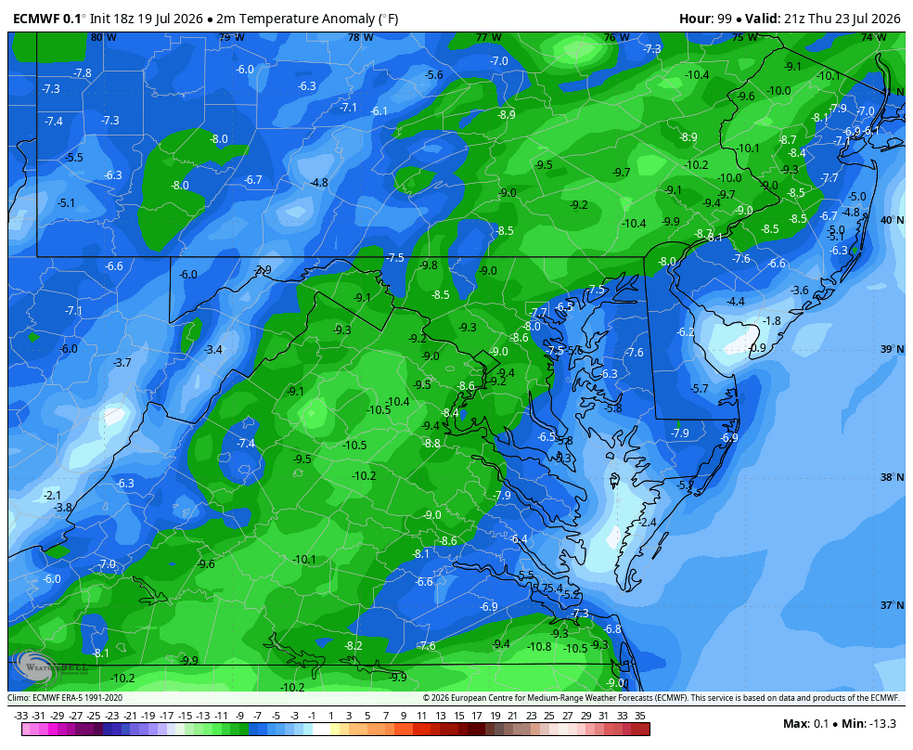
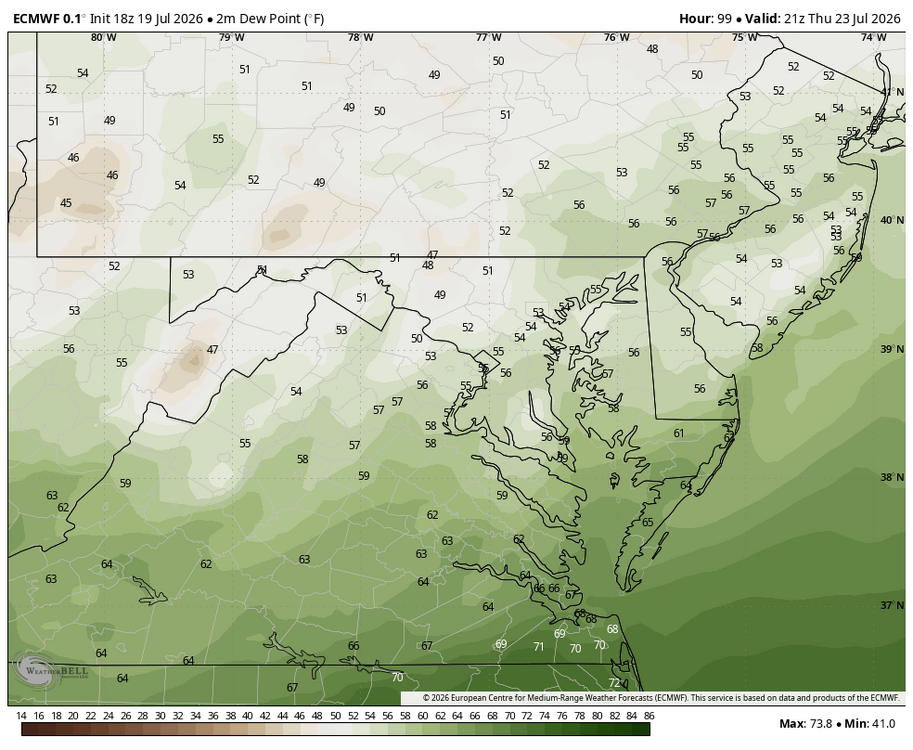
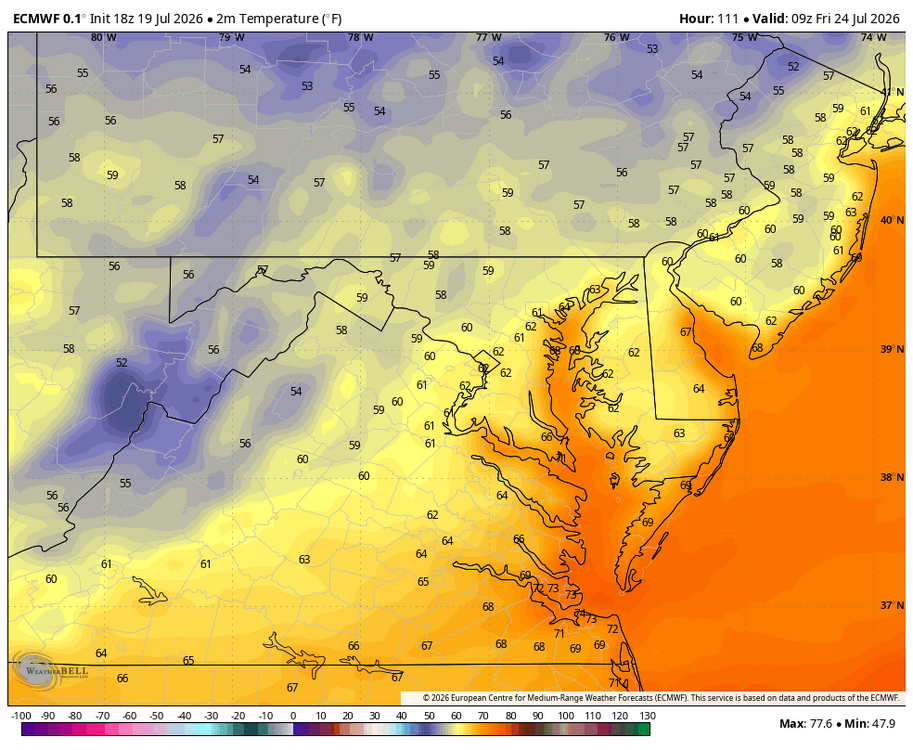
Looks like some spectacular, can I say late summer and early fall like weather for Th. And Friday... low dewpoints; and comfortable temps! Lows in the upper 50s in NW areas Friday am! WB 18Z EURO.
- Yesterday
-
Considering those 100 degree days, it is a little surprising the month may end up near normal.
-

Pittsburgh PA Summer 2026 Thread
Mailman replied to TheClimateChanger's topic in Upstate New York/Pennsylvania
Severe threat going to materialize on Tuesday? -
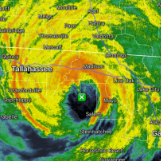 63.4°/51.5° here at WXW2 Hoping I can get some clear skies tonight for some nighttime photography.
 -
So, you’re hiding in the climate controlled house. Got ya.
-
 Shorts are on from late Morch (ish) - Tgiving (ish)
 -
Mark McGuire, Sammy Sosa, and Barry Bonds were crushing homeruns when the league average was .270
-
A focus on the "three true outcomes" - walk, strikeout or home run. It's led to guys swinging for the fences or getting on base with walks or striking out a ton.
-
You bundled up like Wiz on days like this?
-

2026-2027 Super El Nino
Stormchaserchuck1 replied to Stormchaserchuck1's topic in Weather Forecasting and Discussion
2.0 ONI in mid-July is pretty impressive. JJA ONI has never been higher than +1.6c [1997, 2015] since 1950. -

2026-2027 Super El Nino
GaWx replied to Stormchaserchuck1's topic in Weather Forecasting and Discussion
Don’t forget that CDAS is slightly cold biased. But this chart isn’t relative. Relative OISST is in the +1.6-+1.7 range. I’m guessing that tomorrow’s weekly relative Nino 3.4 release will have it at +1.5 with +1.6 on the high end. -

Central PA Summer 2026 Discussion/Obs Thread
Jns2183 replied to Voyager's topic in Upstate New York/Pennsylvania
you're going to find with you heptic sensors that it has about five different rainfall capacities and the air percentage is sort of different for all of them it also matters how exposed to wind it is and eventually also the temperature aspect. the 17% is pretty much my air percentage over the last 90 days. I've been comparing the three gauges since April. if you really want to get into it the manual one has issues with undercatch and the tipping bucket when it rains hard as issues this rain will miss it when the buckets tipped this technically if you want to get exact there are percentages that they usually add depending upon the rain gauge. to find out those percentages and try to find rain gauges all different types of what the air rates were I could do not they probably spent worldwide millions upon millions of dollars and I have least have seen probably 84 scientific studies just based upon or engage measurements and it's to this day a very active field and a nightmare for everybody Sent from my SM-S731U using Tapatalk -

2026-2027 Super El Nino
MJO812 replied to Stormchaserchuck1's topic in Weather Forecasting and Discussion
I think this happened a few years ago. We had a block but the air was stale. Just give me coastal storms and I will roll the dice. I foresee alot of snow to rain events for my area. -
.02" yesterday, which guarantees yet another below 2" precip month. Unreal. It never ends.
-
Central PA Summer 2026 Discussion/Obs Thread
Jns2183 replied to Voyager's topic in Upstate New York/Pennsylvania
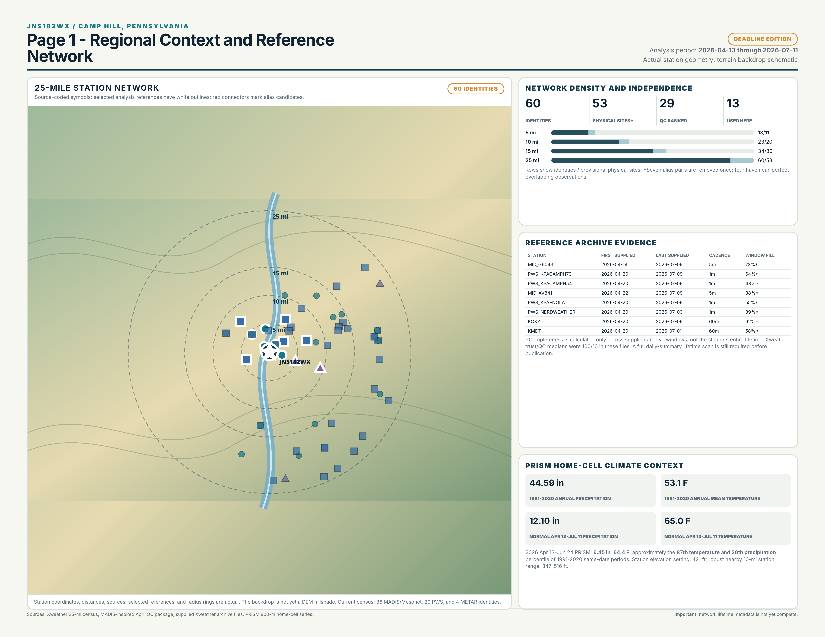
Voyager, I don't know what networks your station is connected to but if you DM me your station info and at least 90 days of preferably sub hourly (most stations are network updated at 5, 15 or 30 minutes intervals) I can do a simple QC check based on actual published methods. For a basic 90-day quality check, I compare each weather station with about 6 to 10 nearby personal weather stations, ideally within roughly 5 miles, plus a reliable airport or professional station if one is close enough. For every hour, I calculate the median of the surrounding stations and compare the station being tested against that local reference. The median is useful because one bad or poorly placed station cannot easily distort the result. I then look at the average bias, which shows whether the station usually reads too high or too low, the mean absolute error, which shows the typical size of the difference, and the correlation, which shows whether it follows weather changes correctly. I also check for missing data, stuck readings, sudden jumps, unusual day-versus-night behavior, and repeated differences during rain, strong sun, or calm nights. The result gives me a practical estimate of whether the station is trustworthy, slightly biased but correctable, or unreliable for a particular measurement. that goes for anyone else as well. I have API setup with xweather, keystone Mesonet, NWS MADIS feed. I ran right to the pipeline knife and messing around with them this is what comes out at the end see attached Sent from my SM-S731U using Tapatalk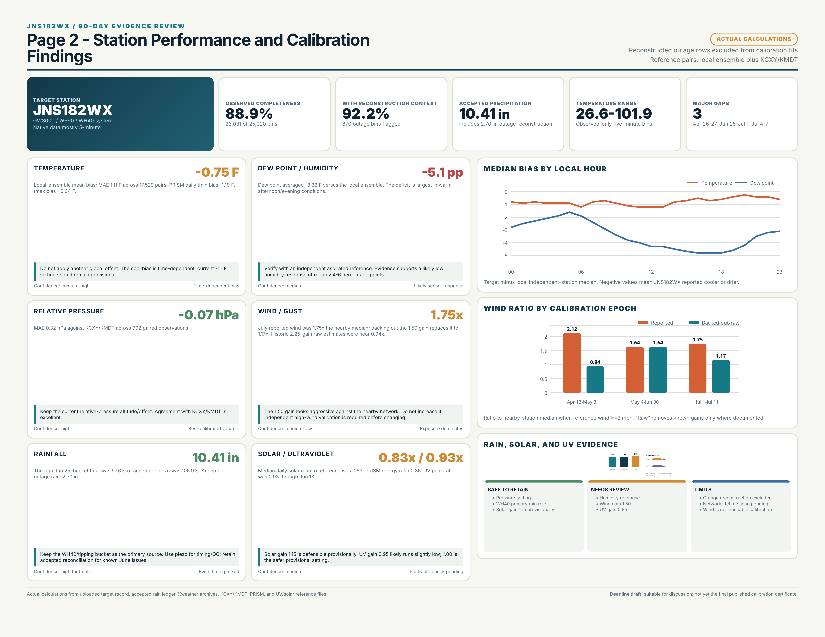
-
2026-2027 Super El Nino
MJO812 replied to Stormchaserchuck1's topic in Weather Forecasting and Discussion
How was your winter forecast for last winter ? No one should put out a winter forecast this early no matter if it shows warmth or cold. -
2026-2027 Super El Nino
GaWx replied to Stormchaserchuck1's topic in Weather Forecasting and Discussion
That July 16th Tahiti 1018.25 mb is its 2nd highest on record back to 1991. The highest is only barely higher, 1018.35 (mid-2004). -
Why did the baseball league batting average drop from .270, 20-30 years ago, to about .245 now?
-
 74° / 51°with Crystal Blue skies. Doesn't get much better. Feels like I'm still out West.
 -
Some key injuries aren't helping an already precarious situation. Both catchers are having health issues and ofc Blaze is out for an extended period. The pitching has been solid lately so lets see if that continues. Fun to watch Mayo bash long homeruns whenever a pitcher makes a mistake, but otherwise he is an easy out lol. He will probably hit 20 HRs with a batting avg of .195 because there are so many shitty pitchers.
-
2026-2027 Super El Nino
Stormchaserchuck1 replied to Stormchaserchuck1's topic in Weather Forecasting and Discussion
I think they are re-adjusting some of the daily SOI's. I remember it being higher in recent days. This is quite a streak: 19 Jul 2026 1013.04 1016.50 -27.15 -27.71 -19.78 18 Jul 2026 1013.56 1016.50 -23.95 -27.02 -19.48 17 Jul 2026 1013.50 1016.95 -27.09 -26.34 -19.15 16 Jul 2026 1013.27 1018.25 -36.50 -25.58 -18.73 15 Jul 2026 1012.10 1017.65 -40.01 -24.45 -18.16 14 Jul 2026 1011.36 1016.35 -36.56 -23.53 -17.62 13 Jul 2026 1010.44 1015.10 -34.53 -23.20 -17.20 12 Jul 2026 1009.89 1015.20 -38.53 -23.21 -16.92 11 Jul 2026 1011.77 1015.80 -30.66 -23.06 -16.66 10 Jul 2026 1013.16 1015.45 -19.94 -22.84 -16.52 9 Jul 2026 1011.59 1014.45 -23.45 -22.68 -16.60 8 Jul 2026 1008.90 1015.20 -44.63 -22.32 -16.71 7 Jul 2026 1009.02 1015.35 -44.81 -21.68 -16.58 6 Jul 2026 1011.31 1015.45 -31.33 -21.34 -16.28 5 Jul 2026 1010.44 1015.25 -35.46 -21.21 -16.03 4 Jul 2026 1010.84 1015.20 -32.69 -21.02 -15.72 90-day SOI hasn't been -20 since 1998.. first biggest El Nino event of the 2000s.