TugHillMatt Posted November 19, 2021 Share Posted November 19, 2021 12 minutes ago, tombo82685 said: not sure if this was posted, but this is probably the best annual snow map I have seen so far Actually, that map is a pretty poor map. Way too low on snow for the Northern Tug and Syracuse area. Too high for the Finger Lakes area around Dansville. I made the mistake of trusting that map when I lived in SOUTH Redfield for a winter. The snow maxima over the Tug is actually farther north and west than what you see here. The area where Jefferson, Oswego, and Lewis counties meet is the snowiest area. 4 Link to comment Share on other sites More sharing options...
TugHillMatt Posted November 19, 2021 Share Posted November 19, 2021 53 minutes ago, tombo82685 said: not sure if this was posted, but this is probably the best annual snow map I have seen so far 41 minutes ago, TugHillMatt said: Actually, that map is a pretty poor map. Way too low on snow for the Northern Tug and Syracuse area. Too high for the Finger Lakes area around Dansville. I made the mistake of trusting that map when I lived in SOUTH Redfield for a winter. The snow maxima over the Tug is actually farther north and west than what you see here. The area where Jefferson, Oswego, and Lewis counties meet is the snowiest area. While still having its big flaws, I would say this map is "best" at showing areas that get the heaviest and least lake effect snowfalls in general. It shows the general primary belts based on wind direction, and the secondary belts that still get decent snowfall on a WNW flow, etc. I would still move the Tug maxima a bit farther north, and move the "120 inch line" farther south into much of Onondaga county...based on averages and the facts that the hills to the south of Syracuse and up to Cazenovia average about that much from orographic lift and heavier synoptic snowfall. It's also too low in the northern half of Erie County...and for the Chautauqua Ridge. Many areas along the ridge average close to 200 inches. Also, the southern burbs of Buffalo definitely average more than 100 inches of snowfall. But, like I said, all the maps miss out on some key microclimates. Link to comment Share on other sites More sharing options...
TugHillMatt Posted November 19, 2021 Share Posted November 19, 2021 BGM updated their HWO for 1 to 3 inches for the Syracuse region (higher elev. getting the most). Hopefully the band gets here sooner in the morning when the sun plays less of a factor. Onondaga-Madison-Southern Oneida- 1054 PM EST Thu Nov 18 2021 This Hazardous Weather Outlook is for central New York. .DAY ONE...Tonight and Friday. A lake effect snow band will drop south through the area mid morning Friday into the early afternoon hours. This lake effect band could produce a quick 1 to 3 inches of snow, especially for the Mohawk Valley region and other surrounding higher elevations. Be prepared for the early season winter weather, especially if you are planning to be on the roads during this timeframe. 2 Link to comment Share on other sites More sharing options...
Thinksnow18 Posted November 19, 2021 Share Posted November 19, 2021 Tug!!! It appears on radar you might be getting done snow? Link to comment Share on other sites More sharing options...
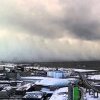
Buckeyes_Suck Posted November 19, 2021 Share Posted November 19, 2021 10 hours ago, BuffaloWeather said: Wish we were able to see this Caught the tail end of this taking the dogs out at 5am. Pretty cool 1 Link to comment Share on other sites More sharing options...
TugHillMatt Posted November 19, 2021 Share Posted November 19, 2021 1 hour ago, Thinksnow18 said: Tug!!! It appears on radar you might be getting done snow? Meh. Some big flakes and a light dusting on cars and rooftops. Per usual, too mild and the band keeps bending around my area... seriously, I am a snow jinx. Link to comment Share on other sites More sharing options...
tombo82685 Posted November 19, 2021 Share Posted November 19, 2021 Lowville cameras look like some accumulation over night Link to comment Share on other sites More sharing options...
CNY_WX Posted November 19, 2021 Share Posted November 19, 2021 Just over a half inch here overnight. Link to comment Share on other sites More sharing options...
BuffaloWeather Posted November 19, 2021 Author Share Posted November 19, 2021 https://kamala.cod.edu/ny/latest.nous41.KBUF.html ...SNOWFALL REPORTS... Location Amount Time/Date Provider ...New York... ...Allegany County... West Almond 3.6 SW 1.6 in 0700 AM 11/19 COCORAHS Wellsville 2.4 ENE 0.8 in 0700 AM 11/19 COCORAHS Wellsville T in 0500 AM 11/19 COOP ...Cattaraugus County... Franklinville 3.5 E 2.0 in 0700 AM 11/19 COCORAHS Little Valley 2.0 in 0700 AM 11/19 COOP Ischua 0.4 SSE 1.6 in 0700 AM 11/19 COCORAHS Franklinville 0.5 NNE 1.0 in 0701 AM 11/19 COCORAHS ...Chautauqua County... Jamestown 4.3 in 0600 AM 11/19 Trained Spotter Jamestown 4ENE 3.6 in 0700 AM 11/19 COOP Falconer 0.3 WSW 3.5 in 0700 AM 11/19 COCORAHS ...Erie County... Springville 0.4 NE 0.5 in 1200 AM 11/19 COCORAHS Boston 2.5 NE 0.4 in 0700 AM 11/19 COCORAHS 3 ENE Holland 0.4 in 0700 AM 11/19 Trained Spotter Glenwood 1.0 SE 0.3 in 0700 AM 11/19 COCORAHS East Aurora 0.1 ENE T in 0700 AM 11/19 COCORAHS ...Jefferson County... 4 SW Barnes Corners 1.8 in 0600 AM 11/19 Trained Spotter ...Lewis County... Constableville 1.2 NW 2.0 in 0600 AM 11/19 COCORAHS Highmarket 2W 2.0 in 0600 AM 11/19 COOP Chases Lake 0.3 in 0600 AM 11/19 COOP Glenfield 0.9 SSW T in 0600 AM 11/19 COCORAHS Lowville T in 0700 AM 11/19 COOP ...Oswego County... Mexico 2SW 0.5 in 0700 AM 11/19 COOP ...Wyoming County... Warsaw 4W 2.0 in 0700 AM 11/19 COOP Portageville 1W 0.7 in 0700 AM 11/19 COOP Link to comment Share on other sites More sharing options...
rochesterdave Posted November 19, 2021 Share Posted November 19, 2021 Great 3 Link to comment Share on other sites More sharing options...
TugHillMatt Posted November 19, 2021 Share Posted November 19, 2021 Band is finally nudging south. Hopefully it doesn't fly through at 90 mph. Link to comment Share on other sites More sharing options...
BuffaloWeather Posted November 19, 2021 Author Share Posted November 19, 2021 1 hour ago, Luke_Mages said: Caught the tail end of this taking the dogs out at 5am. Pretty cool Too many clouds here Link to comment Share on other sites More sharing options...
BuffaloWeather Posted November 19, 2021 Author Share Posted November 19, 2021 The GEM had a run 2 1 Link to comment Share on other sites More sharing options...
tombo82685 Posted November 19, 2021 Share Posted November 19, 2021 That lowville total is BS Link to comment Share on other sites More sharing options...
wolfie09 Posted November 19, 2021 Share Posted November 19, 2021 Band looked like crap all night..We made it down to freezing which was a couple degrees below forecasted.. Picked up a T..Winds have been fierce, wonder if that disrupted the band.. Link to comment Share on other sites More sharing options...
Buckeyes_Suck Posted November 19, 2021 Share Posted November 19, 2021 1 minute ago, tombo82685 said: That lowville total is BS Thats why its LOWville 1 Link to comment Share on other sites More sharing options...
BuffaloWeather Posted November 19, 2021 Author Share Posted November 19, 2021 1 Link to comment Share on other sites More sharing options...
tombo82685 Posted November 19, 2021 Share Posted November 19, 2021 11 minutes ago, Luke_Mages said: Thats why its LOWville Lol. I was looking at the web cameras on state street in lowville around 7am and you could see accumulation in the grass and on car tops. Link to comment Share on other sites More sharing options...
WNash Posted November 19, 2021 Share Posted November 19, 2021 10 hours ago, TugHillMatt said: It's also too low in the northern half of Erie County...and for the Chautauqua Ridge. Many areas along the ridge average close to 200 inches. Also, the southern burbs of Buffalo definitely average more than 100 inches of snowfall. But, like I said, all the maps miss out on some key microclimates. I think it does a decent job of capturing the gradient between Ken-Ton and the 215-220 heading that seems to be the northern limit of steady lake effect bands in recent years. In fact, they could draw that line even further south - I don't have any issues with estimating roughly 75" as the average annual snowfall for the northern 1/3rd of Buffalo. You don't have to drive very far to the east to get to the airport, where LES sets up much more regularly on a heading that also crosses South Buffalo. On the other hand, that map paints 80"-100" incorrectly over a broad area of the metro, including West Seneca, the southern half of Lancaster, most of Hamburg, and a good chunk of Orchard Park, and that's way off. If anything, the 120" line needs to be up around where the 100" line was drawn in the eastern part of the Buffalo metro. Frankly, it wouldn't surprise me if my mother-in-law in Gardenville got close to 2x the snowfall totals that I used to get in Parkside or that I get now in Kensington. 1 Link to comment Share on other sites More sharing options...
BuffaloWeather Posted November 19, 2021 Author Share Posted November 19, 2021 5 minutes ago, WNash said: I think it does a decent job of capturing the gradient between Ken-Ton and the 215-220 heading that seems to be the northern limit of steady lake effect bands in recent years. In fact, they could draw that line even further south - I don't have any issues with estimating roughly 75" as the average annual snowfall for the northern 1/3rd of Buffalo. You don't have to drive very far to the east to get to the airport, where LES sets up much more regularly on a heading that also crosses South Buffalo. On the other hand, that map paints 80"-100" incorrectly over a broad area of the metro, including West Seneca, the southern half of Lancaster, most of Hamburg, and a good chunk of Orchard Park, and that's way off. If anything, the 120" line needs to be up around where the 100" line was drawn in the eastern part of the Buffalo metro. Frankly, it wouldn't surprise me if my mother-in-law in Gardenville got close to 2x the snowfall totals that I used to get in Parkside or that I get now in Kensington. Agreed, the map is pretty bad. I think Carol in Redfield averages 250"+ doesn't she? Link to comment Share on other sites More sharing options...
wolfie09 Posted November 19, 2021 Share Posted November 19, 2021 Around 260" but only 4 years of Data..Her numbers wouldn't be included in any map as of now.. 2 Link to comment Share on other sites More sharing options...
BuffaloWeather Posted November 19, 2021 Author Share Posted November 19, 2021 4 minutes ago, wolfie09 said: Around 260" but only 4 years of Data..Her numbers wouldn't be included in any map as of now.. Yeah I would have liked to see what she averaged from 2000-2010 when everyone was way above normal. I thought shes been there for awhile. 1 Link to comment Share on other sites More sharing options...
tombo82685 Posted November 19, 2021 Share Posted November 19, 2021 18 minutes ago, BuffaloWeather said: Yeah I would have liked to see what she averaged from 2000-2010 when everyone was way above normal. I thought shes been there for awhile. I follow her on twitter and I know a couple of those years she had over 400 1 Link to comment Share on other sites More sharing options...
wolfie09 Posted November 19, 2021 Share Posted November 19, 2021 The highest number I can find is 388" but obviously some years are missing.. 2006-2007 ..OSWEGO COUNTY... .REDFIELD..... 388 INCHES .PALERMO...... 275 INCHES .PARISH....... 269 INCHES .BENNETTS BRG. 242 INCHES .MEXICO....... 227 INCHES .PULASKI...... 221 INCHES .MINETTO...... 221 INCHES .WEST MONROE.. 217 INCHES .FULTON....... 217 INCHES .SCRIBA....... 213 INCHES .CONSTANTIA... 207 INCHES .HANNIBAL..... 198 INCHES .OSWEGO SW.... 196 INCHES .OSWEGO....... 160 INCHES (CITY) Link to comment Share on other sites More sharing options...
wolfie09 Posted November 19, 2021 Share Posted November 19, 2021 The following year a little over 300".. .OSWEGO COUNTY... .REDFIELD.......308 INCHES .BENNETTS BRG...280 INCHES .PULASKI........248 INCHES .LACONA.........219 INCHES .PALERMO........198 INCHES .OSWEGO.........193 INCHES (CITY) .FULTON.........187 INCHES .MEXICO.........184 INCHES .MINETTO........179 INCHES .OSWEGO.........173 INCHES (SW) .SCRIBA.........172 INCHES .W. MONROE......165 INCHES .OSWEGO.........160 INCHES (EAST) .HANNIBAL.......154 INCHES .CONSTANTIA......104 INCHES 1 Link to comment Share on other sites More sharing options...
tombo82685 Posted November 19, 2021 Share Posted November 19, 2021 3 minutes ago, wolfie09 said: The following year a little over 300".. .OSWEGO COUNTY... .REDFIELD.......308 INCHES .BENNETTS BRG...280 INCHES .PULASKI........248 INCHES .LACONA.........219 INCHES .PALERMO........198 INCHES .OSWEGO.........193 INCHES (CITY) .FULTON.........187 INCHES .MEXICO.........184 INCHES .MINETTO........179 INCHES .OSWEGO.........173 INCHES (SW) .SCRIBA.........172 INCHES .W. MONROE......165 INCHES .OSWEGO.........160 INCHES (EAST) .HANNIBAL.......154 INCHES .CONSTANTIA......104 INCHES I knew i saw a 400+ reading before, it was hooker, but back in the 1970s lol. So may not help much. They had 466" in 1977 1 1 Link to comment Share on other sites More sharing options...
CNY_WX Posted November 19, 2021 Share Posted November 19, 2021 On November 3, Carol tweeted the first 3 inches of the year and said only 422 more to break the record. From that I assume her record snowfall is 424 inches. 2 1 Link to comment Share on other sites More sharing options...
TugHillMatt Posted November 19, 2021 Share Posted November 19, 2021 1 hour ago, WNash said: I think it does a decent job of capturing the gradient between Ken-Ton and the 215-220 heading that seems to be the northern limit of steady lake effect bands in recent years. In fact, they could draw that line even further south - I don't have any issues with estimating roughly 75" as the average annual snowfall for the northern 1/3rd of Buffalo. You don't have to drive very far to the east to get to the airport, where LES sets up much more regularly on a heading that also crosses South Buffalo. On the other hand, that map paints 80"-100" incorrectly over a broad area of the metro, including West Seneca, the southern half of Lancaster, most of Hamburg, and a good chunk of Orchard Park, and that's way off. If anything, the 120" line needs to be up around where the 100" line was drawn in the eastern part of the Buffalo metro. Frankly, it wouldn't surprise me if my mother-in-law in Gardenville got close to 2x the snowfall totals that I used to get in Parkside or that I get now in Kensington. Your last paragraph is what I was referring to. Link to comment Share on other sites More sharing options...
TugHillMatt Posted November 19, 2021 Share Posted November 19, 2021 1 hour ago, Luke_Mages said: Thats why its LOWville Ha! "Low" is actually pronounced with on "o" sound that rhymes with "how." 3 1 Link to comment Share on other sites More sharing options...
TugHillMatt Posted November 19, 2021 Share Posted November 19, 2021 Getting some nice snow showers here that are frosting the ground. But can't get any more of a covering than that here in the maritimes of Upstate. Link to comment Share on other sites More sharing options...

Recommended Posts
Create an account or sign in to comment
You need to be a member in order to leave a comment
Create an account
Sign up for a new account in our community. It's easy!
Register a new accountSign in
Already have an account? Sign in here.
Sign In Now