Quincy
-
Posts
6,220 -
Joined
-
Last visited
Content Type
Profiles
Blogs
Forums
American Weather
Media Demo
Store
Gallery
Everything posted by Quincy
-
Over a 50-year span from 1962 to 2011, the most violent (F/EF-4 and F/EF-5) tornadoes occurred over Oklahoma and Mississippi. The maximum grid-points reported 16 over that period, with two of those grid-points in central Oklahoma and one in central Mississippi. While a broad area from the Plains to the mid-South sees the most tornadoes overall across the United States, there are three sub-areas with the most violent tornadoes. Much of Oklahoma falls into that category, as it is widely considered to be in the heart of tornado alley. Further north into Iowa is another area that has seen the most violent tornadoes during the period. The third area falls across Mississippi, where the tornado season is relatively elongated from the heart of winter into mid-Spring. The tornado season in Oklahoma generally occurs in a narrower window in mid-Spring. The season in Iowa tends to fall from mid to late spring with a secondary peak in the fall. A smaller and less significant maximum for violent tornadoes can also be identified across the upper Ohio Valley. While the tornado season tends to peak there in mid-Spring, a few events have also occurred in the fall. An interesting tornado minimum occurs in a small portion of central Missouri. Among multiple factors is the unique geographical area Missouri falls into. The classic tornado setup in the Plains is driven largely by lee-side cyclogenesis and the dryline. As storm systems move across the Plains, the bulk of the violent tornadoes tend to occur west and northwest of Missouri. Also, the dryline tends to have trouble advancing enough east to penetrate far into Missouri. Likewise, typical tornado events in the mid-South tend to thrive off of moisture from the Gulf of Mexico, producing tornadoes east of Missouri. With that said, higher instances of violent tornadoes have been noted across northwestern Missouri (tornado alley), far southeastern portions of the state (Dixie alley) and the devestating EF-5 tornado in Joplin, in far southwestern Missouri in 2011. East of the Appalachians, violent tornadoes are fairly uncommon. However, two particular regions have reported three or more violent tornadoes from 1962 to 2011. Portions of the Carolinas fall into that category. Further north, grid-points in the mid-Hudson Valley into southwestern New England have reported four violent tornadoes in that same span.
-

Central/Western Medium-Long Range Discussion
Quincy replied to andyhb's topic in Central/Western States
Maybe we'll get some early to mid-April action down in Dixie Alley, where they're climo-favored anyway. That area was eerily quiet until April 27-28 last year. -
Here is a snowfall map using reports from various sources. Many of the reports came from this forum and the National Weather Service. Only social media reports that passed through quality control were considered. All reports gathered were carefully considered and compared before being included. Snow developed during the afternoon on March 20th across Connecticut. Dry air in place prior to the event resulted in several hours of virga until ground observations finally reported snow early in the afternoon. Snow overspread the state, but the snow was heaviest across southwestern sections. The snow continued overnight as low pressure developed east of New Jersey. Periods of light snow continued into the morning hours on March 21st. There was some enhancement of the snow across central Connecticut before the snow tapered to flurries statewide by midday. Snowfall totals ranged from 4 to 7 inches across southwestern Connecticut to just under 2 inches in northeastern Connecticut. Much of interior Connecticut reported 2 to 4 inches with a few isolated higher amounts in north-central portions of the state. A narrow band across the higher elevations of Fairfield County, just northwest of the Merritt Parkway, reported locally 7 to roughly 8 inches of snow.
-
Here is a snowfall map using reports from various sources. Many of the reports came from this forum and the National Weather Service. Only social media reports that passed through quality control were considered. All reports gathered were carefully considered and compared before being included. Periods of light snow developed across Connecticut between late morning and early afternoon on March 1st. The snow became moderate to briefly heavy at times during the evening hours. Snow tapered off across northwestern Connecticut by midnight, but lingered in eastern areas until the pre-dawn hours on March 2nd. The heaviest snow affected the I-95 corridor and a bit further north into eastern Connecticut. This event resulted in a general 3 to 6 inch snowfall around the state. The lowest amounts were reported in far northwestern Connecticut with near or just under 3 inches. A few spots in the southeastern half of Connecticut saw 6 to 7 inches of snow.
-
Here is a snowfall map using reports from various sources. Many of the reports came from this forum and the National Weather Service. Only social media reports that passed through quality control were considered. All reports gathered were carefully considered and compared before being included. Areas of weak low pressure moved through the Ohio Valley along a frontal boundary on February 21st and periods of light snow moved into Connecticut during the afternoon. The snow gradually became moderate to briefly heavy at times during the evening. Due to the frontal boundary being west of the state, winds were generally out of the south to southwest ahead of low pressure, through the event. This led to temperatures rising into the lower 30s overnight. Snow changed to sleet, roughly as far northwest as I-84. A narrow corridor of freezing rain was reported just to the northwest of I-95. Some areas changed to plain rain south and east of I-95 along the coast and east of I-395 in far eastern Connecticut. Precipitation changed back to snow in all areas before ending on the morning of the 22nd. Most of the state reported a 4 to 8 inch snowfall. A few totals just over 8 inches were reported in Litchfield and Tolland counties. Snowfall totals along and southeast of the I-395 to I-95 corridor were generally in the range of 2 to 4 inches. The immediate shoreline in southeastern Connecticut reported around or just under 2 inches.
-
Here is a snowfall map using reports from various sources. Many of the reports came from this forum and the National Weather Service. Only social media reports that passed through quality control were considered. All reports gathered were carefully considered and compared before being included. As low pressure moved east from the Great Lakes, some modest warm advection light snow developed around Connecticut during the morning and afternoon on February 14th. The snow was intermittent and amounts were generally less than two inches during the daylight hours. The storm system rapidly intensified east of New England overnight and some bands of moderate to heavy snow rotated through eastern Connecticut. The snow tapered off on Sunday, during the morning in most areas, but not until early afternoon near the Rhode Island border. Snowfall totals ranged from less than two inches across far western and southwestern Connecticut, to four to eight inches across most eastern portions of the state. A few totals up to nine inches were reported, across the hills of Tolland County and across southeastern Windham County.
-
Here is a snowfall map using reports from various sources. Many of the reports came from this forum and the National Weather Service. Only social media reports that passed through quality control were considered. All reports gathered were carefully considered and compared before being included. This event was spread out over three days as low pressure passed along a frontal boundary, draped from the Ohio Valley into southern New England. On the first day, Saturday, February 7th, occasional flurries and a few bands of light snow passed through Connecticut. Snowfall totals on this day were generally an inch or less around the state. On Sunday, February 8th, scattered snow showers and flurries continued. During the evening hours, a band of heavier snow developed from roughly Danbury to Meriden. Outside of that band, daily snowfall totals were mainly less than two inches. Snow across Connecticut, especially northern portions of the state, became steadier after midnight. Snow, heavy at times, continued through much of the day on Monday, February 9th. The heaviest snowfall affected the northern portion of the state. Snow finally tapered off during the evening hours in Windham County. The majority of the total snowfall from this event occurred on Monday. Through the event, there was some mixing with sleet, graupel and freezing drizzle across the southern half of Connecticut. Mixed precipitation was the dominant precipitation type in lower Fairfield County and much of New London County. Some shadowing of snowfall totals can be noted west of the hills in northwestern Connecticut and across the Connecticut River Valley. There, snowfall totals were generally 4 to 8 inches. Some localized 8"+ snowfall amounts were reported in west-central Connecticut and across some of the higher elevations in Tolland and Windham counties.
-
Here is a snowfall map using reports from various sources. Many of the reports came from this forum and the National Weather Service. Only social media reports that passed through quality control were considered. All reports gathered were carefully considered and compared before being included. Occasional flurries developed on Sunday, February 1st across Connecticut. A steadier snow moved in after midnight with some moderate to heavy snow during the morning hours on February 1st. By 7 to 8 a.m., precipitation changed to sleet across lower Fairfield County. Snow mixed with and changed to sleet in most areas up to roughly I-84 from mid to late morning. There was some spotty freezing rain as well, mainly for a short time near the I-95 corridor. As colder air worked in behind a low pressure system passing by east of Long Island, precipitation quickly changed back to all snow across the state. An intense band of heavy snow formed across western Connecticut and moved from west to east across the state. This band of snow was producing 2″+ per hour snowfall rates. Snow quickly tapered off by mid-afternoon in western Connecticut and by early evening near the Rhode Island border. The majority of the state saw anywhere from 8 to 12 inches of snowfall. Locally higher amounts were reported in the northwestern and northeastern hills. Southeastern Connecticut, where there was the longest period of sleet and freezing rain, had anywhere from about 5 to 8 inches of snowfall.
-
There have been no major changes to the previous forecast. Some of the snowfall totals have been trimmed back ever so slightly. A fairly widespread area of 5 to 10 inches of snow is expected, with a jackpot across much of interior Massachusetts, where most or all of the precipitation should fall as snow. Snow becomes heavy at times early Monday morning and begins to mix with sleet and freezing rain by the morning rush around New York City. The mixing then spreads into southern New England by mid morning. After a few hours of sleet and freezing rain across the coastal plain of Connecticut, precipitation should quickly begin to lighten up by late morning to midday. Across northeastern Massachusetts, snow will continue through early afternoon before tapering off by early evening and as a result, around a foot of snow is forecast here. The greatest threat for icing extends from northern New Jersey into the lower Hudson Valley and portions of southern and central Connecticut.
-
Here is a snowfall map using reports from various sources. Many of the reports came from this forum and the National Weather Service. Only social media reports that passed through quality control were considered. All reports gathered were carefully considered and compared before being included. Periods of light snow and flurries began on the morning of Monday, January 26th and continued through the afternoon. It wasn't until after dark that the snow became heavy at times, particularly across the eastern half of the state. Although western sections hung on to a steady snow, it was generally light to moderate. A band of intense snowfall set up near I-395 in eastern Connecticut during the early morning to predawn hours on the 27th. The band of snow dropped 2 to 4 and occasionally 5 inches per hour for a few hours. During the day on the 27th, periods of light to occasionally moderate snow continued across eastern Connecticut, while only a few stray flurries affected western portions of the state. A couple of bands of briefly heavy snow hit northeastern Connecticut on the night of the 27th. The last flurries ended early on the morning of the 28th across Windham County. This is where the highest amounts were found. I-91 was an approximate divide between less than a foot to the west and over a foot to the east. Over two feet of snow was common from northern New London County into much of Windham County. For some of these communities, this was the most significant snowfall since the Blizzard of 1978.
-
Here is a final snowfall forecast for the upper mid-Atlantic region and southern New England for the Blizzard of 2015. No major changes were made to the forecast, but the western fringe was trimmed somewhat. It's becoming a nowcast situation, as the computer models are relatively all over the place. The 12z Euro is one extreme (heavy west), with the 00z RGEM further east and much less impressive. Based on radar trends, the previous forecast map and a consideration to the model consensus, here is the latest thinking: The shield of heavy snow is backing west through Long Island and southern New England as of 11:35 p.m. Monday. The back edge should make it to roughly the New York border before it essentially stalls. Interior southern New England should remain within the steadiest snow for the longest period of time. There are still unclear details about a mesoscale band of enhanced snowfall totals, but a general 20 to 26 inch snowfall is expected from the hills of eastern Connecticut into much of interior eastern Massachusetts. Banding may result in some 30"+ snowfall amounts, somewhere between northeastern Connecticut and the Worcester-Boston area.
-
A major snow storm is projected to bring blizzard conditions to much of New England Monday night through Tuesday. When all is said and done, many areas in and around the Boston area can expect two feet of snow with locally higher amounts. Despite the European model staying the course with greater snowfall amounts for areas around New York and New Jersey, it appears that most other data favors sharply decreasing snowfall amounts west of southern New England. As low pressure rapidly intensifies and moves toward Cape Cod and the islands, snow will become heavy with strong winds and blizzard conditions along the I-95 corridor from New York City to Boston and downeast Maine. As low pressure nearly stalls and does a loop, similar to historic blizzards in the past, a band of intense snowfall should drop excessive to possibly historic snowfall amounts. It appears that the likely positioning of this band would be on a SSW to NNE axis between central/eastern Connecticut and interior eastern Massachusetts. This may include the Boston metropolitan area. Although mesoscale details of such a band are not 100% clear, the potential exists for some 30"+ totals where this band sets up. Snow in this area will persist through the second half of Tuesday, before finally winding down early Wednesday morning. Here is the thinking for this storm. The greatest bust potential lies across far western New England, New York State, New Jersey and points west. Although this forecast leans closer to the more eastern GFS/NAM/RGEM solutions, it will still be interesting to see how the 00z Euro trends. It is very rare for the Euro to cave to the other models inside of 72 hours, but it is also hard to believe that it will stay as far west with the heavy snow as previous runs have. Another consideration is that liquid to snow ratios, especially across the interior high terrain, will be greater than 10:1. Ratios in the range of 14-18:1 across western and central Massachusetts should help offset some lower precipitation amounts with a considerable fluff factor. 8:30 a.m. Monday edit: The models have compromised a bit overnight, but the RGEM is still rather light with snowfall amounts across western New England and points west.
-
Here is a snowfall map that I created using reports from various sources. Many of the reports came from this forum and the National Weather Service. Only social media reports that passed through quality control were considered. All reports gathered were carefully considered and compared before being included. Light rain developed during the morning hours on November 26th and mixed with some sleet inland. Wet snow initially confined to the far northwestern corner of the state. As steadier precipitation moved in, a slight southeast shift of the snow/sleet line was observed with some modest evaporational cooling. However, much of coastal and southeastern Connecticut stayed predominantly rain. The main reason for the mixed precipitation and sleet was a warm layer in the atmosphere around 700mb. As precipitation became heavy, sleet fell across much of central Connecticut. Wet snow continued across northwestern Connecticut and rain moved as far northwest as Meriden and Hartford with some warming aloft nudging into the valleys. Even in those areas, the 2-meter temperature hovered around 34 degrees for much of the event, which did not allow for significant amounts of snow to accumulate. Precipitation tapered off to scattered snow showers by early evening. As cooler air gradually funneled in, a light additional accumulation of snow was reported in many areas. A few broken, but locally enhanced bands of snow continued into the early morning hours on the 27th. The greatest snowfall totals were in the range of 6 to 10 inches across northwestern Connecticut. Totals dropped off fairly quickly to the south and east. A narrow area of 3 to 6 inches was observed near and just northwest of I-84. Just southeast of there, 1 to 3 inches was reported and the southeastern third of the state generally saw less than one inch of snow. Where the snow did accumulate, it had a very high water content, especially those areas that battled between a mixture of snow, sleet and rain.
-
An early season storm is expected to bring a heavy, wet snow to the interior hills of the upper mid-Atlantic region and New England on Wednesday into very early Thanksgiving morning. While the big cities from Philadelphia to New York and Boston can expect some snow, the greatest amounts will be to their north and west. Low pressure will develop along the Carolina coast this morning and ride up the East Coast. With the low passing close to, if not over Cape Cod, no strong high pressure center in place to the north and the fact that we're still in November, a warm surge of air should penetrate up to and even a bit northwest of I-95. While temperatures from 850mb down to the surface may hover near freezing, a warm layer up around 800-700mb will likely cause melting aloft, meaning there will be sleet and rain. The result is anticipated to be heavy wet snow well inland, but quite a bit of sleet across areas such as New Haven, Willimantic and the western Boston suburbs, with a change to rain in areas including Providence and Taunton. New York City and Philadelphia look to be in a bit of a different scenario, where rain will try to change to wet snow during the day on Wednesday. The time of day will not be favorable, along with the somewhat inland 700mb low track. The heaviest snow should fall from late morning through the afternoon across northern New Jersey and the mid-Hudson Valley. The hills of interior Massachusetts and central New England should see widespread snowfall amounts over 10" with the heaviest falling from the afternoon into the evening hours. 10 to 12" will be common with a few locally higher amounts possible. Due to the localized nature of 12"+ totals, they have been omitted from this map. Snow will taper off to snow showers early Thanksgiving morning and a few flurries could linger into the day in some locations. Snowfall forecast totals for the big cities: Boston: 2 to 4 inches Worcester: 8 to 12 inches Providence: 2 to 3 inches Hartford: 6 to 9 inches New York City: 1 to 3 inches Philadelphia: 1 to 3 inches
-
Here is a snowfall map that I created using reports from various sources. Many of the reports came from this forum and the National Weather Service. Only social media reports that passed through quality control were considered. All reports gathered were carefully considered and compared before being included. Light rain, with light snow across the higher elevations, developed across Connecticut during the evening hours of November 13th. The steadiest and heaviest snow fell around midnight and tapered off during the pre-dawn hours on November 14th. Most locations eventually changed to snow, with the exception being the immediate shoreline and urban coastal corridor from New Haven down toward the New York border. On average, the hills saw anywhere from 1 to 3 inches of snow, with generally an inch or less across the valleys and shoreline. The highest amounts around and just over 3 inches were reported in Litchfield County.
-
The United States has a greater frequency of tornadoes than most other counties. For many factors, the vast majority of tornadoes occur east of the Rocky Mountains across the continental U.S. Although the central and southern Plains region is widely considered to be "Tornado Alley," there are other areas that see just as many tornadoes, if not even more. The two graphics below are adaptations of NOAA/NWS SPC graphics found in their Tornado Environmental Browser. A broad area from the east slopes of the Rockies east to the west slopes of the Appalachians typically see the most days with tornadoes per year. Two local maximums can be identified in northeastern Colorado and central Florida. While these areas may see numerous tornadoes in any given year, they are generally low on the EF-scale. The central Appalachians feature a local minimum of tornadoes, but as one travels east, the frequency of tornadoes increases. While terrain by itself will generally not have much of an effect on a tornado, especially a significant (EF/F-2 or stronger) one, there are reasons why terrain affects tornado frequency. In the Plains, lee cyclogenesis combined with a surge of warm, moist air from the Gulf of Mexico and drier air from the Rockies tends to create a favorable setup for severe thunderstorms and tornado development. Across the East Coast, there is less real estate to work with when considering the proximity to the Atlantic Ocean. Also, wind out of the south to southeast in the lower levels will often mitigate the risk of severe thunderstorms, especially in the spring and early summer months from the mid-Atlantic region into the Northeast. The placement of a "Bermuda" high and/or a "southeast ridge" of high pressure will tend to limit the formation of strong non-tropical low pressure systems along the East Coast during the warmer months, as the jet stream is often displaced further northwest. The frequency of days with significant tornadoes is in some ways similar to, but also has differences in comparison with the frequency of days with all tornadoes. While portions of Colorado and Florida may see the most tornadoes overall, there are two distinct areas that feature a much greater frequency of significant tornadoes. The southern Plains into Dixie Alley (lower to mid-Mississippi Valley) will on average experience the most significant tornado outbreaks. Here, there are three factors that are probably most responsible for this. First, their proximity to warm, moist air from the Gulf of Mexico fill favor higher dew-points and greater instability. Second, the tornado season is a bit elongated here. While April into May have featured the most significant tornadoes in Dixie Alley, the late fall into winter months have also included several major tornado outbreaks. Finally, there may be at least some influence from tropical systems. While tropical storms and hurricanes often do produce tornadoes, it should be noted that most of these tornadoes are generally not significant. Eastern Nebraska into the Midwest also averages an elevated number of days per year with significant tornadoes. Here, while the tornado season typically peaks in June, at least some fall tornado events have spawned significant tornadoes this far north. In 2013, October 3rd-4th recorded six significant tornadoes from eastern Nebraska into Iowa, with the major tornado outbreak of November 17th featuring 32 significant tornadoes in the Midwest. Other noteworthy observations: Missouri is an interesting case. The western portion of the state is often considered to be in tornado alley and some maps will place southeastern Missouri in Dixie Alley. The state has seen plenty of significant and even violent tornadoes, with the Joplin tornado of 2011 being one of the more recent examples. However, a small section of central Missouri features a local minimum in terms of both tornadoes and significant tornadoes. One possible explanation can be their location being in a "dryslot" of sorts for tornadoes. For storm systems developing just east of the Rockies, the eastward extent of associated severe weather will often fall short of central Missouri. Likewise, systems developing in the lower Mississippi Valley often form a bit too far east to target central Missouri with the most tornadoes. West Virginia has less tornadoes than most states east of the Rockies. One factor that immediately comes to mind would be the population density and terrain, which may limit some tornado reports. However, their location along the Appalachians certainly plays a role in the lower frequency of tornadoes. The higher elevations will typically have less instability. Likewise, moisture pooling will typically favor higher dew-points west and east of the Appalachians, leaving West Virginia in another tornado dryslot. According to the NWS, West Virginia has no recorded EF/F-4 or 5 tornadoes. With that said, a long-track F-5 tornado in southeastern Ohio narrowly missed passing into West Virginia before lifting. Also, an F-4 tornado that dropped southeast of Pennslvania into Maryland also lifted shortly before it would have passed into West Virginia.
-
Central/Western Medium-Long Range Discussion
Quincy replied to andyhb's topic in Central/Western States
00z NAM is awfully bullish now for Tuesday as well as Wednesday. Not sure how serious to take it, especially when it's showing a warm front all the way back into Nebraska Wednesday afternoon. Unless the GFS/Euro ramp up, may have to toss the NAM yet again. -
Central/Western Medium-Long Range Discussion
Quincy replied to andyhb's topic in Central/Western States
It's looking like a relatively small area across southeastern Kansas and far northern Oklahoma will see a somewhat favorable overlap of instability, forcing and wind shear on Wednesday. With that said, as mentioned earlier, there are still some red flags that we may be looking at another underperforming setup. While the GFS and Euro both show a surface low near the OK/KS border Wednesday afternoon and some backing low-level winds near a quasi warm front, we're just looking at a 1002mb low. Nothing like the more dynamic systems we saw last fall. While there's some moisture, the model consensus is only for mid-60s dew-points. The GFS spitting out some dews around 70 in the warm sector is likely overdone. We're looking at a relatively broad trough with no well defined shortwave energy being focused on one area. While the upper level flow is decent and the risk area is placed on the right-front jet quad, the low and mid-level winds aren't terribly impressive either, A few pieces there and and a few others likely lacking. Should still be interesting, but again, over a small area and the severity of any storms may be limited by several factors. Thursday looks to have more instability, but the shear pattern becomes more perpendicular to the front. Then, the trend continues to be toward a cold front or elongated low working as the main forcing mechanism. -
Central/Western Medium-Long Range Discussion
Quincy replied to andyhb's topic in Central/Western States
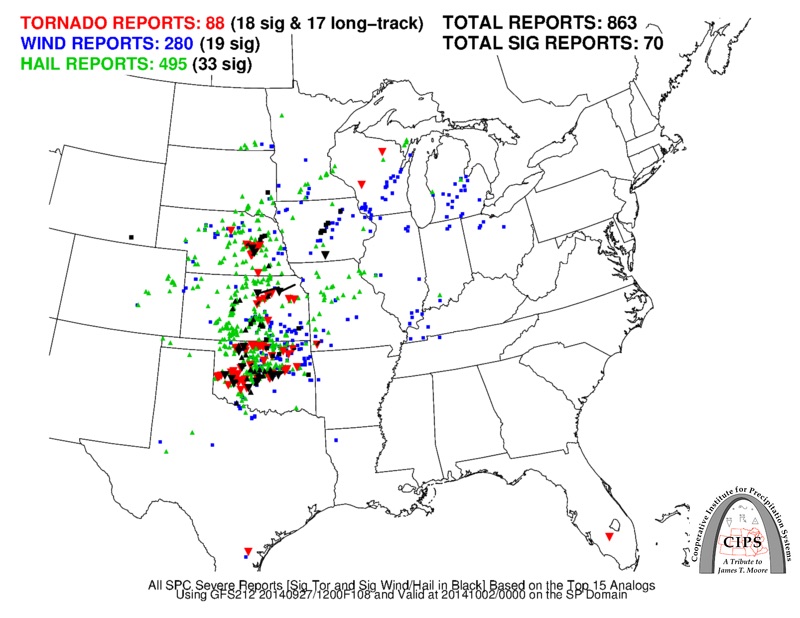
I'm not 100% sold yet, but here's a look at the 12z GFS-based analogs for Wednesday: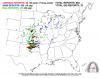
-
Central/Western Medium-Long Range Discussion
Quincy replied to andyhb's topic in Central/Western States
Still need some pieces to come together better than advertised on the Euro/GFS, but can't help but think that Wednesday into Thursday of next week has some potential from Oklahoma/Kansas into the mid-Mississippi valley. With a fairly deep trough digging, it's going to come down to timing of shortwave energy, surface low development/placement and richness of low-level moisture. Right now, the GFS shows a marginal setup with a strung out low, while the Euro is a bit more robust and shows a nice low-level jet ramping up. Let's see how the forecast evolves this weekend. -
Central/Western Medium-Long Range Discussion
Quincy replied to andyhb's topic in Central/Western States
Both the NAM and GFS look highly impressive for northern Iowa into southern Minnesota. Some may discount the NAM based off how it has handled some severe events this season, but even the GFS is spitting out some pretty significant values. Just pull a sounding for north-central Iowa and the GFS is showing over 200 m2s-2 0-1km helicity with 40+ knots of shear and a 40+ knot LLJ. Even seeing some STP values over 6 there on the GFS. (NAM is maxed out over southern Minnesota with double digit STPs) Caveats: Capping and lack of a trigger. The GFS/NAM combo does show a subtle piece of energy swinging through southern Minnesota, but one has to imagine that the threat near and south of the IA/MA border may be minimal to cap-busted. -
Central/Western Medium-Long Range Discussion
Quincy replied to andyhb's topic in Central/Western States
As mentioned, the timing for Wednesday/Thursday may be a bit off, but the parameters look awfully impressive for Wednesday. If the shortwave can speed up or we can otherwise get some more forcing in, that could kick off a few monsters. Thursday is probably out of reach, unless the whole thing slowed down. As advertised, Thursday would be a relatively narrow corridor of strong instability, but the kinematic support is lacking, along with an increasingly unidirectional shear pattern. It's into weenie-range, but the GFS/Euro also show a potent shortwave across the Dakotas/upper Midwest by next Monday/Tuesday. -
Central/Western Medium-Long Range Discussion
Quincy replied to andyhb's topic in Central/Western States
Based on fairly good model agreement at this point, it's looking quite interesting late next week/next weekend as well. A vigorous trough across the NW... The setup is somewhat reminiscent of June 16-18th, although the southeast ridge is a bit more prominent. It's way too early for specifics, but has my attention.
-
Central/Western Medium-Long Range Discussion
Quincy replied to andyhb's topic in Central/Western States
The Euro indicates some severe risk for Sunday into Monday across the Plains and perhaps extending into the lower Missouri/upper Mississippi Valley regions. With an upper level trough digging, an increasing low-level jet and one or more surface lows developing along a front, there could be some potential. The GFS also points at an increasing threat at this time frame. A lot can change, but it's worth keeping an eye on. -
Central/Western Medium-Long Range Discussion
Quincy replied to andyhb's topic in Central/Western States
Some similarities to June 17th especially, at least given the slow/lazy storm motion and proximity to the NE/SD border. 00z NAM and GFS are still onboard. They're actually in fairly good agreement with the severe parameters near the warm front in southeastern SD by mid to late afternoon. Strong turning in the lowest 1-1.5km, a weakening cap and plenty of instability - assuming there's at least some clearing during the day. Both the GFS and NAM are showing >200 m2/s2 0-3km and >100 m2/s2 0-1km helicity. This combined with 30-40 knots (or more) of shear and as mentioned, there could be significant severe. I'm very interested to see the HRRR come into range. The 4km NAM simulated reflectivity shows a somewhat messy storm mode firing around 7-8 p.m. Will the window be that narrow/will initiation be that late? We'll see how the high resolution models trend. Either way, it's looking very interesting from far northeastern Nebraska into southeastern South Dakota, up to about or just north of I-90. Even the forecast soundings for KFSD look impressive with enlarged hodographs. Intriguing for any time of the year, but especially for August.