TheClimateChanger
-
Posts
4,388 -
Joined
-
Last visited
Content Type
Profiles
Blogs
Forums
American Weather
Media Demo
Store
Gallery
Everything posted by TheClimateChanger
-
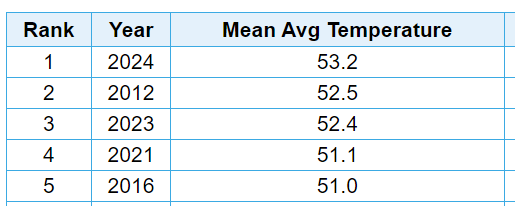
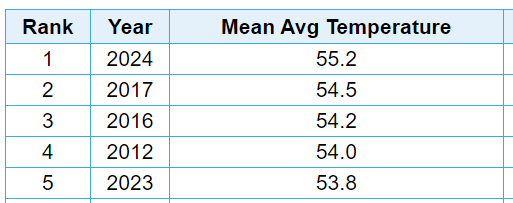
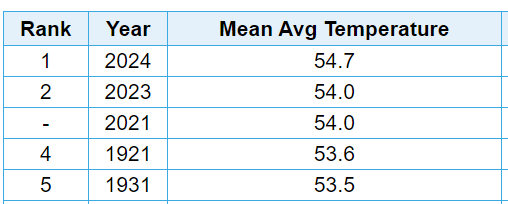
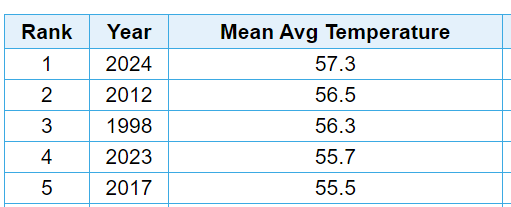
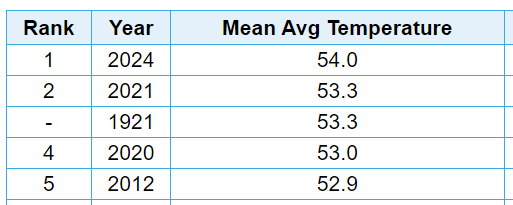
Similar story in Michigan. Grand Rapids fell a little short of 2012, but record-breaking warmth was widespread throughout the state. I think the most impressive thing about 2024 is near the uniformity of record-breaking warmth. Some of the prior records dated to recent years (2021, 2023, 2017), a number from 2012 but a few were as old as 1921 & 1931. Detroit Lansing Flint Saginaw Alpena Grand Rapids Traverse City Houghton Lake Marquette (Airport) Kalamazoo Muskegon
-
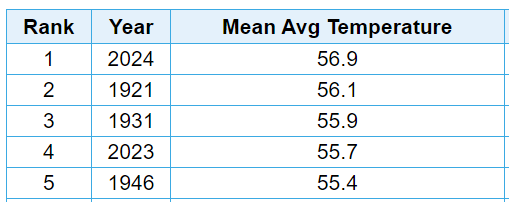
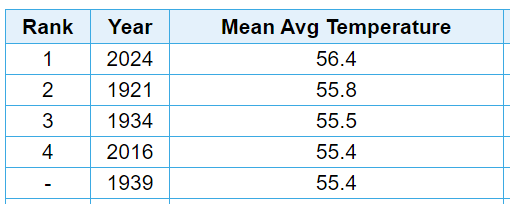
Record warmth regionwide. No doubt that 2024 will go down in the books as the warmest year on record in the Buckeye State. Cleveland Akron Toledo Columbus Dayton Zanesville Mansfield
-
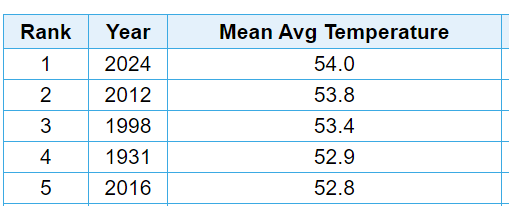
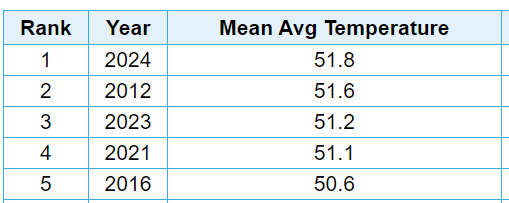
Wow. 78.6F for a yearly mean. That’s hot!
-
Occasional Thoughts on Climate Change
TheClimateChanger replied to donsutherland1's topic in Climate Change
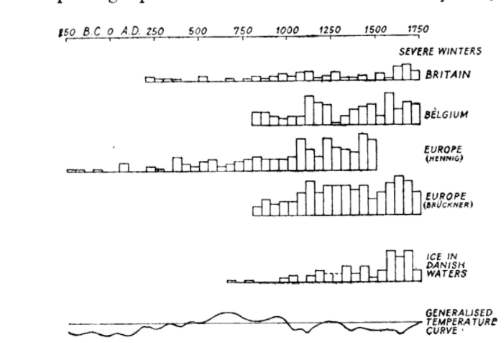
I just mentioned them since they thought the climate was, more or less, stable during the period of recorded history. I'm sure they would agree that a significant change has occurred since that time if they had the benefit of hindsight. I was doing a bit more reading today - Climate Through the Ages, by C. E. P. Brooks (1926). Had to chuckle at this bit: According to the author, Hangzhou reportedly had a median date of April 9th for its last spring snowfall for the period 1131-1260, or nearly a month later than the decade ending 1914. Hangzhou is at 30N, with a climate similar to Columbia, South Carolina, and had snow in most Aprils during the heart of the so-called Medieval Warm Period. And there are people here that think it's reasonable to believe there may have been little if any snow in the Mid Atlantic in that era. According to Wikipedia, for the 1991-2020 period, Hangzhou averaged 2.8 days with snow in February, 0.8 days in March, and 0.1 days in April. This would suggest the median last snowfall probably occurs in early March [and perhaps even very late February]. For further context, the record low in April (since 1951) is 0.2C/32.4F. If this is true - and there's no reason for the author to have made it up - this would be suggestive not of a warmer climate at Hangzhou, but one much colder than today, during that era. This book was incredible. The prevailing thought has changed so much since 1926. They believed - as you can see from the last sentence of the passage above - that high sunspot activity led to cooler global temperatures! The book suggests that the slight increase in radiation was offset by the destruction of ozone, which was believed to be a more potent greenhouse gas than CO2 since it absorbs radiation of different wavelengths than water vapor. The book discusses carbon dioxide, but minimizes the impact because of this "saturation" effect, but does acknowledge that it may play a warming role in the high atmosphere where water vapor is less extensive. This misconception is still trotted out today by some so-called skeptics. Here's a little context from the University of Texas from 2010: Century-old climate myth still making the rounds - UT News Literally, everything was backwards less than 100 years ago. No "Roman Warm Period" - they believed it was colder and wetter, with the mean storm track further south, promoting better conditions for agriculture in the southern Europe. Considering that the European "generalised temperature curve" below appears to zero at 1750 temperatures, imagine where it would be if carried forward to today.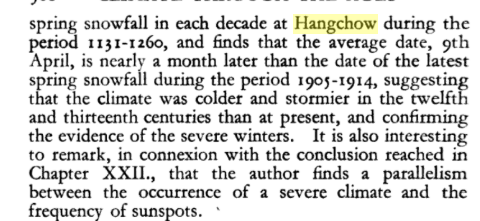
-
Central PA Winter 2024/2025
TheClimateChanger replied to Voyager's topic in Upstate New York/Pennsylvania
Looks like a little subtle rotation showing up on radar, so a spin-up tornado certainly can't be ruled out. -
Pittsburgh/Western PA Winter 2024-2025 Thread
TheClimateChanger replied to Rd9108's topic in Upstate New York/Pennsylvania
-
Central PA Winter 2024/2025
TheClimateChanger replied to Voyager's topic in Upstate New York/Pennsylvania
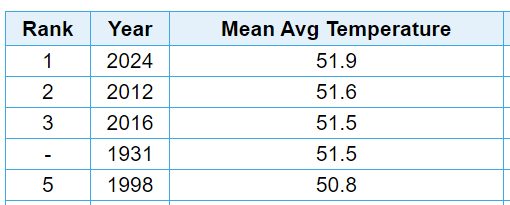
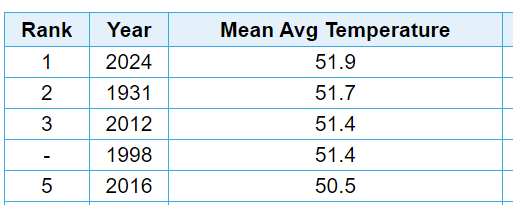
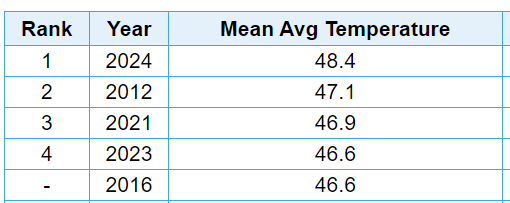
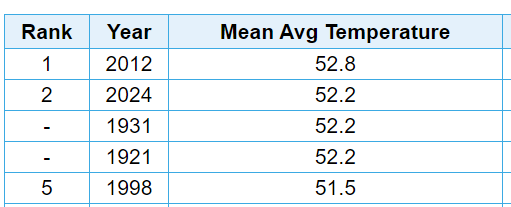
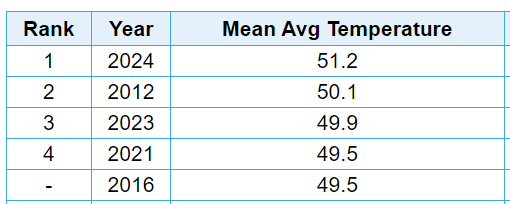
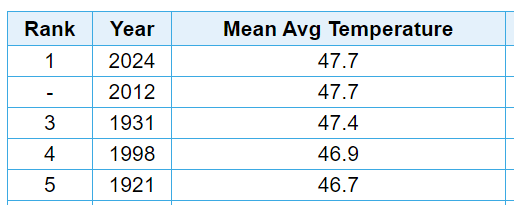
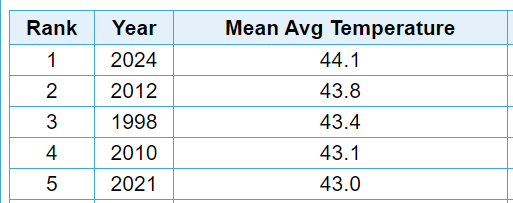
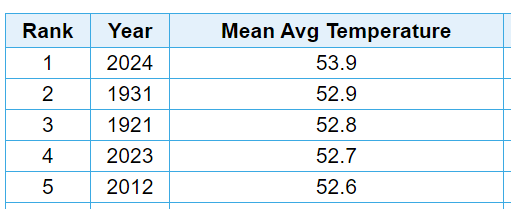
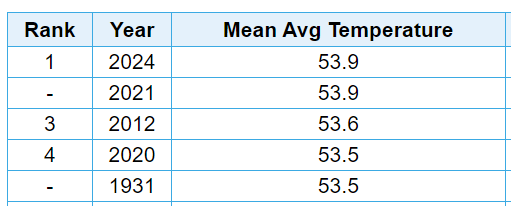
Getting ready to post my now seemingly annual synopsis of record-breaking temperatures. From what I can tell, 2024 was a record-breaker pretty much everywhere. -
Seems underdone. Map shows western Pennsylvania near normal, but the actual departure at Pittsburgh is +2.7F, likely to finish at least +3F with today factored into the mix. Which also secures an incredible, presumably record-breaking 18th consecutive month of warmer than normal temperatures in this record-shatteringly hot year which undoubtely far exceeds anything ever observed in even the lifetime of the oldest great-great grandparent of the oldest person alive today.
-
Pittsburgh/Western PA Winter 2024-2025 Thread
TheClimateChanger replied to Rd9108's topic in Upstate New York/Pennsylvania
Climatologically, not really an outcome that can be discounted. Not unusual to see big storms sliding to our south, although that hasn't been the case in recent years [largely because it's been too warm in that area for heavy snowfall outside of the mountains]. And, of course, snowfall north of I-80 is complements of Lake Erie, with upslope enhancement in the higher terrain. -
Pittsburgh/Western PA Winter 2024-2025 Thread
TheClimateChanger replied to Rd9108's topic in Upstate New York/Pennsylvania
-
Occasional Thoughts on Climate Change
TheClimateChanger replied to donsutherland1's topic in Climate Change
My point in looking at this history is just to point out that there was never any sort of consensus that the MWP was a massive global warming event. Some here - and comments on various social media sites - make it out to be like the PETM. In fact, the mid 20th century view was a departure from the prevailing scientific view of a, more or less, continuity of climate over the preceding 2500 years [a fact which Lamb points out in his 1965 paper]. But even looking at some of these old reconstructions [which tended to be for specific geographic locations], when we update for recent temperature data, they actually largely agree with the assessment that current temperatures are without precedence over the past 1200-1400 years [at least]. If we transported any of these 18th and early 19th century scientists to the present, they would undoubtedly be amazed by the climatic changes that have occurred in that interval. And, in any event, there does not appear to be anything that would suggest there was a 150-200 year period of no snow in the American Mid-Atlantic region 1,000 years ago. And, of course, we have actual modern reconstructions which integrate more data from throughout the globe, which do not suggest temperatures, on a global scale, anywhere near the present values. So any of these contrarian views are implicitly denying the scientific consensus, which itself is building off of this earlier scholarship. Actually, with the benefit of hindsight, it was probably human-caused warming that led to the characterization of the MWP/LIA, since the warming of the late 19th century and (particularly) the first several decades of the 20th century were so substantial that they led to additional research in past climate changes of the common era. Which also gets to the root of a second myth, which is that the various temperature records start at some record cold point. In fact, it appears the climate had moderated some, and by the early 20th century, was rather mild on a millenial scale, with the coldest temperatures of the second millennium likely occurred between about 1550 and 1750 CE. -
Occasional Thoughts on Climate Change
TheClimateChanger replied to donsutherland1's topic in Climate Change
I just find it interesting that this myth is so pervasive. I would even go so far as to say, to some extent, it's a hoax perpetuated by the same people who accuse climate scientists of hoaxing AGW. The post linked below is from user who appears to accept the reality of AGW but appears to believe we know something about the climate of Europe and Asia during the medieval period that suggests the mid-Atlantic region of the United States may have gone 150-200 years with little or no snow. In fact, there appears to be zero evidence to support this contention, yet the post was widely "awarded" suggesting others may also find it to be a reasonable assessment of that time period. Of course, the awards may have been given more for the comeback to certain users were minimizing the recent spate of mild winters. It's worth examining H. H. Lamb's reconstruction of central England temperatures back to 800 CE, which was the source of the original IPCC graphic which is often falsely trotted around as evidence of a global change during the MWP [like I said, to some extent, there is an outright hoaxing from certain segments of the population and science community]. Looking closely at this, we see winter temperatures in the early 20th century were already supposed to have been as warm as those during the peak of the medieval period. And we can see the "raw" reconstruction actually supported somewhat cooler winters. These were determined by contemporary reports of snow and ice cover, as well as notes on mild winters. The values approach those of early 20th century, only with adjustments made by Lamb, who supposed that mild winters may have been somewhat underreported since the climate was warmer. So it's a somewhat circular logic, and there's really no hard evidence of that in the data, since the reconstruction suggests winter temperatures were comparable to those of the late 19th century and even cooler than the early 20th century. The summer temperatures were approximated based on a correlation of dryness/drought with July and August temperatures. We can see here, there is some evidence of warmer July and August mean temperatures in the early part of the second millenium. However, it's interesting the raw data are not presented at all. Instead, adjustments were made to account for supposed changes in the atmospheric and wind patterns during the MWP and LIA. And we can see adjusted values presented in two places - one during the supposed MWP, and one during the heart of the LIA. One can probably surmise from the values presented [and the commentary of the author], that the medieval values were adjusted upwards and the LIA values adjusted downwards. This also suggests that the raw data likely would have shown little change over the entire 1150 years. The values from 1100 to 1400 CE were then adjusted upwards even more to "meet certain botanical considerations." It appears that the author believed temperatures were about 1C too low in the summertime in the early 20th century for effective cultivation of grapes, even though the cultivation of grapes was likely greater during that time period than at any point in the medieval times (more on this later). One other questionable assumption. Even accepting all of the author's adjustments, we see at the peak of the supposed MWP in central England, which he places at 1150-1200 and 1250-1300, DJF temperatures are said to be the same as early 20th century temperatures, while July and August temperatures peak about 0.9C above those of the early 20th century. The five months analyzed then are about 0.5C warmer than the early 20th century, yet the annual value presented peaks in both of those periods at 0.8C warmer than the early 20th century. Why are the annual departures reported 60% higher than the average of the 5 months analyzed? Of course, most of this isn't super important, because the current 30-year running average appears to be higher than the peak 50-year estimate, and several recent years have been at or above 11C - or about 1C higher than the peak of the MWP, as suggested by Lamb's reconstruction. Lamb's 1965 paper also discusses a 1962 reconstruction of Icelandic temperatures based on records of sea ice, which suggested temperatures perhaps 0.4C warmer than the 1901-1930 average between 1100-1150 CE, but that the peak was still about 0.5C less than the decadal average from 1931-1940 [which apparently was the end of the analysis period]. Lamb seems to suggests the relationship between temperature and sea ice might be weaker during low sea ice periods suggesting the peak may have been underestimated by the author of that paper. Regardless, accepting that figure inevitably leads to the conclusion that recent Icelandic temperatures are far higher than any comparable period dating back to at least 954 CE. And Lamb's analysis of Central England - far from casting doubt on AGW - would suggest the most recent 30-year period likely exceeds any 50-year average dating back to 800 CE, and that recent years are exceptionally warm. These are based on reconstructions predating any sort of consensus on AGW [or certainly any awareness of its likely impacts], and, in the case of Lamb's, was predicated on some questionable assumptions. More context on the topic of English grape growing... RealClimate: Medieval warmth and English wine RealClimate: English vineyards again…. If you review climate literature from the early and mid 19th century, you'll see this is a pretty accurate synopsis of the history of grape growing in the British isles. It's worth pointing out that many of the grapes cultivated in that era were used not for wine, but for verjuice. And likely were hardier varieties of grape that wouldn't produce wine that would be marketable in the modern era. And so comparisons with climate of chief grape growing regions [for wine consumption] likely aren't particularly valid. See, e.g., Sir John Leslie's section on climate in Narrative of Discovery and Adventure in the Polar Seas and Regions (1844), and Lorin Blodgett's Climatology of the United States and of the Temperate Regions of the North American Continent (1857). I think Leslie's History of the Climate of the British Isles (1829) expands on this, but I couldn't locate it online.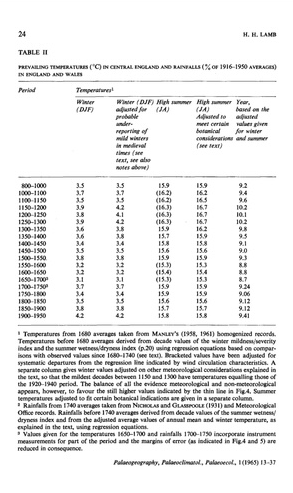
-
Pittsburgh/Western PA Winter 2024-2025 Thread
TheClimateChanger replied to Rd9108's topic in Upstate New York/Pennsylvania
-
Pittsburgh/Western PA Winter 2024-2025 Thread
TheClimateChanger replied to Rd9108's topic in Upstate New York/Pennsylvania
A couple of record highs have also been set. Wheeling reached records each of the last two days, and Morgantown reached a record high of 72F earlier today. -
Pittsburgh/Western PA Winter 2024-2025 Thread
TheClimateChanger replied to Rd9108's topic in Upstate New York/Pennsylvania
Marginal risk of severe weather - including a 2% risk of tornados - expanded into western Pennsylvania. These type of setups have produced well over the last year, so despite the minimal risk, would keep an eye out to see if anything materializes. -
Occasional Thoughts on Climate Change
TheClimateChanger replied to donsutherland1's topic in Climate Change
Interesting. I know BEST has data back to 1750 (land only). This looks a little smoother. But it actually calls to mind a second gripe. A common refrain is that the instrumental record starts at the end of the little ice age, but most of the major instrumental records don’t begin until the late 19th century. While that period seems cold to us, it seems the people who lived in that era widely believed it to be warmer than colonial times. And there definitely seems to be some degree of support for that view in the various reconstructions and with the (rather limited) instrumental records available in that era. For that matter, even the early 20th century looks cold to us, but it was in fact, unbelievably hot compared to any other time in last millenia. Even H. H. Lamb’s original central England reconstruction has the early 20th century, approaching the peak levels of the so-called MWP. And if you look at the graphic, you see around 1000 CE, he has mean temperatures in central England little warmer than the so-called LIA. Given these are 50-year averages, we can probably reliably extrapolate that back and safely assume that it wouldn’t be possible to have a mean near that of the MWP until at least the middle of the first millennium (given these speed of natural climatic changes). The point I’m making here is if you read contemporary science of the time, the late 19th and early 20th century was largely thought to have been a milder period, which is the opposite of what a lot of people say. Yet it seems the most reliable reconstructions agree with the assessment of the era. -
Occasional Thoughts on Climate Change
TheClimateChanger replied to donsutherland1's topic in Climate Change
The characterization of the Medieval Warm Period on Encyclopedia Brittanica versus Wikipedia is telling. Wikipedia presents it as uncontroverted fact, whereas here is how it is presented on Encyclopedia Brittanica: Note it's a hypothesis, the extent of which is disputed among experts [i.e., whether it was a global phenomenon or if it even existed at all]. The graphic shown illustrates Mann's and Jones' reconstructions of Northern Hemisphere temperatures since 1000 C.E., and also includes H. H. Lamb's original reconstruction of Central England temperatures over the same interval [as presented in his 1965 work, which as best as I can tell was the first piece of scholarship to formerly characterize the MWP as a possible widespread event]: This CET reconstruction is extremely flimsy. The proxies used didn't support such a massive jump. They were adjusted by Lamb to produce that effect... read the paper and see how many adjustments [on questionable assumptions] were made to produce that level of warming. The same thing climate deniers accuse scientists of doing today. The timing doesn't even make sense. Icelandic records of sea ice suggest cooling with lots of heavy sea ice conditions in the 1200s and 1300s. 1348 was said to be perhaps the coldest winter. How would there be such a huge disconnect between Iceland and central England? Like I said, I'm just trying to figure out why there are so many that believe it was a period of no snow in North America, and what evidence there is to support that? There doesn't seem to be any. -
Occasional Thoughts on Climate Change
TheClimateChanger replied to donsutherland1's topic in Climate Change
The point is we have had people for decades treating AGW as some unproven theory, while past climate changes are accepted as 100% fact [and often grossly exaggerated]. In fact, the evidence for AGW is obviously 100s of times greater than any supposed evidence of these past eras. And indeed, most modern temperature reconstructions suggest the MWP was perhaps a 0.5C warmer than the heart of the LIA [not at all warmer than the present], and perhaps on par with the start of the 20th century on a global average. By all reliable measures, it was far colder than the present era on a global scale. Yet, there are some here who, even today, believe it was some period where it never snowed and winters torched all year around. What is the evidence for this nonsense? In fact, if you attribute knowledge of the modern greenhouse effect to Svante Arrhenius, the characterization of the greenhouse effect [and the impact of carbon on the climate] far predates any formal characterization of the MWP? Yet, some say the modern reconstructions are "erasing" the MWP? The greatest minds living in the LIA looked at the same evidence that some trot around and concluded [correctly] that there was no massive change in climate. Obviously, they didn't have access to ice cores and tree rings, and things of that nature, that do provide support for some measure of warming, but much of the discussion is just nonsense. I mean you can make the same argument these folks make and say the MWP was "invented" in the late 20th century specifically to obfuscate the reality of human-caused climate change. -
Occasional Thoughts on Climate Change
TheClimateChanger replied to donsutherland1's topic in Climate Change
Yes, I know all that. I never really looked into the medieval warm period, and assumed it was more robust and significant based on how people refer to it on this website. They make it sound like the Eocene or some period of eternal warming. But many of the lines of evidence to support that appear to be superstitious hocus pocus. Would it surprise people to learn that grapes were successfully grown in parts of England for winemaking even during the heart of the so-called little ice age? And there are plenty of vineyards today in England. Why is so much significance given to the cultivation of grapes in medieval times? No special significance was afforded this by the great minds of the past, with evidence of cultivation being rather limited, and evidence that the wine was of low class. There was no need to grow grapes in England in the 19th century, when fine wines could be imported from France and Italy. Would it surprise people to learn that the opposite was said to be true around the Black Sea and surrounding parts of Europe? That is, grapes were said to be cultivated in places in the so-called Little Ice Age where there was no prior record of their cultivation? Would it surprise people to learn that the native "forests" of Iceland were principally shrubby bushes, as they are today, unsuitable for most building? And the Viking sagas considered it a great feat that two of the early settlers were able to assemble enough wood to build a boat to sail to Norway. The Viking sagas describe Vinland as a place with nearly equal day and night, but where on the shortest day, the sun rises at 7:30 and sets at 4:30. I don't know about you, but that doesn't sound like L'Anse Aux Meadows to me. The Viking settlements at Greenland may have failed, but there is little concrete evidence of the role climate change played. Mostly, it was mismanagement, and loss of trade/contact with the mother country which was in the throes of the Black Death. It's likely there was disease and epidemics in the colonies as well. Much significance is attached to cultivation of barley in Iceland during the medieval times, yet in Scotland, the range for cultivation of grains was both northward and higher in altitude than in its historic range during the LIA than during the MWP [which was attributed by the writers to advancements in agriculture, not evidence of climate change]. -
Occasional Thoughts on Climate Change
TheClimateChanger replied to donsutherland1's topic in Climate Change
File this under controversial, but I was doing some "light" reading on the climate from past authorship in the early/mid 19th century over the holiday as I enjoy reading about past climate. I was rather surprised that the great minds of the 18th and early 19th century did not believe there was any appreciable change in climate from antiquity. In fact, this was the prevailing school of thought into the first half of the 20th century. The modern idea of a "medieval warm period" did not really arise until 1965 with H. H. Lamb's publication on the matter, although that built off scholarship from the preceding few decades. I reviewed that article, and found the persuasiveness somewhat lacking. Evidence against a large change was repeatedly dismissed, and when proxy evidence did not correspond to the desired result, it was adjusted and then adjusted some more. The timing of the supposed warm period even seems inconsistent with the modern view - showing warming most pronounced in England from like 1100-1300 CE, whereas now it's more like 800-1000 CE. Icelandic records of sea ice are suggestive of a climate in the North Atlantic much colder than present by the early/mid 13th century (and even colder than the 19th century), but these are dismissed by Lamb. It looks like the idea of a medieval warm period reached its zenith in 1990, with the publication of the first IPCC report, which had an absurd hump for the medieval warm period extending even into the 14th century, despite loads of evidence that it was significantly colder in the 13th and 14th centuries. Hmmm, I wonder why that graphic made it in there? Modern reconstructions such as that appearing in more recent IPCC publications instead show a slight and gradual cooling trend over the entire millenia, abruptly ceasing in the 19th century. The medieval warm period is a small blip in the record. It would appear modern research largely confirms the prevailing scientific wisdom of the 18th and 19th century that there was no significant change in climate in the preceding 2000 years. Personally, I attach great significance to the conclusions of this era, since we are told these scientists and fathers of modern meteorology and climatology were living in the end of a "little ice age." Despite this, they looked at the same evidence we have and concluded there was no significant change in climate from the so-called medieval warm period to the era in which they were living. They may have had access to even more records which have been lost to the hands of time. Yet, some here today like to claim the medieval warm period was even warmer than our current globally-warmed times. These scientists also weren't burdened by the "woke" nonsense of today and would have had no pecuniary interest in their findings. AGW wasn't even known in that era... their only motivation was a desire to find the scientific truth. No money was being showered upon them by vested interests. Despite the foregoing, it would seem many here - even those who accept the scientific reality of anthropogenic climate change - attach an unreasonable significance to the medieval warm period, suggesting it may have been as warm and snowless as recent years. I feel like Band-Aid, except instead of "Do they know its Christmastime at all," it's "do they know the current era is far, far warmer than the so-called medieval warm period?" as per the most reliable temperature / climate reconstructions? What's the truth here? Is there even a medieval warm period and little ice age, or was it more or less, just a natural prolonged and gradual climatic cooling that was interrupted by human activities? Some say it was only a "local" phenomenon and not global. But user @blizzard1024made a good point about this some years back. That's not how the atmospheric circulation works. It seems suspect that there would be sustained local anomalies of warm and cold in a global system. He, of course, concluded that means the medieval warm period was a global phenomenon. But another conclusion that can be drawn is that there simply wasn't a medieval warm period of any significance, local or otherwise, and the temperature departures from that era were not anything significant? More credence ought to be given to the formerly prevailing view of a largely static climate regime over the past 2,000 years. After all, the scientists who reached this conclusion were living in the very region said to be most affected by the MWP and LIA and could find no strong evidence of cooling from the published records and local histories. Modern temperature reconstructions appear more consistent with this view than the one that had its brief zenith in the mid to late 20th century of much more significant global temperature changes. @donsutherland1 @Typhoon Tip -
Central PA Winter 2024/2025
TheClimateChanger replied to Voyager's topic in Upstate New York/Pennsylvania
You guys think we can get an Ohio State & Penn State rematch for the natty? Penn State got an easy bracket. Just need to get by the Georgia/Notre Dame winner. -
New England Winter 2024-25 Bantering, Whining, and Sobbing Thread
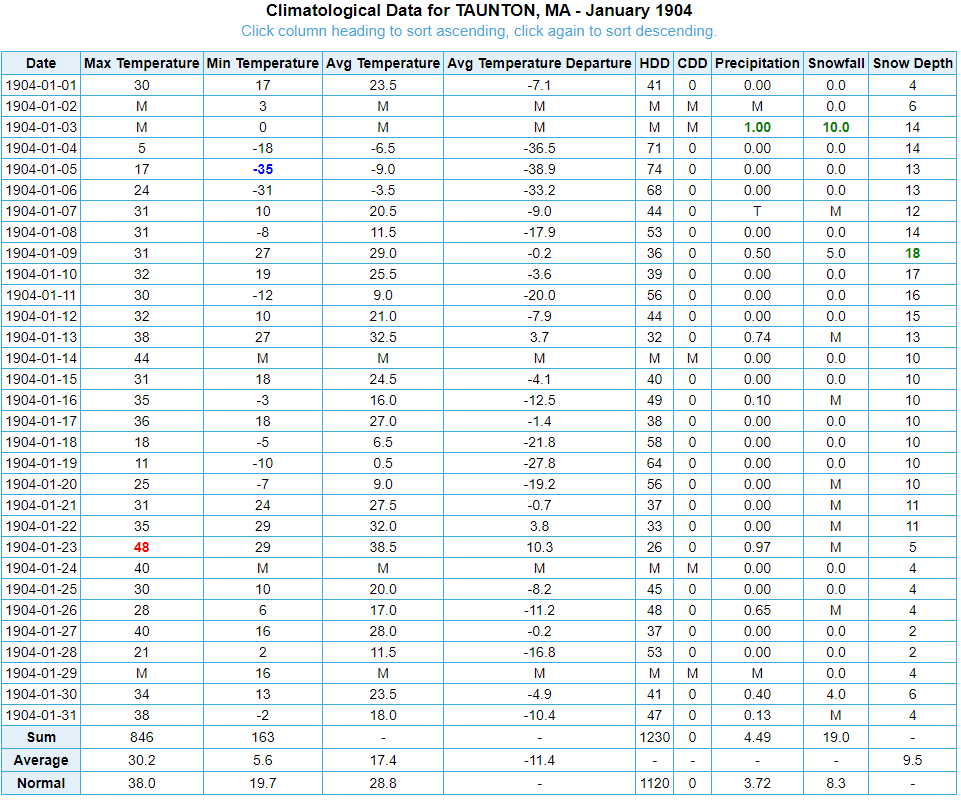
TheClimateChanger replied to klw's topic in New England
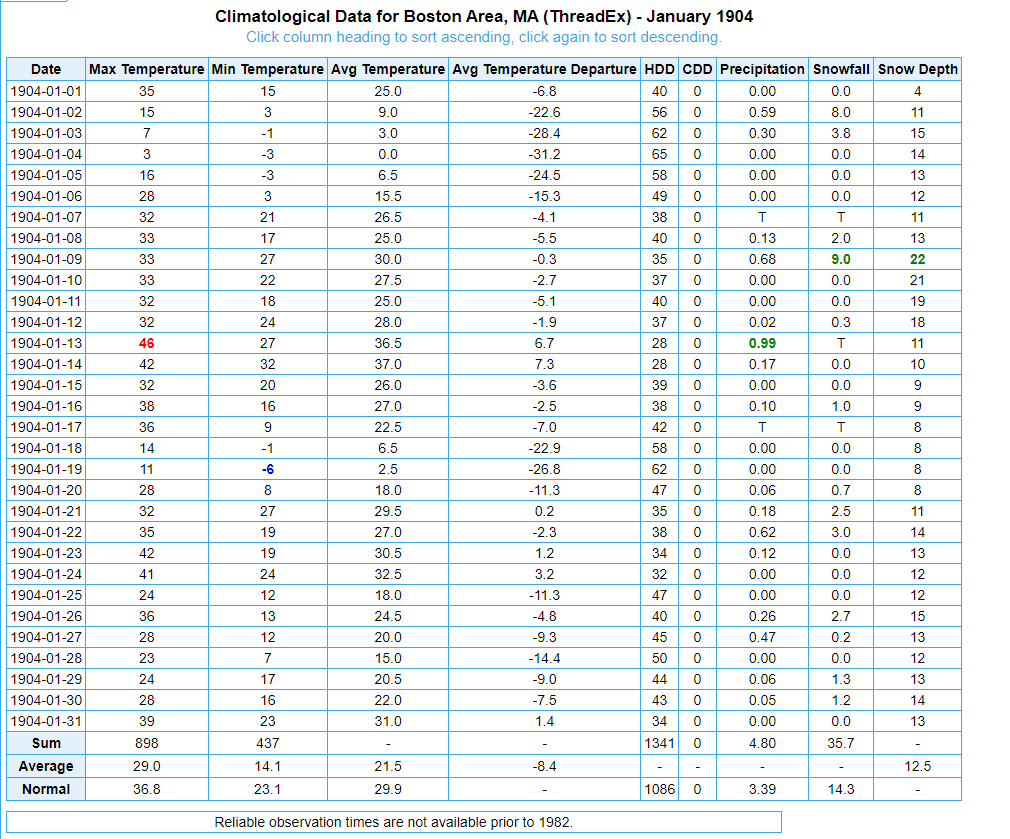
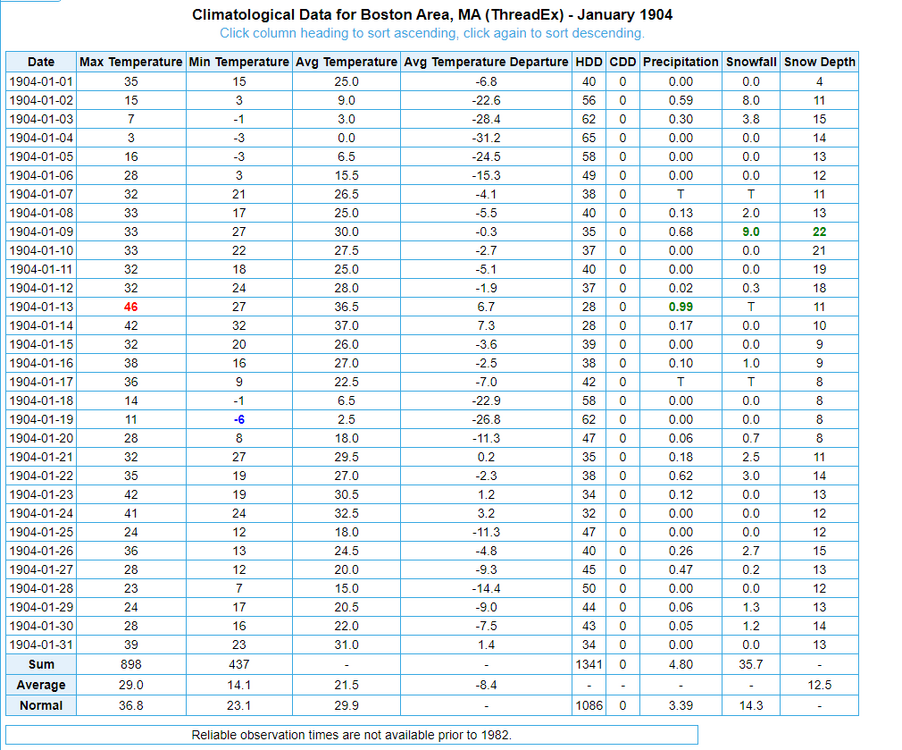
Boston, Massachusetts in the same month: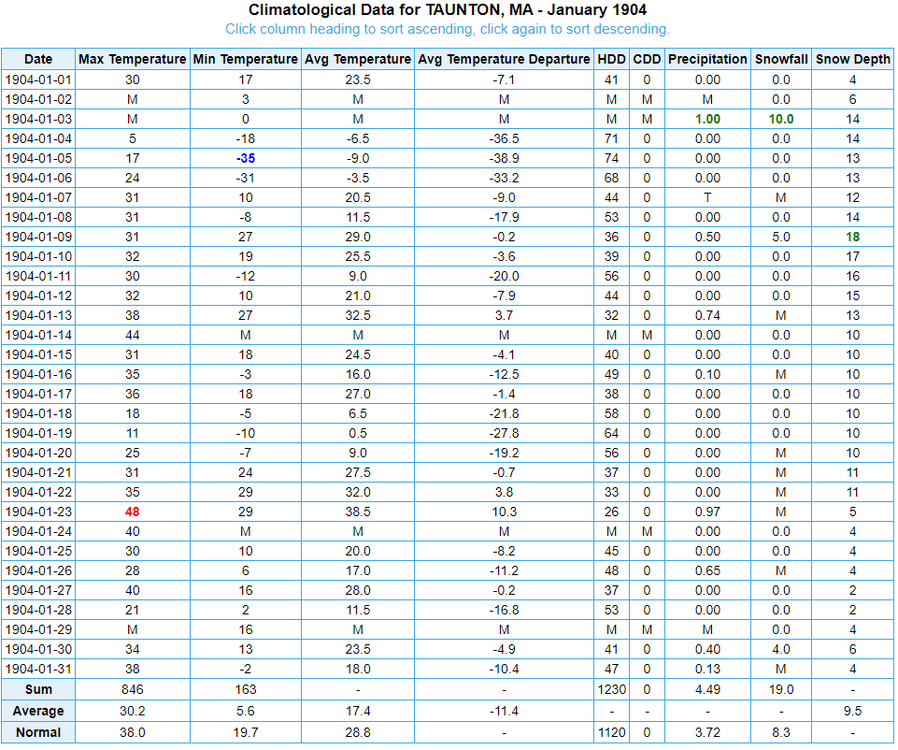
-
New England Winter 2024-25 Bantering, Whining, and Sobbing Thread
TheClimateChanger replied to klw's topic in New England
-
Pittsburgh/Western PA Winter 2024-2025 Thread
TheClimateChanger replied to Rd9108's topic in Upstate New York/Pennsylvania
-
Pittsburgh/Western PA Winter 2024-2025 Thread
TheClimateChanger replied to Rd9108's topic in Upstate New York/Pennsylvania
Roads are awful out there.