TheClimateChanger
-
Posts
4,436 -
Joined
-
Last visited
Content Type
Profiles
Blogs
Forums
American Weather
Media Demo
Store
Gallery
Everything posted by TheClimateChanger
-
Winter 2023-24 Longrange Discussion
TheClimateChanger replied to michsnowfreak's topic in Lakes/Ohio Valley
Wow, I was looking at calendar days with at least 7.0 inches of snowfall and I was surprised at how poorly Columbus, Ohio fares in that department. In the threaded history for the city (1884-present), there have only been 17 calendar days with at least 7.0 inches of snow at Columbus. By comparison, Tri Cities, TN has had 19 in its threaded history, which only dates to 1937. Louisville, KY has had 32 days. Lexington, KY has had 26 days. Cincinnati has had 19 such days. Charleston, WV has had 43 days (since 1903). Clarksburg, WV had 38 such days between 1922 and 1998 [no snowfall records since]. Morgantown, WV - with no snowfall records since 1998 - has had 53 days. Richmond, VA has had 37 such days. Washington, DC 49 days. Knoxville, TN 25 days. Even Raleigh-Durham, NC 25 days. Charlotte, NC 18 days. Chattanooga, TN has had one fewer - at 16 days. Nearby Zanesville - with no snowfall records since at least the late 1990s - has had 27 days. Indianapolis has had 33, nearly twice as many. St, Louis has had 35 - more than twice as many. Even Little Rock, Arkansas and Tulsa, Oklahoma match Columbus's 17 days of 7"+ snowfall. Lubbock, Texas has had 19, while Amarillo, Texas does incredibly well on this metric with 46 such days. Who would think RDU and Charlotte have had more 7"+ calendar days than Columbus, and Little Rock and Tulsa the same number of such days? -
Winter 2023-24 Longrange Discussion
TheClimateChanger replied to michsnowfreak's topic in Lakes/Ohio Valley
Weird. Why southeast Michigan? Much of northern Indiana, all of northeast Ohio, northwest Pennsylvania - really all of northern Pennsylvania and at least parts of central Pennsylvania, plus the higher terrain of southwest Pennsylvania - are more prone to heavy snowfalls, yet they are at 6 inches. Even parts of the UP and Duluth/INL are at 6-inch criteria. Makes zero sense. -
Winter 2023-24 Longrange Discussion
TheClimateChanger replied to michsnowfreak's topic in Lakes/Ohio Valley
If the averages are already that close, my money would definitely be on Fort Myers. If I recall, El Nino favors a bit drier around the Great Lakes, but decidedly wetter than usual in south Florida. -
Occasional Thoughts on Climate Change
TheClimateChanger replied to donsutherland1's topic in Climate Change
Well, I think Ms. LaDuke was saying access to clean water should be a right, not something that we need to push for. And corporations should be viewed as terrorists for infringing on that right by dumping chemicals into the water. -
Pittsburgh/Western PA Fall 2023 Discussion
TheClimateChanger replied to Ahoff's topic in Upstate New York/Pennsylvania
And it's also true at many long-period sites especially from Pittsburgh north. Zanesville and Morgantown have had more clearing on some of the chillier nights so the rankings at those sites aren't as impressive at this point. DuBois Wheeling Youngstown, Ohio
-
Pittsburgh/Western PA Fall 2023 Discussion
TheClimateChanger replied to Ahoff's topic in Upstate New York/Pennsylvania
I'd say it's pretty notable. This is the warmest minimum this late in the fall season in the entire threaded record since 1890, and third warmest overall. Warmest ever at either airport site, and only the third time since records moved out of downtown that it hasn't dropped below 40F by this point in the season. As with many records of this sort, recent history kind of results in it feeling more "normal" than it really is historically, since we had comparable temperatures just 2 years ago.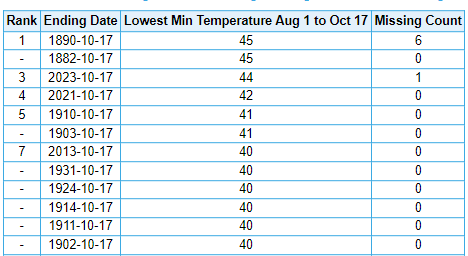
-
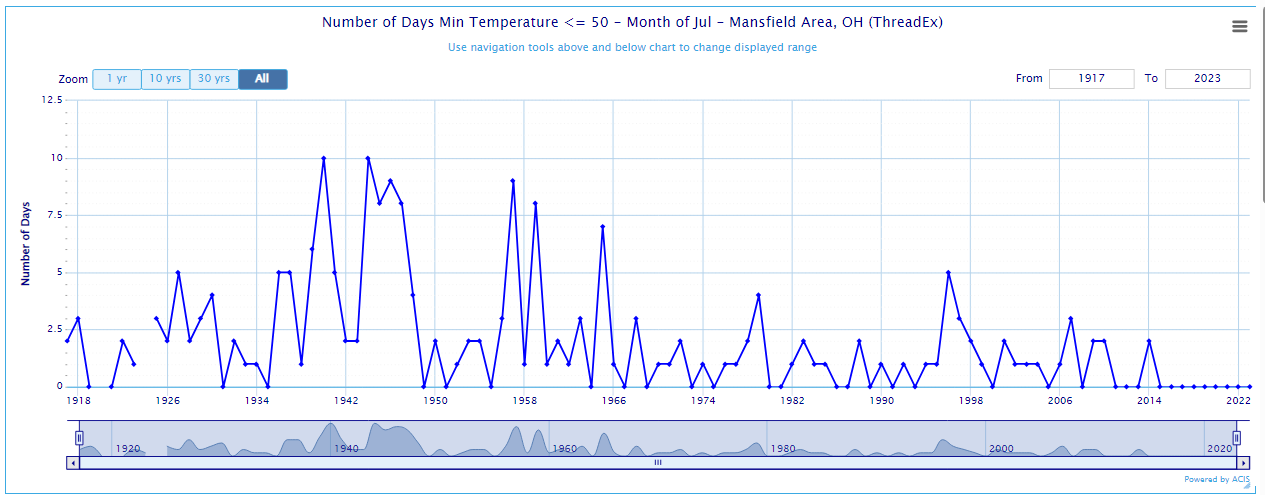
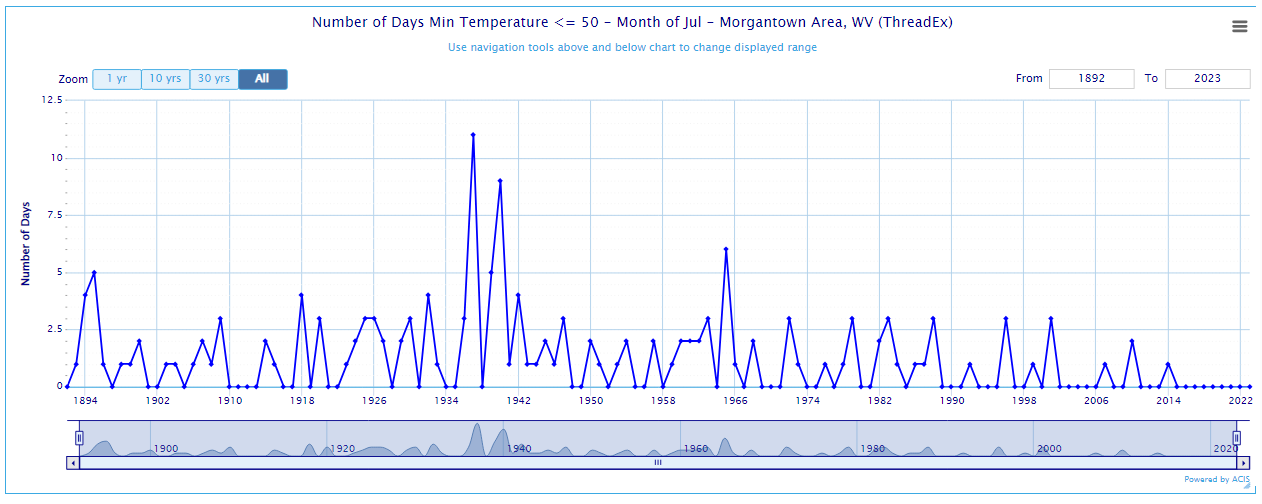
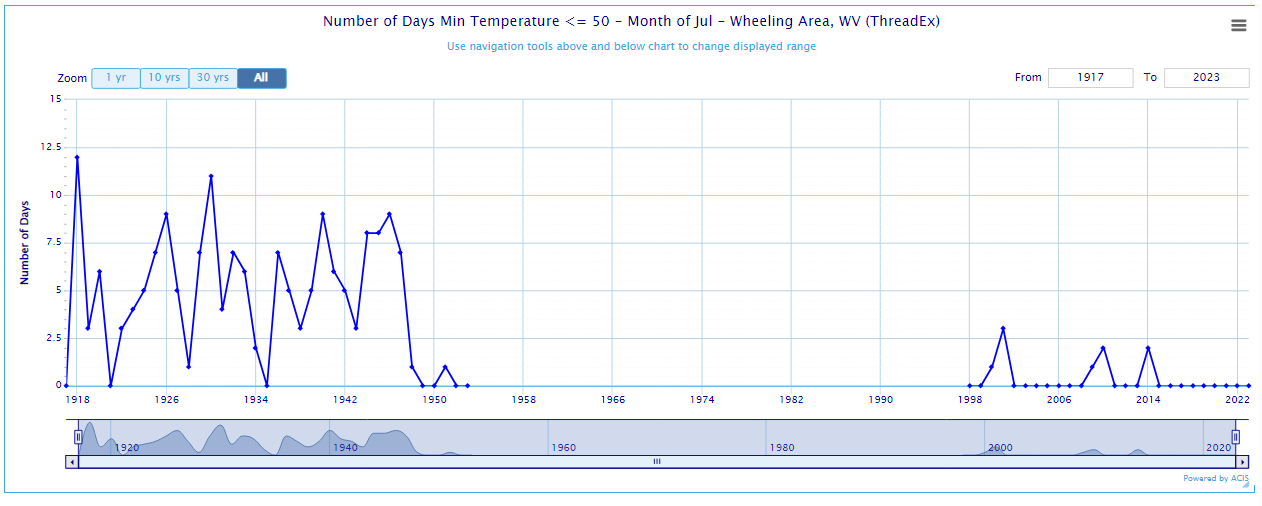
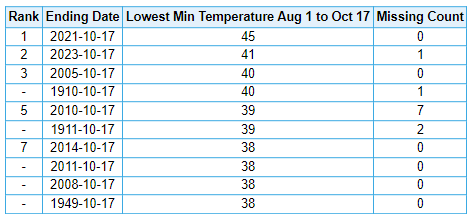
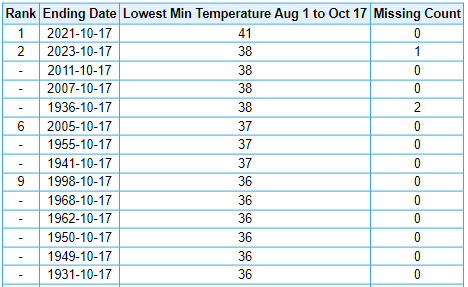
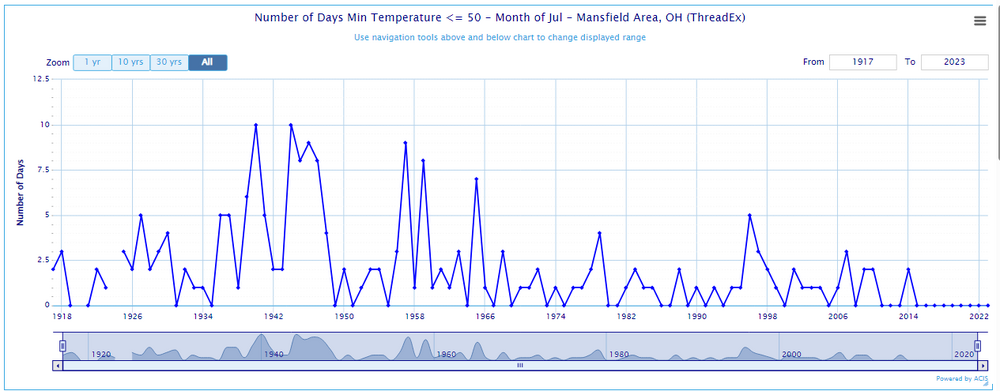
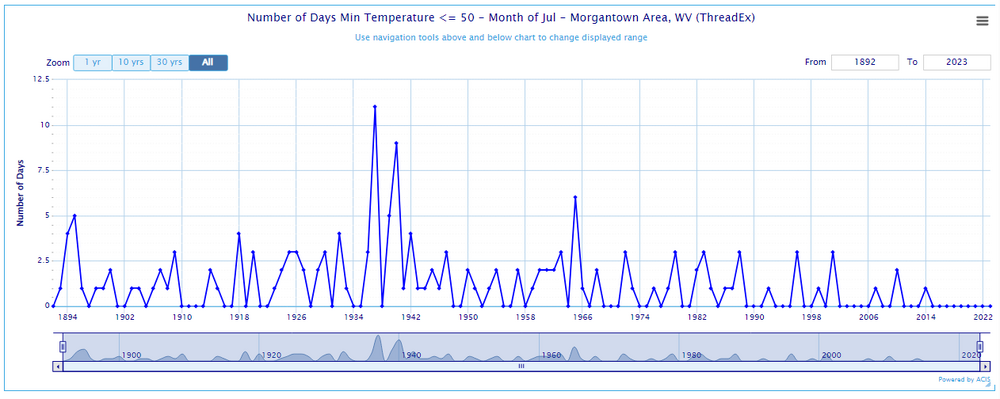
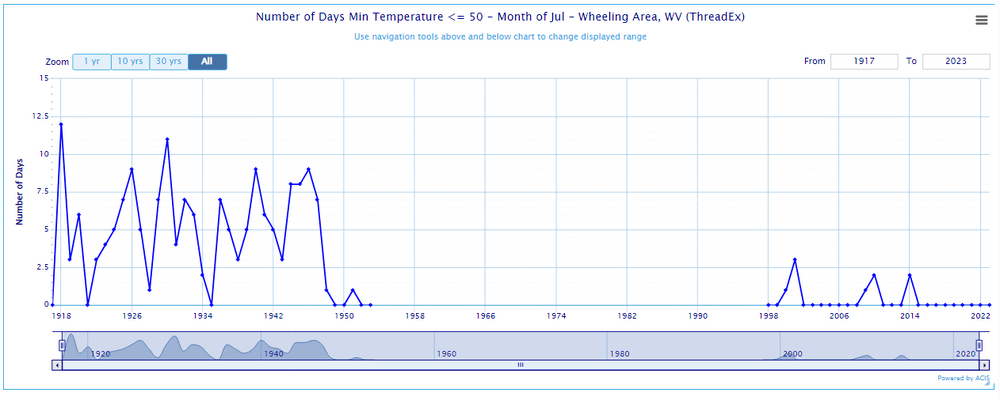
I mean you don't even need to fit a trend line to these graphs to see the drop. Mansfield, Ohio Elkins, WV (elevation: 1900') Morgantown, WV Wheeling, WV [long break in threaded record, but provides interesting dichotomy]
-
I don't think there should be any legitimate doubt that cool summer nights have dropped precipitously. Where I'm from, it used to be fairly commonplace to have at least a few lows at or below 50F (10C) even in July, and now it rarely drops to those levels in the month of July. And that's pretty common to much of the region.
-
Central PA Autumn 2023
TheClimateChanger replied to Itstrainingtime's topic in Upstate New York/Pennsylvania
Was 37 in Washington, PA as well: National Weather Service : Observed Weather for past 3 Days : Washington - Washington County Airport -
Incidentally, NCEI recently released its national rankings. For the Great Lakes region as a whole, 2023 came in as 16th warmest on record (since 1895). The top five warmest years in the NCEI/NOAA dataset for the larger Great Lakes region are: 2015 (65.2F), 1931 (64.8F), 1921 (64.2F), 2005 (64.1F) and 2016 (64.1F). Since the official records date only to 1895, there is no data for 1881; however, that would almost certainly be among the warmest Septembers on record. The top five coolest years (since 1895) in the NCEI/NOAA dataset for the larger Great Lakes Region are: 1918 (52.8F); 1924 (54.9F); 1975 (55.1F); 1896 (55.4F); and 1928 (55.4F). Of note, NOAA/NCEI estimates trend at +1.2F/century for September in the Great Lakes region, since 1895. This matches the estimated trend since 1860 from the dataset I put together for the lower Lakes region (0.66C/century, which equals +1.18F/century).
-
Interesting. I did an abridged version for the Lower Great Lakes in September back to 1860, since I didn't have time to transcribe earlier records. I have the warmest years as 1881, 1931, 1921, 2015, 2016, and 2018. The coolest years were 1918, 1975, 1860, 1883, 1863 & 1866.
-
Pittsburgh/Western PA Fall 2023 Discussion
TheClimateChanger replied to Ahoff's topic in Upstate New York/Pennsylvania
Had some patchy rooftop frost in the area overnight, mainly in lower lying areas. Zelienople Municipal Airport dropped to 34F: National Weather Service : Observed Weather for past 3 Days : Zelienople Municipal Airport -
Octorcher or Roctober 2023 Discussion Thread
TheClimateChanger replied to Damage In Tolland's topic in New England
Of course. Where are all these daily and monthly record lows being set right now? -
Octorcher or Roctober 2023 Discussion Thread
TheClimateChanger replied to Damage In Tolland's topic in New England
The post was in response to @powderfreak's post about a lack of a freeze on Whiteface Mountain. I was sharing the coldest reading of the early fall season at Mount Washington. June cold would be considered late spring. Honestly, July could go either way and normally it wouldn't matter because 99% of the low elevation locations in the country have probably never had a July freeze, but Mount Washington regularly drops below freezing in all months of the year. Tldr: the July 1 cutoff was used to show the coldest reading so far this late summer/fall. The fact that it hasn't dropped below 34F on the Whiteface Mtn. summit, or below 30F on the Mount Washington summit, is pretty significant. It's been as cold as 28F by this point of the calendar year, even in the Boston urban heat island. -
Octorcher or Roctober 2023 Discussion Thread
TheClimateChanger replied to Damage In Tolland's topic in New England
At the Mount Washington summit, the high was 61F and the low 53F yesterday. Both of these values were the second highest observed in the month of October. Unlike Whiteface, Mount Washington reached 30F on the 26th of September; however, this is the first year not to have dropped below 30F by this point in the calendar year. There were some apparent issues with the equipment, so some missing data is noted. However, it was earlier in the summer and highly doubtful there would be anything colder than the 9-26 reading.
-
Octorcher or Roctober 2023 Discussion Thread
TheClimateChanger replied to Damage In Tolland's topic in New England
Yes, I think you are right. This time of the year it becomes harder to fully mix out that low layer inversion, with the lower sun angle. It was also very calm - even the Mt. Washington summit had calm winds for a time (well, 1 mph officially). For the record, the 86F at Saranac Lake tied October 3, 1941, and October 11, 1919, for the monthly record in the threaded history. Saranac Lake, of course, is a place with some elevational changes, so I don't know how representative those earlier records are. Since the station moved to the airport in 1998, the highest observed in October had been 80F, on October 5, 2007. So the last two days, were one of only 3 80+ days since 1998. Additionally, Syracuse reached 89F, setting a new October monthly record. The existing record was only a few years old: 88F, 10/1/2019. -
Octorcher or Roctober 2023 Discussion Thread
TheClimateChanger replied to Damage In Tolland's topic in New England
We did it! BTV reached at least 86F, setting a new October monthly record. 5 of 12 monthly record high values have now occurred since 2015, with records in the threaded history dating continuously to 1884. Mount Washington, NH reached at least 61F. I believe the low was 53F. Both of which would be the second highest observed in the month of October. If it doesn't tick up to 62F today, there is one last chance tomorrow. -
Not sure if either of these are verified, but it was allegedly as high as 94F in parts of the Upper Peninsula yesterday. I did some research and I believe 94F would tie the Michigan statewide record for the month of October. A high of 94F was observed on October 1, 1897, at Mottville; at St. Joseph on October 4 & 5, 1922; at Canton on October 7, 2007; and at Algonac WWTP on October 8, 2007.
-
Not quite. Today's high of 89F was actually one shy of the daily record. It has reached 90F or better six times on record in the month of October, most recently on October 1, 2019. 90+ readings in October in Toledo's threaded climate record: (1) 90, on October 1, 1897 (2) 92 on October 8, 1939 (3) 92 on October 4, 1951 (4) 90, on October 3, 1953 (5) 91, on October 7, 1963 (6) 91, on October 1, 2019
-
Lake Superior looks primed to deliver. It's like the Little Engine That Could, straying not far from average for much of the summer, but a late surge has brought it to the highest in the GLSEA era for the date.
-
Central PA Autumn 2023
TheClimateChanger replied to Itstrainingtime's topic in Upstate New York/Pennsylvania
New monthly maximum water temperature observed at the Buffalo water intake crib on Lake Erie. The water temperature reached 70F, both yesterday and today. This is the first time a water temperature of 70F has been observed in the month of October. Records date to 1927. Prior to the recent record, the highest daily readings are: 69F: October 1, 2023; October 1-2, 2016 68F: October 1-2, 2019; October 1, 2017; October 3-6, 2016; October 9-11, 2007; October 1, 1933; and October 1-5, 1931 Source: Lake Erie October Temperatures Buffalo (weather.gov) -
Good news for those interested in taking a late season dip in the Great Lakes, or for those desiring warmer waters to accommodate lake effect snows. I know Buffalo did quite well last year, in that department. The temperature of Lake Erie, at the Buffalo water intake crib, yesterday and today reached 70F: Lake Erie October Temperatures Buffalo (weather.gov) This is the first time in recorded history (back to 1927), that a water temperature of 70F or better has been observed at the Buffalo crib during the month of October. The prior monthly record of 69F, was set on October 1 & 2, 2016, and on October 1, 2023. There have also been 16 days on which a water temperature of 68F was observed: October 1-5, 1931; October 1, 1933; October 9-11, 2007; October 3-6, 2016; October 1, 2017; and October 1-2, 2019.
-
Just an incredible stretch for early autumn. Sault Ste. Marie, with records dating to 1888, set its monthly record of 83F yesterday, and is poised to match or exceed that again today. The prior monthly record was 82F, set on October 4, 1922. Back-to-back monthly records at a place with 136 years of observations... absolutely astounding. Up to 81F so far: Sault Ste. Marie (weather.gov) Traverse City, Michigan fell a degree short of its monthly record yesterday. Reached 88F. The all-time record is 89F, set on October 2, 1922. Forecast to reach 88F again today. Currently 86F, although there was one 5-minute observation of 88F earlier: Cherry Capital Airport (weather.gov)
-
Central PA Autumn 2023
TheClimateChanger replied to Itstrainingtime's topic in Upstate New York/Pennsylvania
Actually quite warm all across upstate New York. Looks like they are actually going to be warmer than most of the Commonwealth during this stretch. The forecast for Buffalo has 89F tomorrow, which would be the second hottest October day on record should it occur, and the hottest in nearly a century (all-time record: 92F, on 10/2/1927). -
Central PA Autumn 2023
TheClimateChanger replied to Itstrainingtime's topic in Upstate New York/Pennsylvania
Syracuse Airport (SYR) is forecast to reach 88F tomorrow, which would tie the monthly record of 88F set on October 1, 2019. Posting here, due to lack of active upstate NY thread. Always worth noting potential monthly or all-time records IMO.