TheClimateChanger
-
Posts
4,397 -
Joined
-
Last visited
Content Type
Profiles
Blogs
Forums
American Weather
Media Demo
Store
Gallery
Everything posted by TheClimateChanger
-
April 16-17 Severe Weather Event
TheClimateChanger replied to nwohweather's topic in Lakes/Ohio Valley
-
April 16-17 Severe Weather Event
TheClimateChanger replied to nwohweather's topic in Lakes/Ohio Valley
-
Pittsburgh/Western PA Spring 2024
TheClimateChanger replied to Ahoff's topic in Upstate New York/Pennsylvania
This time of the year, I feel like you've got to add a good 3-5 degrees to whatever they are forecasting to account for the lack of vegetation if there's any chance of appreciable sunshine. I'm sure once we get to summer, a lot of those 90-degree forecasts will stall at 88-89 though. -
Pittsburgh/Western PA Spring 2024
TheClimateChanger replied to Ahoff's topic in Upstate New York/Pennsylvania
If we compare this to some cities in the Upper South, you can see the last two years, this period has been about on par for what would have been deemed normal for the lower elevations of northeast Tennessee and southwest Virginia, and well within the limits of normal variability in a place like Knoxville, Tennessee. This is surprising to me because this is heavily weighted toward winter, which tends to be the time of the year when the south is much warmer than western Pennsylvania. In the 30-year period from 1956-1985, only three years were warmer at Charleston, West Virginia [and only 5 were warmer than the same period in 2023 at PIT]. Similar story at Roanoke, Virginia. Only 10 of 30 years had a warmer YTD than Pittsburgh in the period from 1956-1985. And last year too would have placed solidly around the median value. In the Tri-Cities area of Tennessee, only 10 of 30 years had a warmer YTD than this year at Pittsburgh. And last year would have been around the median value.
-
Central Pa. Spring 2024
TheClimateChanger replied to mahantango#1's topic in Upstate New York/Pennsylvania
Sorry for the off-topic post. But I was trying to figure out whether Pennsylvania is the best state, and I noticed that U.S. News and World Report has us at only 40th best [in other words, 11th worst]. Do you guys think this is a fair ranking? Why is it so low? Pennsylvania is the 5th most populous state, has plenty of natural beauty and a mild climate. Link: U.S. News and World Report Ranking for Pennsylvania -
April 16-17 Severe Weather Event
TheClimateChanger replied to nwohweather's topic in Lakes/Ohio Valley
Not sure. Almost looks like a fog bank getting sucked up in updrafts. Is that possible? -
Pittsburgh/Western PA Spring 2024
TheClimateChanger replied to Ahoff's topic in Upstate New York/Pennsylvania
This projection has worked out pretty good. Currently, PIT is at 55.1F for the MTD - up to ninth place. With today factored in, that should rise to around 55.8F, which would be good for 5th warmest for the MTD. Also, up to third place on the YTD rankings in the threaded record. A full 0.5F warmer than 2012, and 0.6F warmer than last year.
-
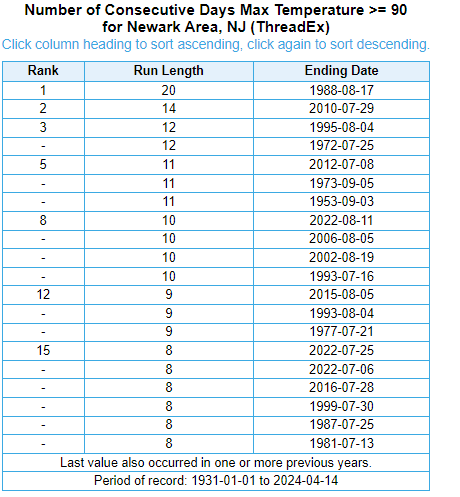
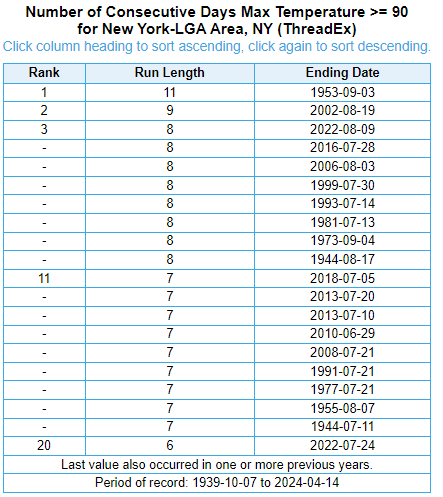
As a follow-up, this looks to be something specific to NYC (Central Park) ASOS. In addition to switching to an automated system at Central Park, they've also allowed a veritable jungle to encroach on the site in contravention of standard siting rules. So I would say it probably reflects a more substantial warm-season daytime cooling bias at NYC. 9 of the 20 longest streaks of 90+ at EWR are from the 21st century. And 10 of 20 at LGA.
-
Interesting. I don't see much evidence for this, but [assuming you are using data from first-order sites to draw this conclusion] it seems to coincide with the move to automated weather observing systems. Based on a study of 76 first-order sites from September 1, 1994 to August 31, 1995, ASOS averaged +0.79F COOLER* than the temperatures measured from conventional hygrothermometers - more specifically 0.90F COOLER for daytime maxima and 0.66F COOLER for overnight minima. Of the 76 sites studied, all but nine had a cooling bias with the installation of the ASOS. The study estimated +0.53F as a systemic bias, with an additional +0.37F bias due to improper solar shielding in the conventional hygrothermometer in the daytime, and an additional bias of +0.13F [but variable] for overnight temperatures resulting from the move of the station from sites close to airport buildings to more remote areas of the airport by the runways. What's interesting to me if you look at the temperature traces from first order sites today, it's warmed so much that this step change of nearly 1F is not even detectable. Can't help but wonder if the change in instrumentation isn't at play here if the data truly shows a decrease in heatwave length. It's certainly WAY hotter nowadays than it used to be in the summertime. Source: https://climate.colostate.edu/pdfs/climo_rpt_96_2.pdf Edit: Sorry, originally had warmer here. Just got the comparison mixed up, should read cooler.
-
Pittsburgh/Western PA Spring 2024
TheClimateChanger replied to Ahoff's topic in Upstate New York/Pennsylvania
Now up to third place all time for April precipitation since 1836. The record is 9.27" from 1852, which was observed at Allegheny Arsenal in present-day Lawrenceville by the U.S. Army Signal Corps. The highest total since the formation of the Weather Bureau [now National Weather Service] is 8.11" in 1901 from the downtown city office. With about two weeks left in the month, the current tally is 7.63 inches. Surprisingly, it's been quite a while (1987) since we had an April on this list (although 1998 & 2011 saw 5.00" and 5.13" respectively). Source: https://www.weather.gov/media/pbz/records/prec.pdf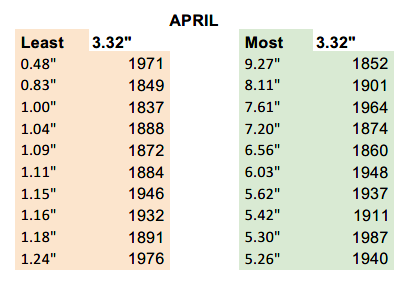
-
Pittsburgh/Western PA Spring 2024
TheClimateChanger replied to Ahoff's topic in Upstate New York/Pennsylvania
82/44 officially for the high & low. I had 83.8/39.9 on the home station. Looks like the storms may miss us, which would certainly be welcome with all the recent rainfall. -
Pittsburgh/Western PA Spring 2024
TheClimateChanger replied to Ahoff's topic in Upstate New York/Pennsylvania
Big upgrade for our area for today, as the enhanced risk has been expanded all the way into eastern Ohio. Includes a 5-10% risk of tornadoes within 25 miles of a point. -
Pittsburgh/Western PA Spring 2024
TheClimateChanger replied to Ahoff's topic in Upstate New York/Pennsylvania
-
Pittsburgh/Western PA Spring 2024
TheClimateChanger replied to Ahoff's topic in Upstate New York/Pennsylvania
-
Pittsburgh/Western PA Spring 2024
TheClimateChanger replied to Ahoff's topic in Upstate New York/Pennsylvania
Flash Flood Warning OHC029-081-PAC003-007-019-073-125-WVC009-029-120430- /O.EXT.KPBZ.FF.W.0006.000000T0000Z-240412T0430Z/ /00000.0.ER.000000T0000Z.000000T0000Z.000000T0000Z.OO/ BULLETIN - EAS ACTIVATION REQUESTED Flash Flood Warning National Weather Service Pittsburgh PA 632 PM EDT Thu Apr 11 2024 The National Weather Service in Pittsburgh has extended the * Flash Flood Warning for... Southeastern Columbiana County in east central Ohio... Northeastern Jefferson OH County in east central Ohio... Allegheny County in southwestern Pennsylvania... Northwestern Washington County in southwestern Pennsylvania... Southern Butler County in west central Pennsylvania... Beaver County in western Pennsylvania... Southern Lawrence County in western Pennsylvania... Brooke County in northern West Virginia... Hancock County in northern West Virginia... * Until 1230 AM EDT. * At 632 PM EDT, local law enforcement reported thunderstorms producing heavy rain across the warned area. Between 0.8 and 1.5 inches of rain have fallen. Additional rainfall amounts of 1 to 2 inches are possible in the warned area. Flash flooding is already occurring. HAZARD...Life threatening flash flooding. Thunderstorms producing flash flooding. SOURCE...Law enforcement reported significant flooding in Oakdale. Roads were closed, and a water rescue occured with a vehicle stuck in flood waters in Oakdale. IMPACT...Life threatening flash flooding of creeks and streams, urban areas, highways, streets and underpasses. * Some locations that will experience flash flooding include... Pittsburgh, Penn Hills, Mount Lebanon, Bethel Park, Ross Township, McCandless Township, Monroeville, Cranberry, Moon Township, McMurray, Weirton, McKeesport, Steubenville, Butler, Franklin Park, East Liverpool, Aliquippa, Canonsburg, Beaver Falls and Monaca. PRECAUTIONARY/PREPAREDNESS ACTIONS... Turn around, don`t drown when encountering flooded roads. Most flood deaths occur in vehicles. && LAT...LON 4090 8052 4096 8051 4083 7969 4033 7984 4026 8030 4034 8079 4090 8054 FLASH FLOOD...OBSERVED FLASH FLOOD DAMAGE THREAT...CONSIDERABLE $$ WM -
Pittsburgh/Western PA Spring 2024
TheClimateChanger replied to Ahoff's topic in Upstate New York/Pennsylvania
Also, the wettest first 10 days of April on record. This doesn't include the approximately 1/2-inch that's fallen today. We may have a top 10 wettest April on lock by midnight. Looking at the weather records, there has only been one year with an April among both the 20 warmest and 20 wettest. April 1948 is 13th warmest in the threaded record (54.7F) and fourth wettest (6.03").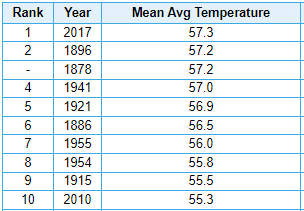
-
Occasional Thoughts on Climate Change
TheClimateChanger replied to donsutherland1's topic in Climate Change
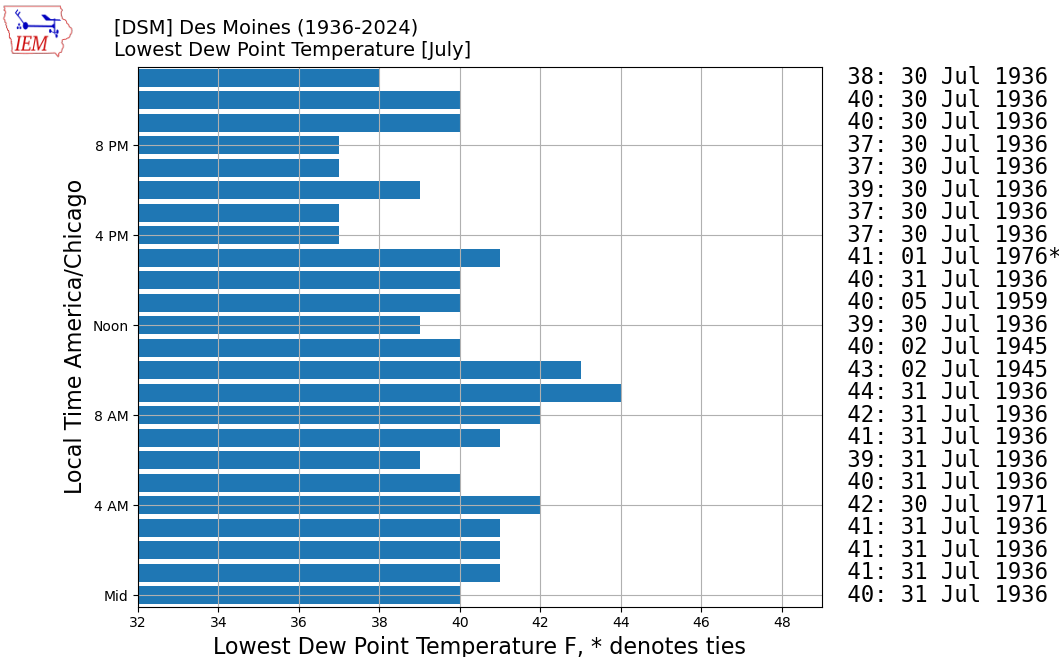
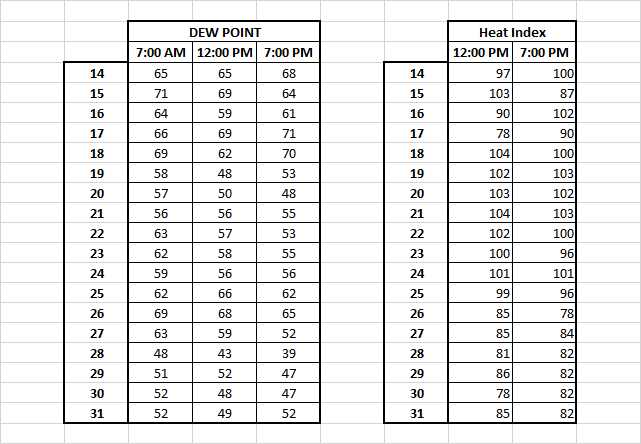
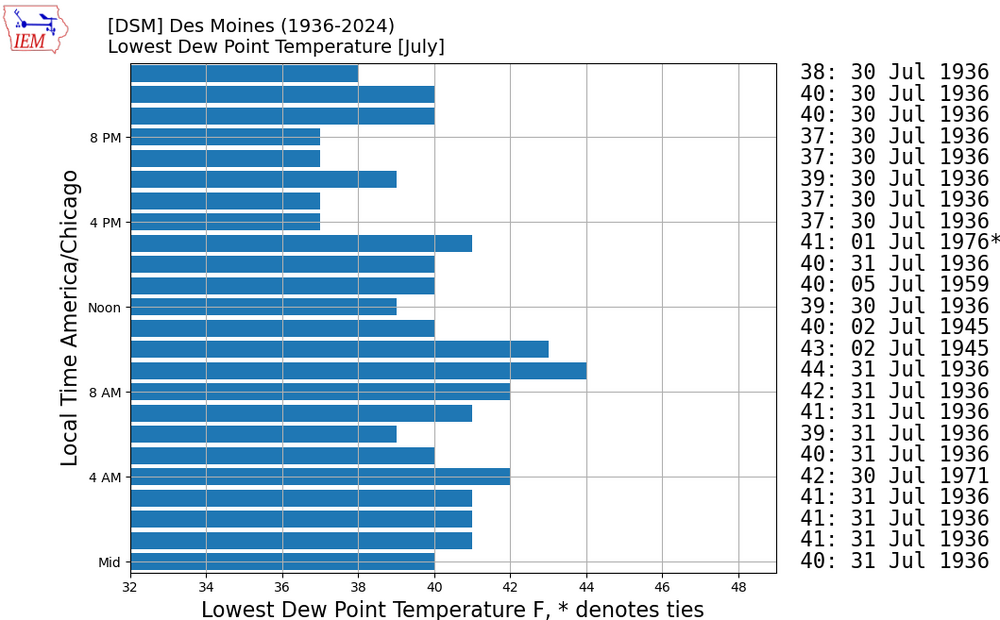
July 1934 was very similar to 1936 at Des Moines, Iowa, albeit a couple of degrees cooler. I took the given temperatures and relative humidity values for 7 am, 12 noon, and 7 pm, to create the following tables, for the period from July 14 through July 31. Note that the value for 7 pm on July 16, 1934 (101F) appears to be a scrivener's error, as the observed high temperature was only 96F on that date. It may have been intended to read 91F, but in the table below I had used the given value. As you can see, there was a stretch of 7 straight days of 100F+ heat indices, which would have nearly certainly extended into the 25th for an eighth straight day if we had more data to confirm. Taken literally, this would also match the 11 of 12 stretch from 1999; however, as noted the value for 7 pm on the 16th appears to be incorrect. And the humidity was otherwise too low for a heat index of 100F or better given the actual high of 96F. But overall, the heat index values are not that crazy considering this is probably the worst heat wave on record in Des Moines. Heat warning criteria would not have been met on any date. While we think of heat index as additive, most days during this stretch it would have actually resulted in a reading below the dry bulb temperature. Also, of note, the calculated dewpoint of 39F at 7 pm on the 28th would be among the lowest ever observed at Des Moines in the month of July. There has never been a dewpoint below 40F observed in the month of July since July 30, 1936 (see chart below for lowest hourly readings from 1936 to the present). Even a dew point below 50F would be exceptionally rare today, and yet this value was achieved on numerous dates in this stretch - including some of the record-breaking hot days. Figure 1. Calculated dewpoints and heat index values at Des Moines, from July 14-July 31, 1934. Figure 2. Lowest hourly dew point temperature readings at Des Moines in the month of July (1936-present).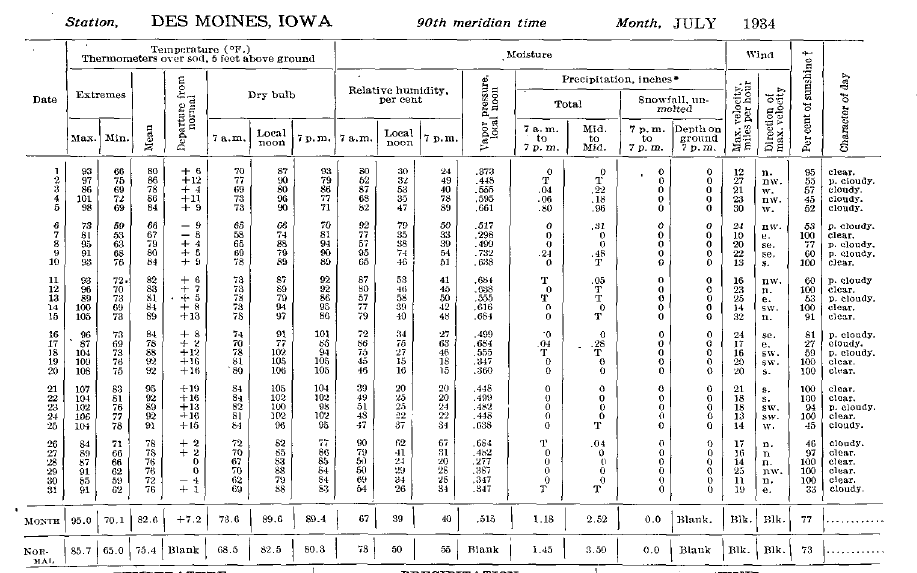
-
Pittsburgh/Western PA Spring 2024
TheClimateChanger replied to Ahoff's topic in Upstate New York/Pennsylvania
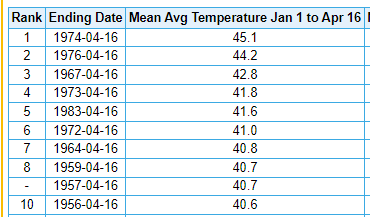
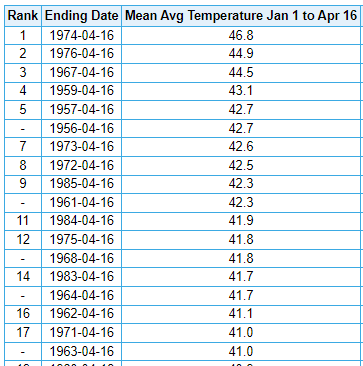
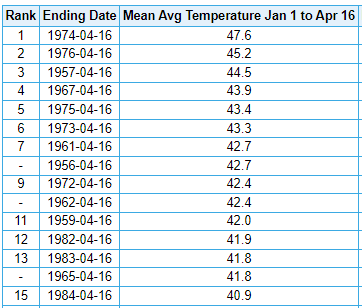
Here are the numbers to beat for a Top 10 warm April. Need to have a final mean temperature at or above 55.3F. KPIT does reasonably well here compared to some other months, with 4 of the current top 10 [1954, 1955, 2010, and the record warmest in 2017].
-
Pittsburgh/Western PA Spring 2024
TheClimateChanger replied to Ahoff's topic in Upstate New York/Pennsylvania
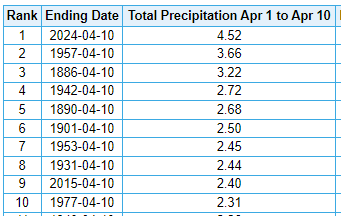
Currently running 4.6F above normal for the month, with a mean temperature of 52.2F. A rather pedestrian [compared to some recent periods] 24th warmest overall in the threaded record, and 13th warmest at KPIT, for the first 10 days of April. With the warm pattern in place, I projected forward through the 17th using the official NWS forecast for KPIT [with an adjustment for tomorrow for a likely midnight high temperature] and found the month to date mean temperature is projected to increase to around 55.9F by April 17th. Should that come to fruition, it would be the 5th warmest April 1 to April 17th period in the threaded record, and second only to 2010 at KPIT. Looks like a decent shot for a top 10 warmest April unless there is a cooldown at the end of the month. -
Occasional Thoughts on Climate Change
TheClimateChanger replied to donsutherland1's topic in Climate Change
So, yes, to answer your question, I do believe the bolded statement to be true and have presented data to support it. But I should add that I was using extreme values of 105F and 110F. It is true there isn't as significant of an upward trend in hours with heat indices at or above 100F, but these are more run-of-the-mill values for Des Moines in the summertime. I will grant you that consecutive days of 100F+ can be just as dangerous, but the statement you quoted is misleading by focusing solely on consecutive stretches rather than total number of days [plus ignoring increase at higher HX values]. It also inaccurately claims that last year ended the longest stretch with no consecutive periods of 5 days or more with 100F+ heat indices at Des Moines. This is false and rebutted by the very data submitted. There are no such stretches indicated between 1936 and 1949, which is a longer period [13 years] than 2012 to 2023 [11 years]. So I would rate Kuball's statement as misleading, and the claim that last year ended the longest stretch with no 5-day plus heat waves [using consecutive days of 100F+ HX] as pants-on-fire false. The very data he submitted shows the longest stretch to have occurred from July 15, 1936 until June 30, 1949 - a period of nearly 13 years. -
Occasional Thoughts on Climate Change
TheClimateChanger replied to donsutherland1's topic in Climate Change
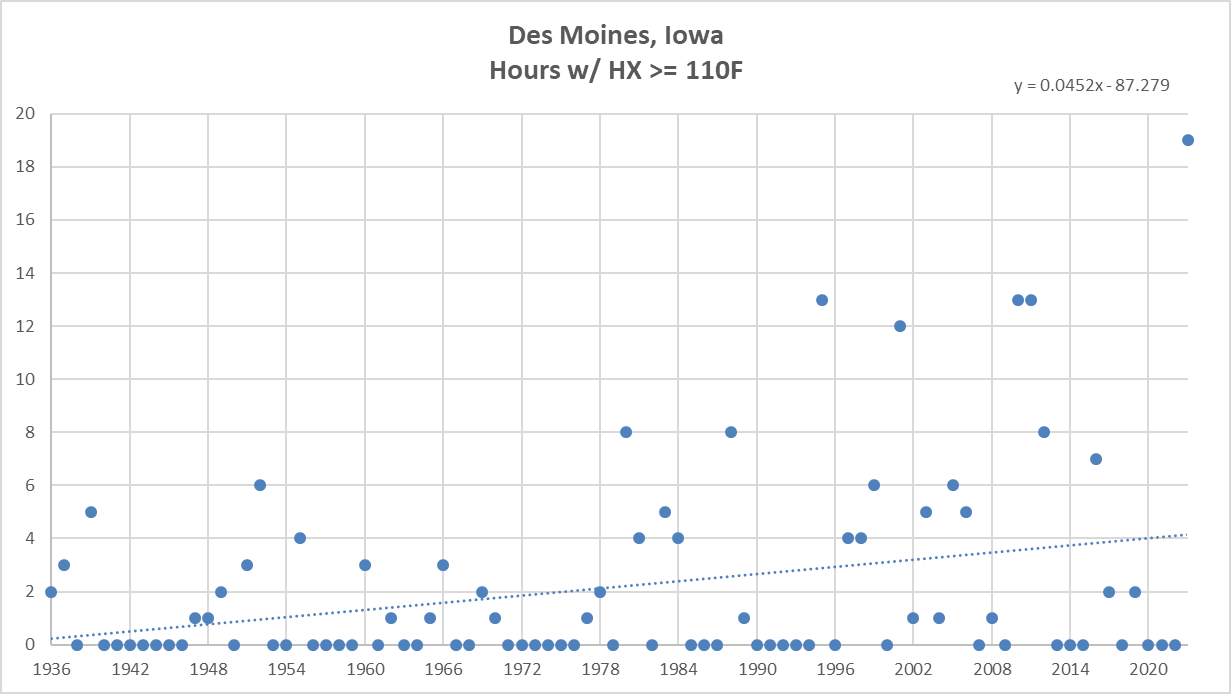
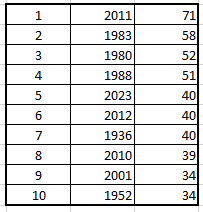
Here is the same data, but with a threshold heat index of 110F [heat warning criteria]. A heat index reading this high was very rare prior to 1980, having not exceeded 6 hours in a year until that year. Since [and inclusive of] 1980, there have been 9 years exceeding 6 hours with heat indices equal to or greater than 110F, and two additional years reaching exactly 6 hours. What happened once in the first 44 years of data has occurred 11 times in the most recent 44 years of data (or 1 out of every 4 years). Years with the most hours of heat indices at or above 110F at Des Moines, Iowa. Note last year was nearly 50% higher than any other year of record dating back to 1936.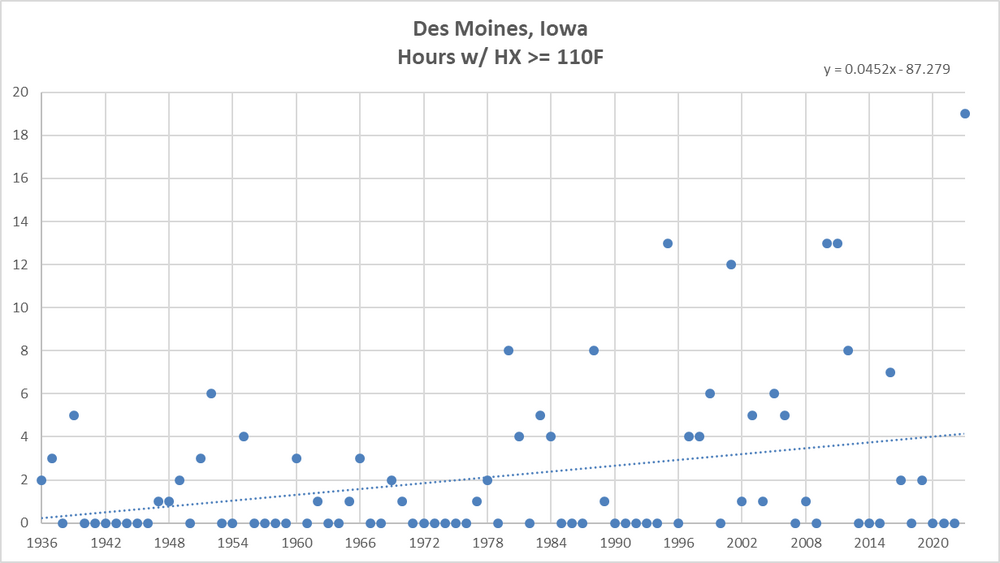
-
Occasional Thoughts on Climate Change
TheClimateChanger replied to donsutherland1's topic in Climate Change
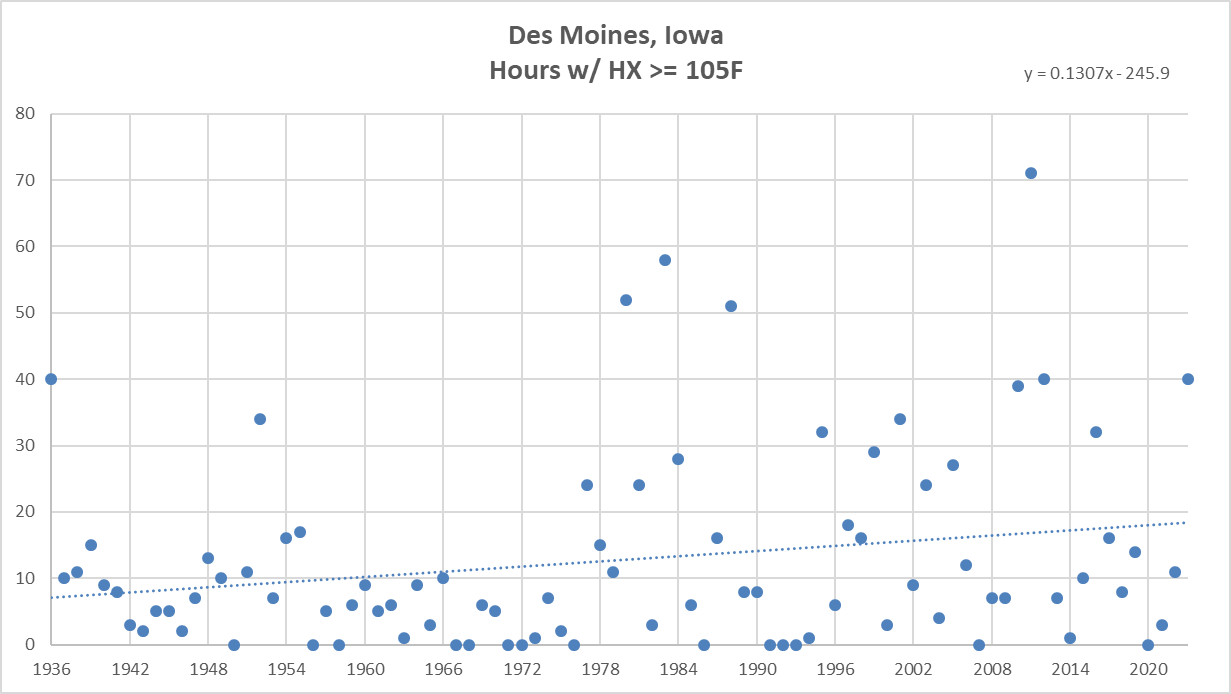
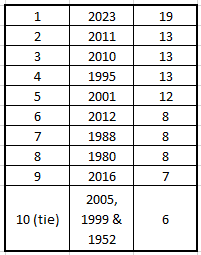
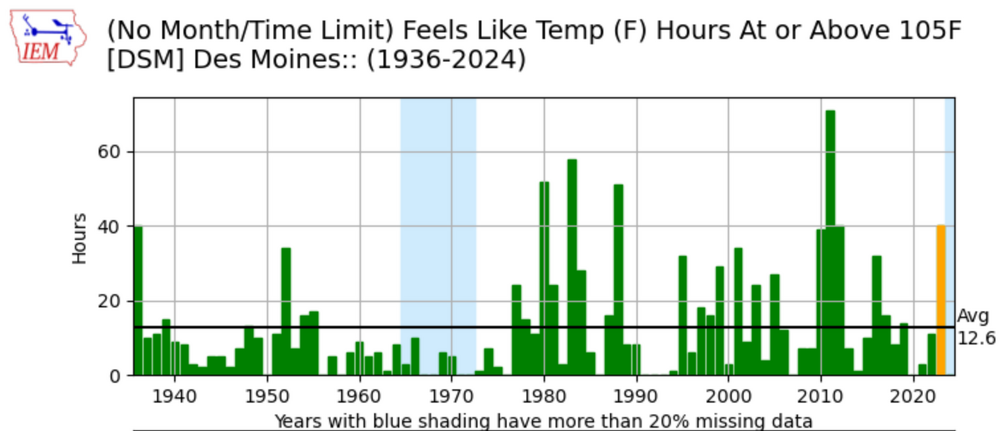
Here's a little more detail on the heat index trends at Des Moines. We can see despite a minimal increase in summertime maxima over the period 1936 to present, the annual hours with a heat index at or above 105F [heat advisory criteria] are increasing at a rate of about 13 hours/year per century on average. For clarification here, the unit of measurement is hours/year - the rate of increase is 0.13 hours/year per year, or 13 hours/year per century. It is true the 1980s are well represented, but five of the top 10 have occurred since 2001.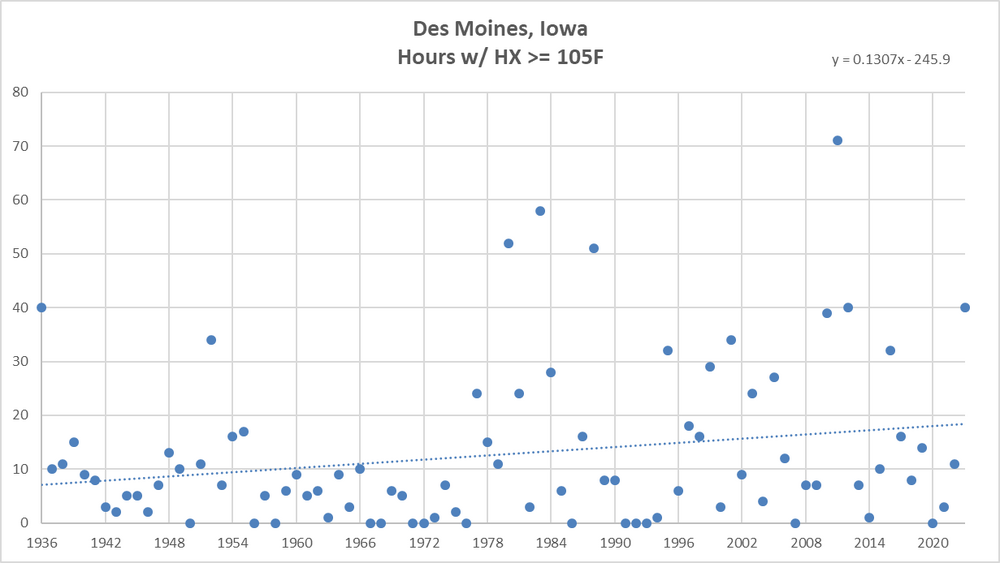
-
Occasional Thoughts on Climate Change
TheClimateChanger replied to donsutherland1's topic in Climate Change
The record for 110F+ heat indices was shattered just last summer, with a clear upward trend. Admittedly, 105F is a bit noisier, although the record was set in 2011. Still a long term increase, even factoring in the spike in the 1980s.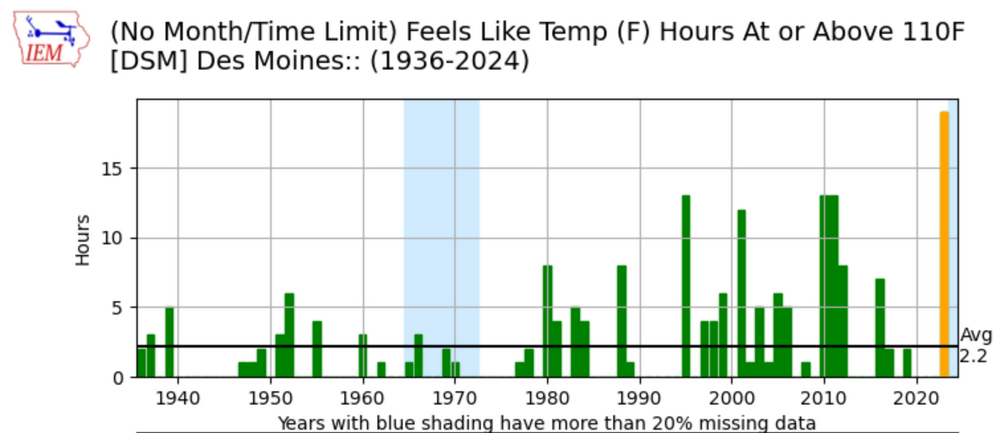
-
Central Pa. Spring 2024
TheClimateChanger replied to mahantango#1's topic in Upstate New York/Pennsylvania
How close to the record? Bradford tied a record of 71F today. DuBois was one degree shy of the record of 76F. -
Occasional Thoughts on Climate Change
TheClimateChanger replied to donsutherland1's topic in Climate Change
The bottom line is this: Even if daytime maxima have decreased slightly in the Corn Belt, humidity has increased substantially moreso. So cooler temperatures should not be read as milder. There has clearly been an increase in the incidence of dangerously high heat indices.