MN Transplant
-
Posts
17,845 -
Joined
-
Last visited
Content Type
Profiles
Blogs
Forums
American Weather
Media Demo
Store
Gallery
Everything posted by MN Transplant
-
I think it is precisely because we are in a relatively wet part of the country and don't get droughts that the dry periods seem so anomalous. Our vegetation is acclimated to regular precipitation and then there are H2O's water supply comments. The concern arises if the dry pattern continues into summer. That's where the evapotranspiration maxes out. And the other problem is that as we go into later summer the chances for organized convection nearly vanish. So, you get only spotty dry relief. I guess I'm saying that this is a notable start to the year and could portend problems down the road, but a few well-placed systems could also bring us right back to normal. So, only a slightly elevated level of concern so far.
-
Yes! You are paying for the sewage charge no matter if your water is going there or not.
-
I never have to water my front yard, but for whatever reason my backyard fescue is really susceptible to dry periods. I tried avoiding watering and not really treating it last fall (new puppy), and it looks absolutely terrible right now. Worst spring in the last 10 years.
-
-
2023 Mid-Atlantic Severe Wx Thread (General Discussion)
MN Transplant replied to Kmlwx's topic in Mid Atlantic
Ha, interesting. I would interpret this as a thin line with dry conditions behind. It does look like DPs in the 20s/30s for Tuesday and Wednesday. -
87s across the board so far including at my house. DPs generally in the low 40s except in Central VA ...CENTRAL VIRGINIA... CITY SKY/WX TMP DP RH WIND PRES REMARKS CULPEPER* SUNNY 86 34 15 SW9G16 29.96F CHARLOTTESVILL SUNNY 86 38 18 VRB5 29.96F WARRENTON* SUNNY 87 25 10 S9G16 29.95F ORANGE* SUNNY 84 39 20 W5G17 29.97F STAFFORD* SUNNY 92 29 10 S3 29.94F FREDERICKSBRG* SUNNY 87 33 14 SW10 29.93F LOUISA* SUNNY 85 37 18 SW10G17 29.97F
-
It is a 100% IMBY game. I conceptually hate using water for lawns/gardens. It is so energy intensive to provide clean drinking water and I’m just going to dump hundreds of gallons on the ground because it won’t rain? Awful.
-
And the coverage tomorrow on the models is not widespread.
-
Enjoying that Stephens City lyfe
-
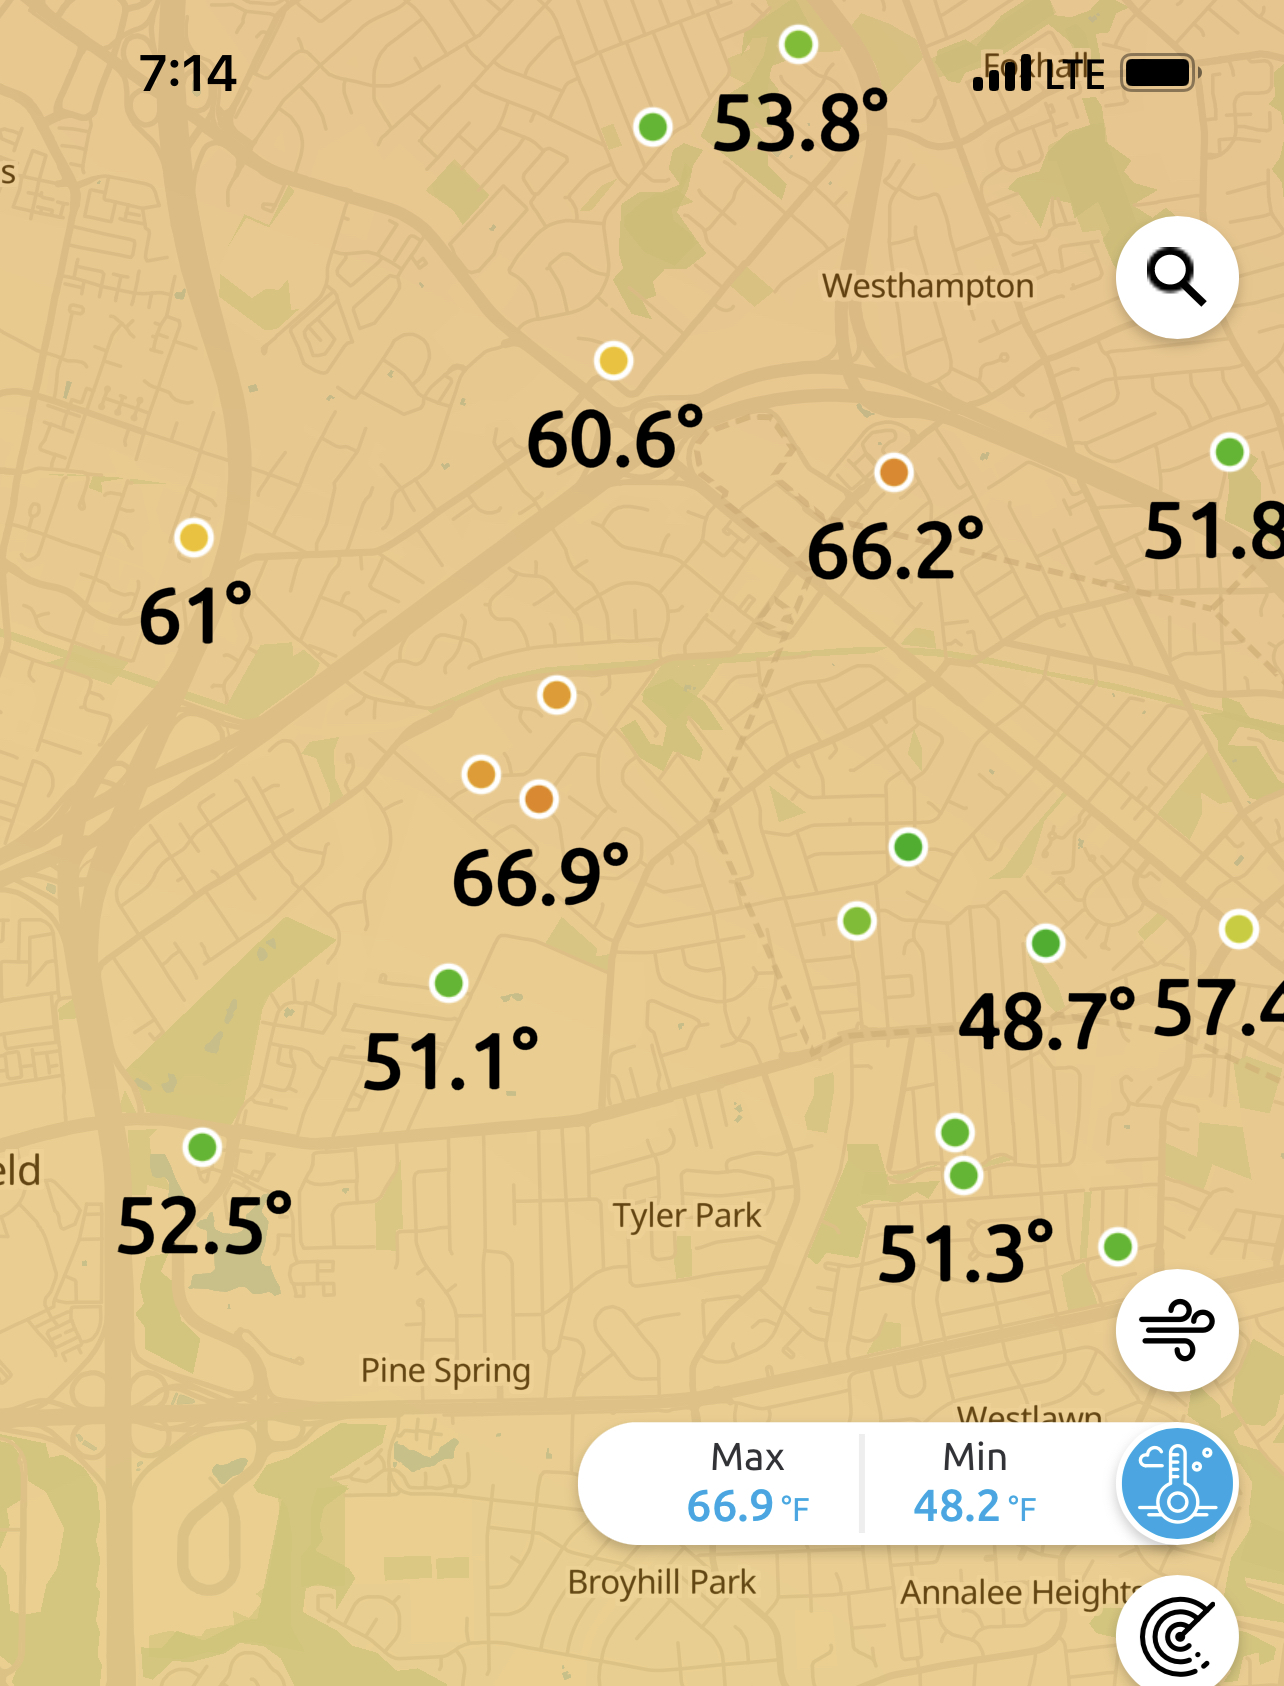
I saw my temp and went to check DCA to see if they were in line for a high min record. Nope, in the 50s even in the urban river.
-
Holy inversion. My low was 60.8. I can feel the temperature dramatically changing on the morning dog walk.

-
This is nuts

-
82.2 and dry
-
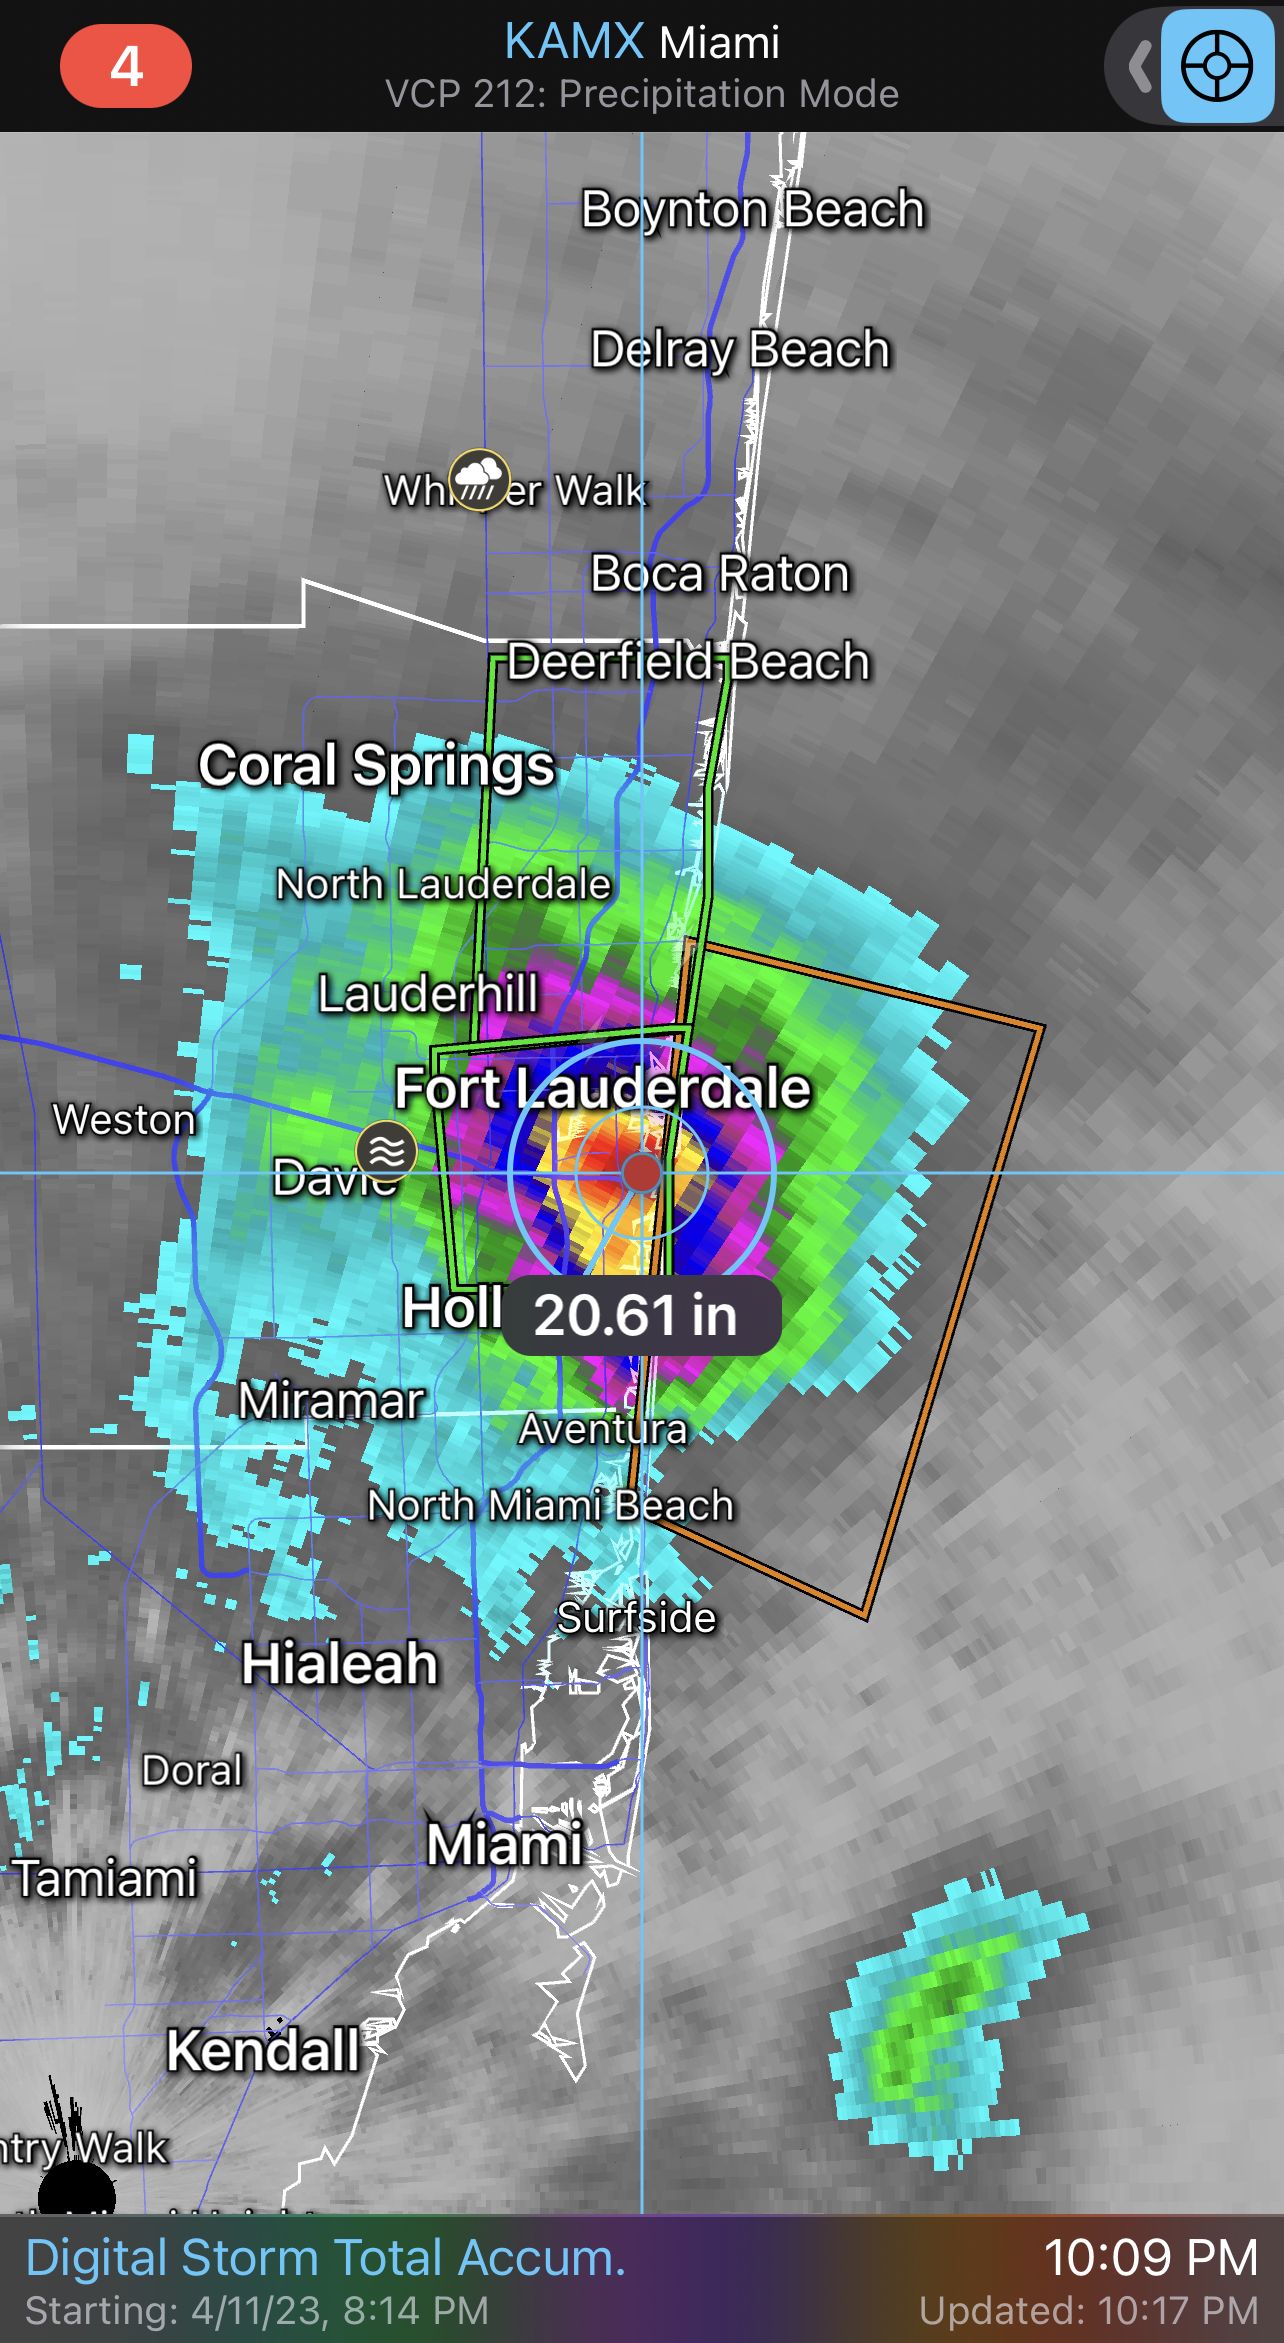
That’s a heck of a day. I got 20 last year and spread it out over a week. Went golfing today and the fairways were very dry. Great roll, though. Drove a 295 yard (downhill) hole. 3 putted of course.
-
38. Not surprised that temps are all over the place with calm conditions. I am surprised that Dulles is relatively warm (37) compared to many other places. DCA at 43 tracks the other urban core temps.
-
Rahm was so steady. Didn’t have to scramble. It seemed like everyone else that had a chance coming into the final round was in trouble all day.
-
36.5
-
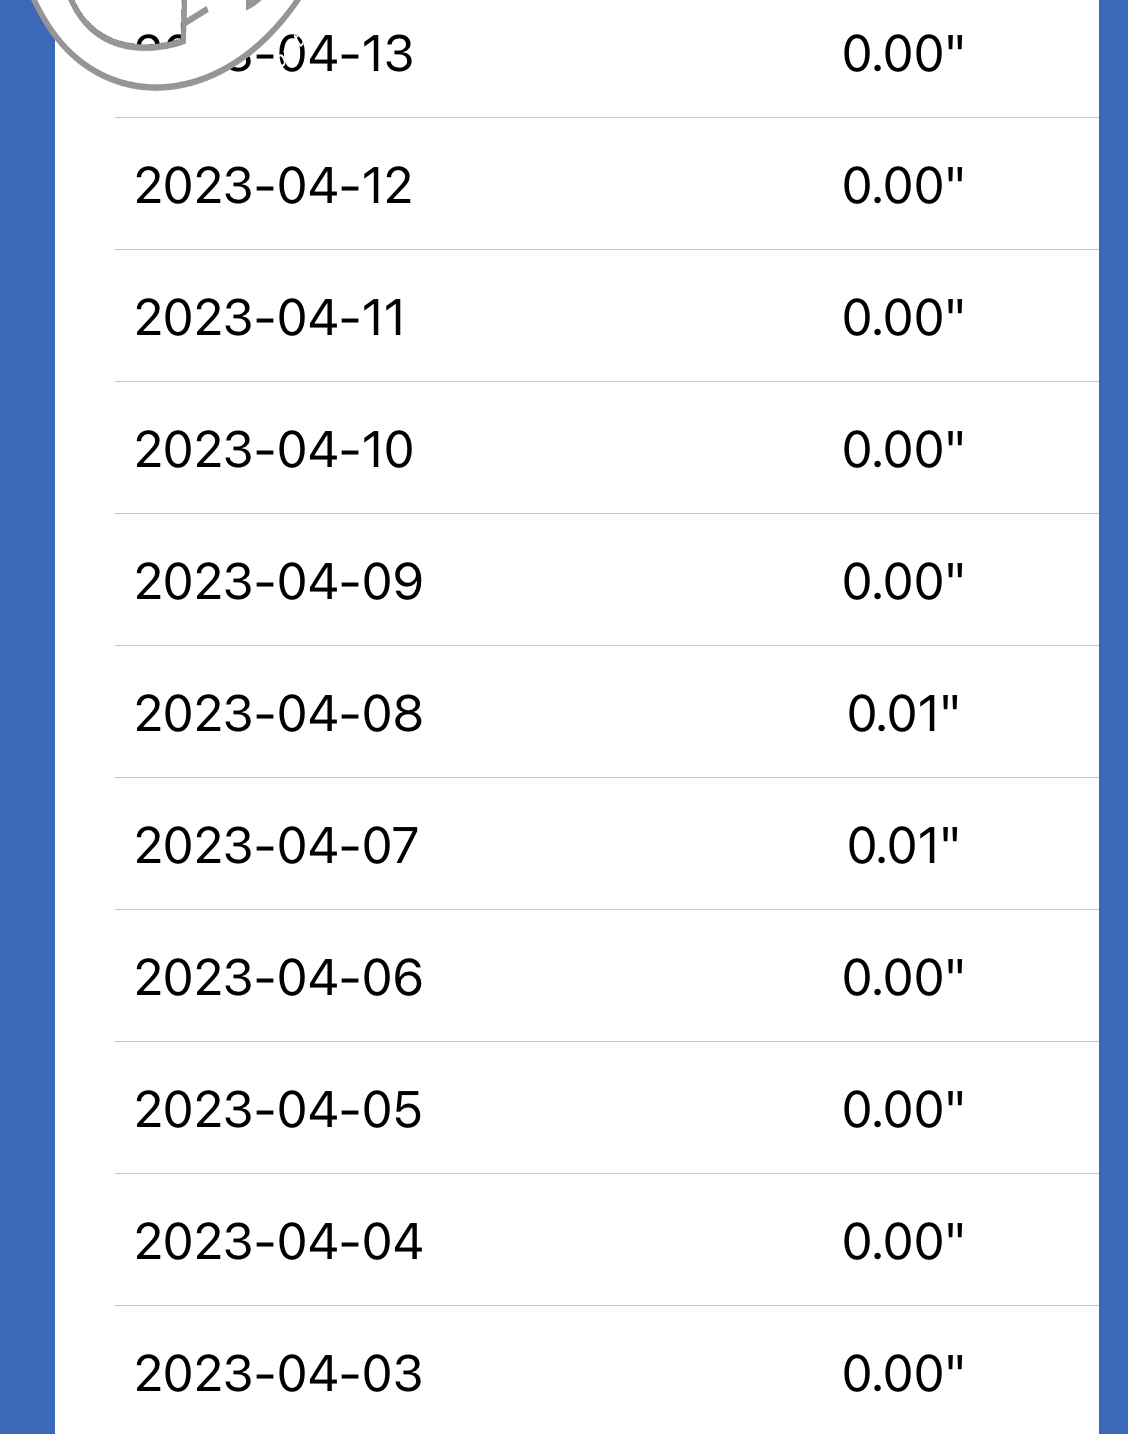
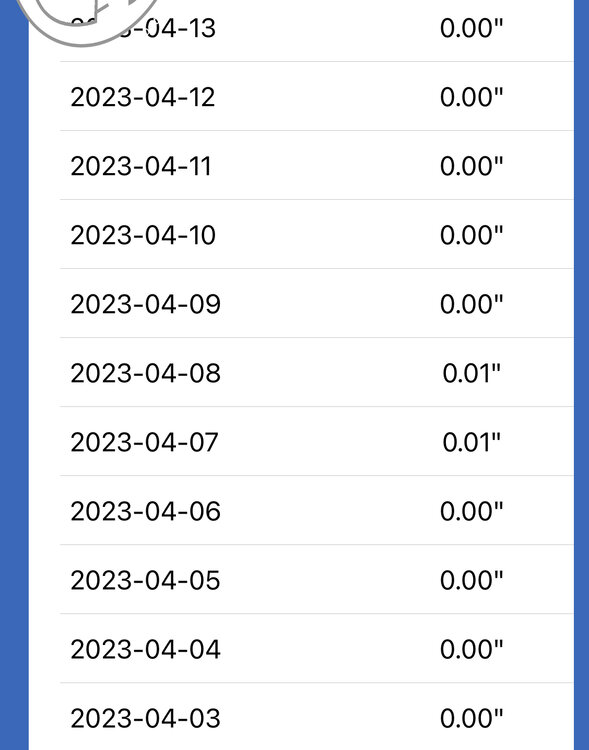
DCA’s Jan-Mar precip totals are the lowest since 2009(!), and 6th lowest in 150 years. In the last century, the lowest Jan-Apr total is 6.99” in 1977. We are sitting at 5.61” with a dry forecast going forward.
-
2023 Mid-Atlantic Severe Wx Thread (General Discussion)
MN Transplant replied to Kmlwx's topic in Mid Atlantic
Whiff here. -
2023 Mid-Atlantic Severe Wx Thread (General Discussion)
MN Transplant replied to Kmlwx's topic in Mid Atlantic
0.01” -
2023 Mid-Atlantic Severe Wx Thread (General Discussion)
MN Transplant replied to Kmlwx's topic in Mid Atlantic
McLean to Bethesda looks pretty good. On the south side of the cell here and I’ll just take some rain. -
2023 Mid-Atlantic Severe Wx Thread (General Discussion)
MN Transplant replied to Kmlwx's topic in Mid Atlantic
Some initiation near Charlottesville and Harrisonburg. -
2023 Mid-Atlantic Severe Wx Thread (General Discussion)
MN Transplant replied to Kmlwx's topic in Mid Atlantic
The Twins did the same thing this year, primarily because it was cold today and they had that built-in day off in the schedule. The Thursday-Saturday-Sunday schedule the first two weeks has some advantages.- 2,785 replies
-
- 1
-

-
- severe
- thunderstorms
- (and 3 more)
-
2023 Mid-Atlantic Severe Wx Thread (General Discussion)
MN Transplant replied to Kmlwx's topic in Mid Atlantic
I got a Fairfax Alert email, so they are on top of it! Gusts to 70 Hail to 1.5”- 2,785 replies
-
- 3
-
-
- severe
- thunderstorms
- (and 3 more)
-
2023 Mid-Atlantic Severe Wx Thread (General Discussion)
MN Transplant replied to Kmlwx's topic in Mid Atlantic
Wish the DPs were a bit higher.