dallen7908
-
Posts
960 -
Joined
-
Last visited
Content Type
Profiles
Blogs
Forums
American Weather
Media Demo
Store
Gallery
Everything posted by dallen7908
-
Is it just me or have the CWG write ups been "dumbed down" since last year?
-
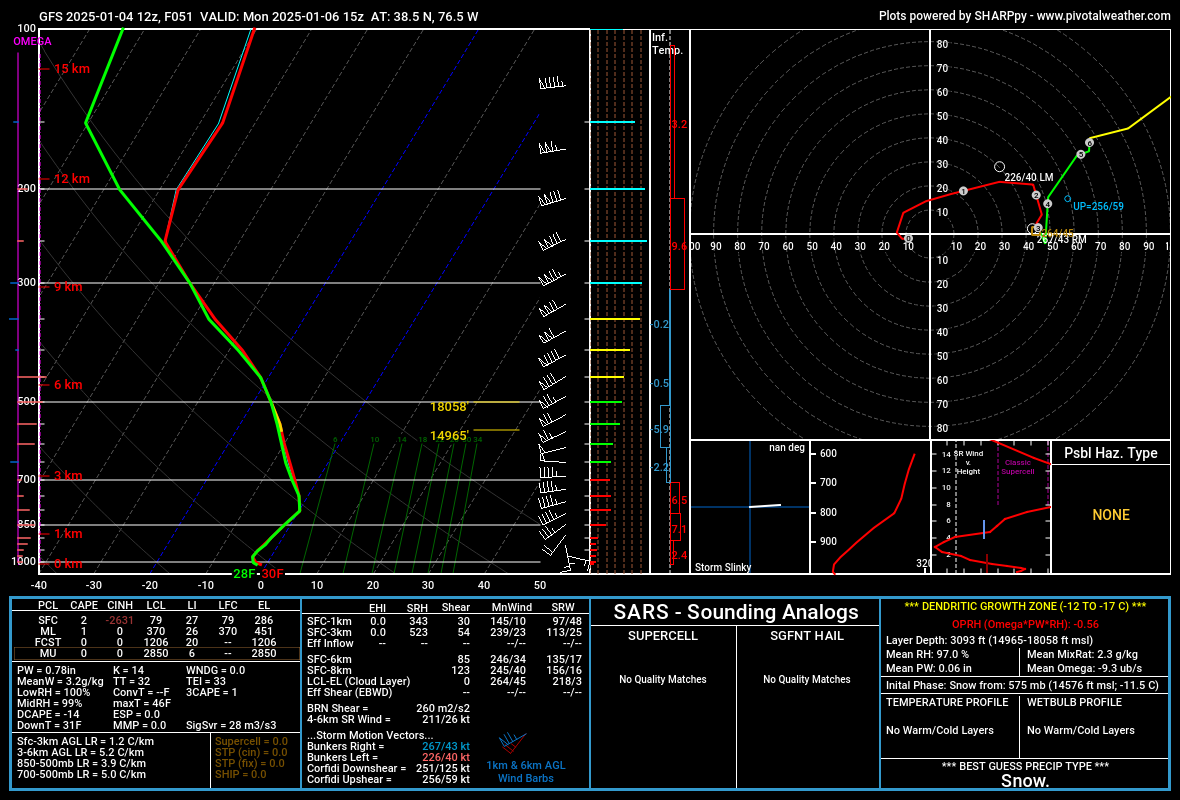
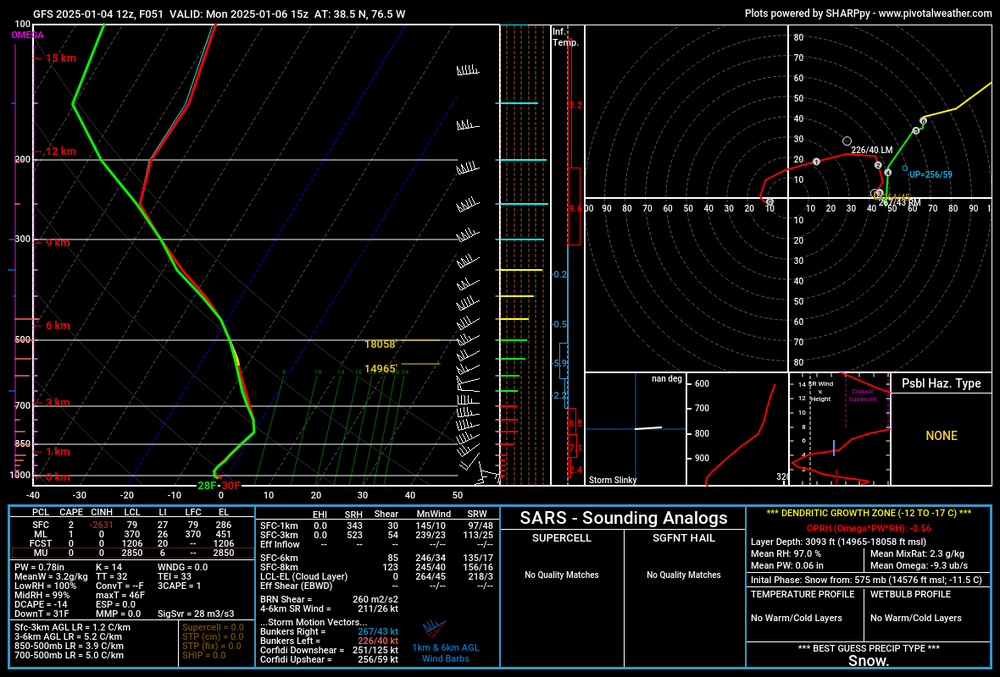
Both the 06 UTC GFS and ECWMF have the snow reaching DC by 11 PM but warm-advection snow often starts an hour or so before forecast. ... but go with the NWS as they look at more information than the above.
-
College Park area also flirting ...
-
Stolen from an add by Startorialist "Cheers to a new year, and a new orbit! This year, earth reached perihelion — our closest approach to the Sun — on January 4th at 8:22:32 AM EST." Wonder how that will affect this weekend's storm!
-
Wow, DC the favored low-land contender - I'm not sure I've seen that before. Is this a bias-adjusted best estimate of the chance or the percent of ensemble members giving 8 or more inches
-
Very dark and flizzardy here. Good time for a walk.
-
January: Medium/ Long Range: May the Force be with Us....
dallen7908 replied to Weather Will's topic in Mid Atlantic
Yes, the anomaly correlation score tells us that the UKMET, GFS, and CMC do a comparable job with the prognostic variables but one could argue that the method of determining the diagnostic variables is more accurate with the GFS. -
January: Medium/ Long Range: May the Force be with Us....
dallen7908 replied to Weather Will's topic in Mid Atlantic
Depending on location, 20-30% of EPS members give MD (west of the Bay and east of the mountains) 3" or more of snow/sleet during the day 10-15 window -
The Slip Sliding Away Christmas Eve Event
dallen7908 replied to Solution Man's topic in Mid Atlantic
Ice pellets here a bit of freezing rain mixing in 29 degrees -
https://www.cpc.ncep.noaa.gov/products/predictions/WK34/ Below normal but dry?
-
We now share the seasonal Maryland Climate Bulletin for fall 2024 You can access the Bulletin from the following link: https://www2.atmos.umd.edu/~climate/Bulletin/bulletin_mdsco_fal24.pdf Points to highlight are: 1) Fall 2024 was warmer and drier than normal (i.e., 1991-2020 averages) in Maryland (statewide), with warmer and drier than normal September, October, and November. Seasonally, the state has remained warmer than normal since the fall of 2023 and drier than normal since last summer. 2) The mean temperature was warmer than normal everywhere in the state, particularly over Garrett County (up to 2.8°F), and Prince George’s, Anne Arundel, Charles, Calvert, Saint Mary’s, Kent, Queen Anne’s, Talbot, and western Dorchester counties (2.0‒2.4°F). Precipitation was below normal over the whole state, particularly over Cecil County and portions of Harford, Kent, Queen Anne’s, and Wicomico counties (8 inches deficit), and counties of the Coastal Plains on both sides of the Bay (6−7 inches deficit). The regions with maximum deficit had around 25−30% of their climatological fall precipitation, while those on both sides of the Bay received no more than 50%. Western Maryland over Allegany and Garrett counties received 55‒85% of their climatological precipitation. 3) The partial water year 2025 (October − November 2024) started below normal over the entire state, especially over eastern Wicomico and northern Worcester counties (5.5 inches deficit), northern Harford and Cecil counties (5 inches deficit), and counties of the Piedmont and Coastal Plains (4‒4.5 inches deficit). Among these regions, the southern Eastern Shore had 25‒30% of their climatological water amount, and the rest had between 35 and 40% of theirs. 4) Mean temperatures showed that fall 2024 was the eleventh warmest fall statewide and among the ten warmest in 14 counties. It was the fifth warmest fall for Calvert, Charles, Garrett, Prince George’s, and Saint Mary’s counties. 5) Precipitation indicated that fall 2024 was the sixth driest fall statewide and among the ten driest for 17 counties. It was the fifth driest fall for Washington County, the fourth for Dorchester and Harford counties, the third driest for Somerset, Wicomico, and Worcester, the second driest for Caroline and Queen Anne’s counties, and the driest for Cecil and Kent counties.
-
I believe you're thinking of Christmas Eve 2022 when the high was 20 but it felt much colder. The last Arctic outbreak I can remember was January 5 and 6th of 2018 when the high temperature failed to reach 20 in Baltimore. The last day with a sub-10 high was January 19 of 1994 when the high was 5. The lowest high ever (3 F) occurred on February 10, 1899 during "the greatest Arctic outbreak in history" according to David Ludlum. Temperatures fell to 0 F along the beaches of the Gulf Coast and ice flowed from the mouth of the Mississippi River into the Gulf ...
-
Here is November's climate bulletin from Alfredo. Will December be our first below-normal temperature month in over a year? Good afternoon, We now share the Maryland Climate Bulletin for November 2024. You can access the November Bulletin from the following link: https://www2.atmos.umd.edu/~climate/Bulletin/bulletin_mdsco_current.pdf Points to highlight are: 1) Statewide averages show this month was warmer and drier than normal again. This is the twelfth consecutive month with warmer-than-normal temperatures and the seventh month drier than normal since April.2) Regionally speaking, the mean temperature was warmer than normal over all the state, especially over Prince George’s, western Charles, southern Anne Arundel, northern Calvert, and western Talbot counties (4.8°F), and in general over the counties to the west of the Bay and central Eastern Shore and Garrett County (above 3.9°F). Precipitation was below normal in much of the state, especially over Frederick, Washington, eastern Allegany, eastern Caroline, Dorchester, Wicomico, and northern Worcester counties (1.4 to 1.6 inches deficit). These counties received between 45 and 55% of their climatological rainfall for the month, while the rest of the counties around the Bay didn’t get more than 60−70% of their climatological rainfall. Above-normal precipitation was observed over Garrett County only (1.2 inches maximum), accounting for 10−40% more than its climatological precipitation. 3) Drought conditions covered the whole state at the end of November. While extreme drought conditions over Garrett County at the end of October changed to severe, extreme drought conditions appeared over southern Cecil, eastern Kent, Queen Anne’s, the northern tip of Caroline, Wicomico, eastern Somerset, and western Worcester counties. Moderate to severe drought conditions covered around 91% of the state. Streams and rivers had below-normal streamflow in the severe to extreme drought areas along both sides of the Bay; above-normal streamflow was observed only over Garrett County streams. 4) Statewide minimum daily temperatures indicated that the number of freezing days with temperatures below 32, 28, and 24°F and their number of freezing spells (consecutive days with freezing days) were fewer than normal by the end of November for the calendar year. Most of the freezing days are found in January, February, and March, though. 5) Statewide daily total precipitation showed that the number of dry spells (consecutive days with daily precipitation of no more than 0.04 inches) was less than normal by 10 dry spells (34 vs. 44) by the end of the month. However, the mean duration of the dry spells was larger than normal by 1 day (6 vs. 5), and the longest duration of the spells was larger than normal by 17 days (34 vs. 17); the longest dry spell started October 8. 6) Statewide mean, maximum, and minimum temperatures in November (50.2, 60.8, 39.5°F) were above their long-term (1895-2023) mean but far from their historical records of 51.7, 63.1, and 43.6°F set in 1985, 2001 and 1985, respectively. However, the three temperatures were within 10% of the highest recorded values. Statewide precipitation (2.08 inches) was below the long-term mean but far from the record of 0.60 inches in 1917. 7) Statewide mean temperatures and precipitation indicated that November was the eighth hottest month on record, and it was among the ten hottest for 14 counties; this month was the forty-fourth driest statewide. This month was the fifth hottest for Charles County, the fourth for Talbot County, the third for Anne Arundel, Calvert, and Saint Mary’s counties, and the second hottest for Prince George’s County. The bulletin is issued once per month and shows the state's recent monthly surface temperature and precipitation conditions in a simple format, helping Marylanders better understand regional climate variations. Please help disseminate this bulletin. Thanks, Alfredo
-
Obviously, you're kidding but although the phase speed is slowing due to interference from La Niña conditions the magic land of phase 7 is still expected to be reached in early January according to the NOAA CPC Weekly MJO Update that was posted here yesterday by Eskimo Joe and hinted at by WxUSA and with it chances of measurable snow. Hopefully, we'll luck into something before then.

-
As many of you know, on Friday afternoon the CPC puts out their 3 to 4 week outlook. Some hope for a return to winter cold although the EPS holds onto the warmth for at least another week. ... and if you (like me) spend as much time following New England weather than ours these days, you may be disappointed. This pattern is a fairly substantial change from the Week-2 guidance and is suggestive of mean enhanced southerly flow into Alaska and a potential for northerly flow into the central and eastern CONUS. This pattern increases the potential for cold air outbreaks; however, with a strengthened polar vortex feature, a positive AO signal, and a warm pattern antecedent to the Weeks 3 and 4 period, there may not be significant reservoirs of cold air in place to invade the Lower 48. Across the East, equal chances are maintained for most regions due to the considerable uncertainty, with the ECMWF maintaining a warmer pattern in the absence of stronger MJO forcing, while the GEFS favors a transition to a colder pattern by Week-4. Mean enhanced southerly flow over New England favors above-average temperatures. https://www.cpc.ncep.noaa.gov/products/predictions/WK34/
-
EPS support is lacking for substantial snow next week.
-
Certainly the weather discussions have become more interesting since Garrett County was added to Stirling's coverage area. Kidding aside, outside of 6 days anything is possible - and phrases such as potent trough and negatively-tilted are music to most of our ears.
-
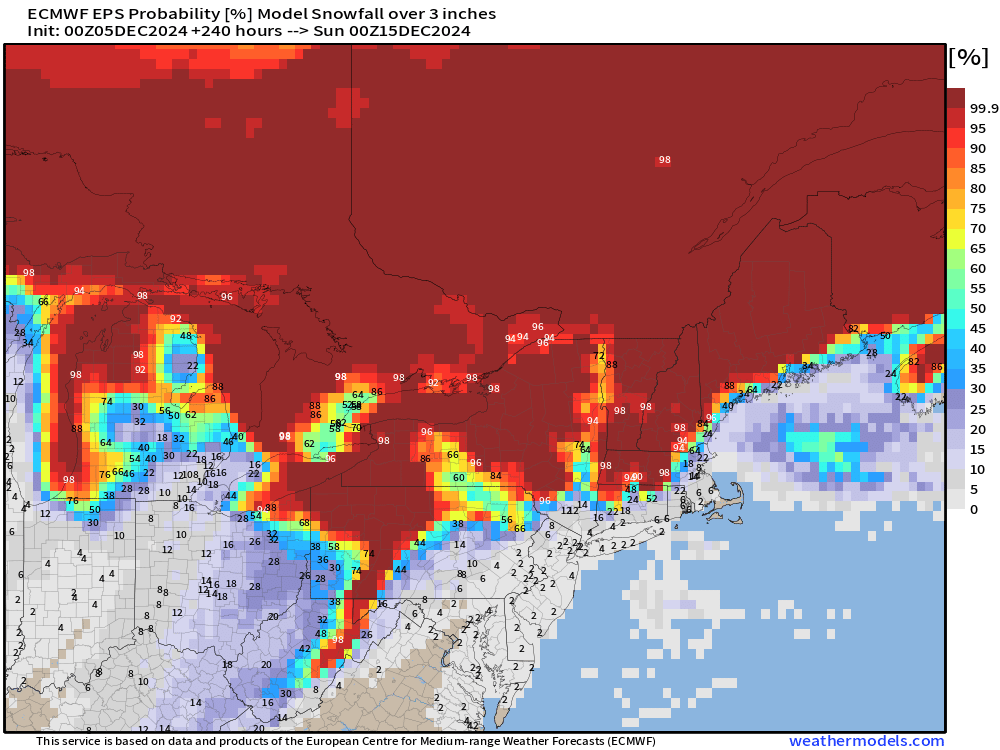
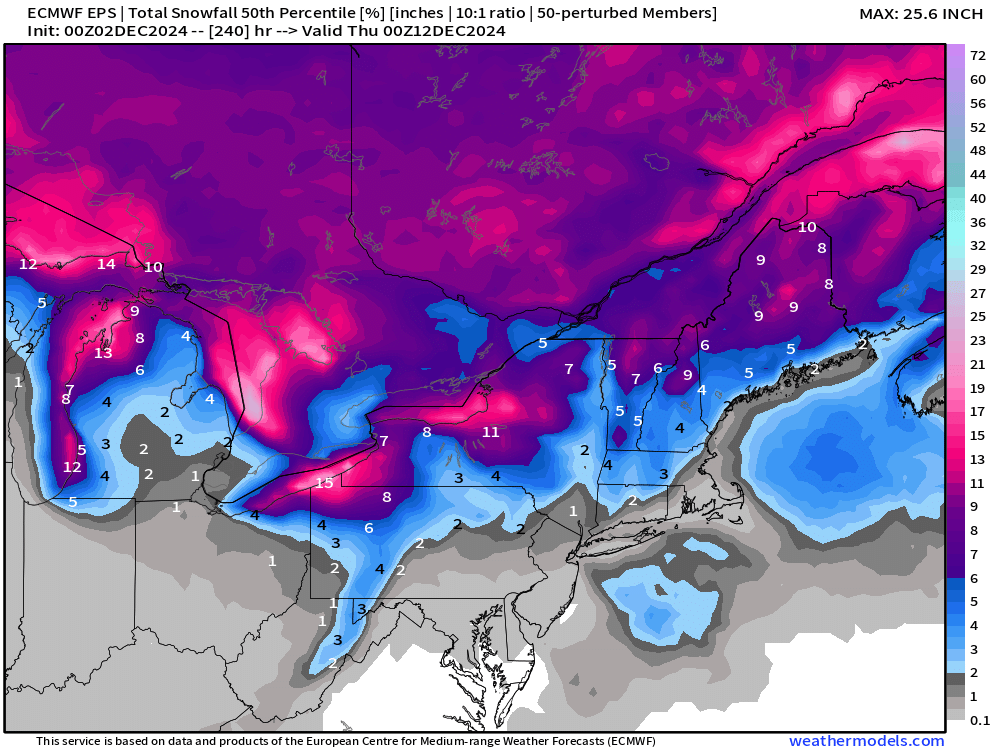
EPS 50th PCTL snow accumulation (10:1) over the next 10-days. Potentially good news or perhaps climatology for those tracking destinations in upstate NY and northern New England. As in most years, we have to wait a bit longer here. The average date of the first measurable snow (1991-2020) where most of us live ranges from December 16 (Baltimore) to December 22 (DC).
-
I'm sharing the MD Climate Bulletin disseminated by MD State Climatologist Alfredo Ruiz-Barradas You can access the October Bulletin from the following link: https://www2.atmos.umd.edu/~climate/Bulletin/bulletin_mdsco_current.pdf Points to highlight are: 1) Statewide averages show this month was warmer and drier than normal after a warmer and drier than normal September. This is the eleventh consecutive month with warmer-than-normal temperatures and the sixth month drier than normal since April.2) Regionally speaking, the mean temperature was warmer than normal over nearly all the state, particularly over the southern Charles, Saint Mary's, and southern Calvert counties (above 2.1°F) and portions of Montgomery, Prince George's, Howard, Frederick, Carroll, and Baltimore counties (1.5‒1.8°F). Slightly colder than normal conditions appeared over northern Anne Arundel County. Precipitation was below normal in the entire state, especially over Baltimore, Harford, and Cecil counties, southern Saint Mary's, and Calvert counties, and Caroline, Dorchester, Wicomico, Somerset, and Worcester counties (3.6 to 3.9 inches deficit). These counties, the whole Eastern Shore, and western Montgomery County received just 10% of their climatological rainfall for the month; the rest of the Piedmont and most of the Upper Coastal Plain received not more than 20% of their climatological rainfall. Counties in western Maryland had between 50 and 70% of their climatological precipitation. 3) The extension of the state under drought conditions covered 87% of the state at the end of October, a 6% increase with respect to September. Extreme drought conditions remained in the southern half of Garrett County, and moderate to severe drought conditions developed over the Coastal Plains and Harford and Cecil counties. The creeks and rivers in these regions had below-normal and much below-normal streamflow. Moderate drought conditions remained in portions of Allegany and Washington counties. Counties in the central and western Piedmont had normal to abnormally dry conditions with still normal streamflow in their streams and rivers. 4) Statewide maximum and minimum daily temperatures indicated that the number of days with extreme temperatures was larger than normal, although not the number of waves/spells by the end of October. There were 2 more hot days (maximum temperature warmer than 86°F; 50 vs. 48) than normal but 2 fewer heat waves (2 vs. 9); 12 more warm days (maximum temperature warmer than 80°F; 113 vs. 101) than normal but 2 fewer warm day spells (9 vs. 11); and 13 more warm nights (minimum temperature warmer than 68°F; 40 vs. 27) than normal but the same number of warm night spells (6). 5) Statewide daily total precipitation showed that the number of dry spells (consecutive days with daily precipitation of no more than 0.04 inches) was less than normal by 9 dry spells (31 vs. 40) by the end of the month. However, the mean duration of the dry spells was larger than normal by 2 days (6 vs. 4), and the longest duration of the spells was larger than normal by 8 days (24 vs. 16); the longest dry spell started October 8. 6) Statewide mean, maximum, and minimum temperatures in October (58.3, 71.0, 45.5°F) were above their long-term (1895-2023) mean but far from their historical records of 63.3, 74.4, and 53.8°F set in 2007, 2007 and 2021, respectively. However, the maximum temperature was within 10% of the highest recorded values. Statewide precipitation (0.53 inches) was below the long-term mean within 5% of the smallest values and close to the record of 0.15 inches in 1963. 7) Precipitation indicated that October was among the sixth driest for 19 of the 23 counties and the fourth driest statewide. This month was the driest since 1895 for Dorchester, Wicomico, and Worcester counties. The bulletin is issued once per month and shows the state's recent monthly surface temperature and precipitation conditions in a simple format, helping Marylanders better understand regional climate variations. Please help disseminate this bulletin. Thanks, Alfredo -- ............................................. Alfredo Ruiz-Barradas, PhD Associate Research Professor Maryland State ClimatologistDepartment of Atmospheric and Oceanic Science
-
"This upgrade substantially improves 2 m temperature and 10 m wind speeds, particularly for the winter months in the northern hemisphere. The largest impacts on 2 m temperature forecasts are for the winter months in the northern hemisphere, where the Continuous Ranked Probability Score (CRPS) is improved by 11% at day 1 and 2% at day 10. These improvements reflect the combined impact of many contributions, including the assimilation of 2 m temperature observation data, upgrades to 4D-Var and land-surface data assimilation methodology, and improvements to the IFS land surface model (Ingleby et al., 2024)."
-
If anyone is bored, there is a storm to track along the Brooks Range ... From the weather discussion, it looks like the NAM is the outlier. "Snow will be moving into the area Friday morning and continue through Sunday morning before tapering off to light snow and flurries. The snow may be heavy at times, including along the Dalton Highway. Temperatures will be chilly, with highs in the 20s and low 30s as well as lows in the teens."
-
Good morning, From Alfredo Ruiz-Barradas - state climatologist With apologies for the delay, we now share the Maryland Climate Bulletin for April 2024. You can access it from the following link: https://www2.atmos.umd.edu/~climate/Bulletin/bulletin_mdsco_current.pdf Points to highlight are: 1) Statewide averages show this month was warmer and drier than normal. This is the fifth consecutive month with temperatures warmer than normal. 2) Regionally speaking, mean temperatures were warmer than normal everywhere, especially in Garrett County (around 4.2°F) and portions of Montgomery and Frederick counties (around 3.3°F). Precipitation was above normal over the state's northern counties, particularly Garrett County (2.5 inches) and parts of Harford, Cecil, and Kent counties (around 1.5 inches). Below-normal precipitation was found over the rest of the state, especially over parts of Caroline, Dorchester, Wicomico, Somerset, and Worcester counties (2 inches deficit) that received around forty percent of their climatological precipitation. 3) Drought conditions were absent again, and above-normal streamflow was present throughout the state at the end of April 2024. 4) Mean temperatures showed significant warming trends (1895-2024) everywhere in the state; the larger trends are found over the northern-central counties, with a maximum over Baltimore City (4.0°F/century). Precipitation displayed significant wetting trends only over Garrett and Allegany counties (0.6 in/century). 5) Mean, maximum, and minimum statewide temperatures in April 2024 (56.6, 67.2, and 46.0°F) were above the long-term averages, but only the mean and minimum temperatures were among the 10% of the highest values (1895-2023). On the other hand, statewide precipitation (3.23 in) was below the long-term average. Temperatures and precipitation were far from their historical records. 6) April 2024 was the fourth warmest April in Garrett County, the seventh warmest in Howard and Montgomery counties, the eighth warmest in Frederick, and the ninth warmest in Anne Arundel and Prince George’s counties. It was also the fifth driest April in Wicomico County, the seventh driest in Somerset and Worcester counties, and the eighth in Dorchester County. 7) Minimum temperatures in April 2024 in the counties and Baltimore City were closer to their warmest temperatures on record than the maximum temperatures were. The bulletin is issued once per month and shows the state's recent monthly surface temperature and precipitation conditions in a simple format, helping Marylanders better understand regional climate variations. Please help disseminate this bulletin. Thanks, Alfredo
-
https://www2.atmos.umd.edu/~climate/Bulletin/bulletin_mdsco_current.pdf Points to highlight are: 1) Statewide averages show this month was warmer and wetter than normal. This is the fourth consecutive month with temperatures warmer than normal. 2) Regionally speaking, mean temperatures were warmer than normal everywhere, especially in Garrett County (around 6.0°F) and portions of Montgomery and Frederick counties (around 5.2°F). Precipitation was above normal almost everywhere, especially in the southeastern counties of Wicomico, Somerset, and Worcester counties (above 4 in), which received 190-200% of their climatological precipitation. 3) Drought conditions were absent again, and above-normal streamflow was present throughout the state at the end of March 2024. 4) Mean temperatures showed significant warming trends (1895-2024) everywhere in the state except Garrett and Allegany counties; the larger trends are found over the northern-central counties, with a maximum over Baltimore City (3.0°F/century). Precipitation displayed non-significant trends, with the largest wetting and drying trends occurring in Baltimore and Garrett counties. 5) Mean, maximum, and minimum statewide temperatures in March 2024 (48.2, 58.6, and 37.7°F) were above the long-term averages and among the 10% of the highest values (1895-2023). Statewide precipitation in this month (5.67 in) was also above the long-term average and within the10% of the highest values. 6) March 2024 was the second wettest March on record in Somerset, Wicomico, and Worcester counties, the fourth wettest in Caroline and Dorchester counties, and the fifth wettest in Calvert and Saint Mary’s counties. 7) So far this year, statewide minimum temperatures indicate the state has had 4 fewer freezing days (daily minimum temperature less than or equal to 32°F) than the climatology (61 days for the period 1991-2020). The bulletin is issued once per month and shows the state's recent monthly surface temperature and precipitation conditions in a simple format, helping Marylanders better understand regional climate variations. Please help disseminate this bulletin. Thanks, Alfredo Ruiz-Barradas, PhD Associate Research Professor Maryland State Climatologist
-
April 8th Eclipse- Last Easy One To See In My Lifetime
dallen7908 replied to Interstate's topic in Mid Atlantic
I'm taking the Jebman's advice and getting out of Texas tomorrow - hoping to view the eclipse in a cirrus-filled sky at Fenley Farms in Valliant, Oklahoma - near Broken Bow. -
April 8th Eclipse- Last Easy One To See In My Lifetime
dallen7908 replied to Interstate's topic in Mid Atlantic
I'm heading to Dallas too but sans car and hoping for the best. If you find me hiding under an umbrella at the Cotton Bowl - I'll never admit that I have 3 degrees in meteorology.