dallen7908
-
Posts
960 -
Joined
-
Last visited
Content Type
Profiles
Blogs
Forums
American Weather
Media Demo
Store
Gallery
Everything posted by dallen7908
-
No and Maybe. The high temperatures in the Baltimore area on the week preceding the event were 55, 47, 55, 60, 56, 56, & 47. The high on the day of the storm was 36. The high temperatures during the following days were 54,49,54,65,73,70,83,87,86,73,54,43
-
Kind of cool that the Terrapin men's BB team is only 12 wins away from the national championship and already know their next 3 opponents.
-
I saw my first blooming crocuses yesterday. Daffodils have been poking out for 2ish days but no blooms yet.
-
Today was the day my front yard was eliminated from the last snow pile in the neighborhood contest. Next year I’ll make sure the snow plow leaves the snow on the shady side of my yard
-
Warmer as in multiple days in the 50s - may or may not make it to 60.
-
Date, MaxTemperature, MinTemperature, AvgTemperature, Precipitation, Snowfall, SnowDepth 1994-01-15, 18, 6, 12.0, 0.00, 0.0, 0 1994-01-16, 19, 4, 11.5, 0.00, 0.0, 0 1994-01-17, 35, 16, 25.5, 1.09, 0.7, 0 1994-01-18, 35, 2, 18.5, T, T, 1 1994-01-19, 8, -4, 2.0, T, T, 1 1994-01-20, 18, 8, 13.0, 0.09, 1.9, 2 1994-01-21, 25, 3, 14.0, 0.00, 0.0, 2
-
Through January, Baltimore has experienced a 75th PCTL winter (B- grade; 34th out of 133 winters) with 28 winter days (Mean T of 32 or lower), 13.7 inches of snow, and 11 days with an inch or more of snow on the ground. Baltimore also got a 6.3 point "MECS" boost for the 11.3 inches they recorded in late January. DC hasn't fared as well but their totals (19 winter days, 8.5" of snow, 1.9 point MECs bonus, and 7 days with an inch on the ground) still rank in the 55th PCTL (61st out of 133 winters, C- grade) In case you're wondering about the best early winter: https://www.usni.org/magazines/proceedings/1924/august/breaking-ice-baltimore-harbor-war-measure-winter-1917-1918 baltimore Rank YEAR T<=32 Snow MECSb D>1" Points Grade PCTL 1 1917-1918 47.0 32.5 6.0 27.0 112.5 A++ 100 2 1904-1905 39.0 35.1 5.4 31.0 110.5 A++ 99 3 1960-1961 38.0 30.1 7.0 32.0 107.1 A++ 98 4 1903-1904 48.0 21.4 1.0 27.0 97.4 A+ 98 5 1921-1922 22.0 40.1 19.5 14.0 95.6 A 97 6 1995-1996 29.0 35.9 13.5 15.0 93.4 A 96 7 1924-1925 25.0 23.0 6.0 30.0 84.0 A- 95 8 2009-2010 29.0 27.0 12.0 13.0 81.0 A- 95 9 1939-1940 32.0 16.5 1.0 30.0 79.5 B+ 94 10 1976-1977 46.0 11.1 0.0 19.0 76.1 B+ 93 11 1909-1910 27.0 25.5 5.2 18.0 75.7 B+ 92 12 2015-2016 15.0 30.0 20.5 10.0 75.5 B+ 92 13 1944-1945 29.0 14.4 2.0 30.0 75.4 B+ 91 14 1981-1982 35.0 17.2 1.1 21.0 74.3 B+ 90 15 1962-1963 34.0 15.7 0.0 24.0 73.7 B+ 89 16 1963-1964 29.0 20.0 5.8 18.0 72.8 B+ 89 17 1929-1930 29.0 19.4 4.0 20.0 72.4 B+ 88 18 2002-2003 36.0 15.0 2.4 15.0 68.4 B 87 19 1999-2000 21.0 23.3 10.6 12.0 66.9 B 86 20 1934-1935 22.0 21.3 7.5 15.0 65.8 B 86 Rank YEAR T<=32 Snow MECSb D>1" Points Grade PCTL 21 1989-1990 27.0 14.5 0.0 24.0 65.5 B 85 22 1910-1911 26.0 17.8 2.5 19.0 65.3 B 84 23 1938-1939 20.0 18.6 3.6 23.0 65.2 B 83 24 1969-1970 33.0 15.1 1.1 15.0 64.2 B 83 25 2003-2004 30.0 18.0 0.0 16.0 64.0 B 82 26 1967-1968 31.0 15.5 3.4 13.0 62.9 B- 81 27 1987-1988 22.0 20.2 2.5 18.0 62.7 B- 80 28 1935-1936 26.0 15.3 0.0 21.0 62.3 B- 80 29 2010-2011 37.0 11.9 2.6 10.0 61.5 B- 79 30 1955-1956 37.0 9.9 0.0 14.0 60.9 B- 78 31 1966-1967 22.0 20.8 6.0 12.0 60.8 B- 77 32 1945-1946 23.0 15.0 2.6 20.0 60.6 B- 77 33 1965-1966 27.0 21.4 6.0 6.0 60.4 B- 76 34 2025-2026 28.0 13.7 6.3 11.0 59.0 B- 75 35 1986-1987 16.0 25.1 8.4 9.0 58.5 B- 74 36 1977-1978 34.0 13.5 0.0 11.0 58.5 B- 74 37 1911-1912 25.0 14.4 0.0 18.0 57.4 B- 73 38 1919-1920 34.0 7.2 0.0 16.0 57.2 B- 72 39 2013-2014 31.0 12.7 0.1 13.0 56.8 B- 71 40 1902-1903 26.0 13.8 0.0 17.0 56.8 B- 71 Rank YEAR T<=32 Snow MECSb D>1" Points Grade PCTL 41 1916-1917 22.0 16.4 0.0 16.0 54.4 C+ 70 42 1896-1897 29.0 10.9 0.0 14.0 53.9 C+ 69 43 1983-1984 32.0 8.4 0.0 13.0 53.4 C+ 68 44 1908-1909 15.0 18.5 0.9 18.0 52.4 C+ 68 45 2000-2001 39.0 5.0 0.0 7.0 51.0 C+ 67 46 1898-1899 26.0 15.6 0.0 9.0 50.6 C+ 66 47 1953-1954 16.0 19.6 1.2 13.0 49.8 C+ 65 48 1927-1928 18.0 15.8 9.3 6.0 49.1 C+ 65 49 1947-1948 23.0 13.0 0.0 12.0 48.0 C+ 64 50 1993-1994 30.0 7.8 0.0 10.0 47.8 C 63 51 1961-1962 32.0 12.4 0.0 3.0 47.4 C 62 52 1964-1965 23.0 9.1 0.0 14.0 46.1 C 62 53 1970-1971 30.0 10.4 0.0 5.0 45.4 C 61 54 1942-1943 23.0 11.6 0.0 10.0 44.6 C 60 55 1932-1933 12.0 14.8 5.5 12.0 44.3 C 59 56 1958-1959 37.0 2.6 0.0 3.0 42.6 C 59 57 2017-2018 28.0 6.5 0.0 8.0 42.5 C 58 58 1984-1985 23.0 9.2 0.0 10.0 42.2 C 57 59 2021-2022 16.0 13.3 1.8 11.0 42.1 C 56 60 2024-2025 21.0 8.9 1.6 10.0 41.5 C 56 Rank YEAR T<=32 Snow MECSb D>1" Points Grade PCTL 61 1957-1958 21.0 11.0 2.8 6.0 40.8 C 55 62 2004-2005 24.0 7.6 0.0 8.0 39.6 C- 54 63 1980-1981 32.0 4.3 0.0 3.0 39.3 C- 53 64 1901-1902 28.0 7.4 0.6 3.0 39.0 C- 53 65 1925-1926 23.0 6.2 0.0 9.0 38.2 C- 52 66 1894-1895 20.0 5.0 0.0 13.0 38.0 C- 51 67 1914-1915 25.0 5.2 0.0 7.0 37.2 C- 50 68 2018-2019 20.0 9.5 0.0 7.0 36.5 C- 50 69 1950-1951 27.0 5.5 0.0 4.0 36.5 C- 49 70 1906-1907 22.0 7.5 0.0 7.0 36.5 C- 48 71 1998-1999 19.0 7.0 0.0 10.0 36.0 C- 47 72 2014-2015 23.0 6.4 0.0 6.0 35.4 C- 47 73 1933-1934 19.0 8.3 0.0 8.0 35.3 C- 46 74 1956-1957 16.0 10.9 0.0 8.0 34.9 C- 45 75 2008-2009 29.0 2.7 0.0 3.0 34.7 C- 44 76 1996-1997 27.0 5.5 0.0 2.0 34.5 C- 44 77 1968-1969 30.0 4.4 0.0 0.0 34.4 C- 43 78 1926-1927 27.0 2.8 0.0 4.0 33.8 C- 42 79 1973-1974 18.0 9.5 1.0 5.0 33.5 C- 41 80 1978-1979 18.0 9.4 0.0 6.0 33.4 C- 41 Rank YEAR T<=32 Snow MECSb D>1" Points Grade PCTL 81 1900-1901 18.0 6.5 0.0 7.0 31.5 D+ 40 82 1951-1952 22.0 7.1 0.0 2.0 31.1 D+ 39 83 1985-1986 26.0 2.6 0.0 2.0 30.6 D+ 38 84 2007-2008 19.0 7.2 0.0 4.0 30.2 D+ 38 85 1899-1900 20.0 3.2 0.0 7.0 30.2 D+ 37 86 1954-1955 26.0 2.7 0.0 1.0 29.7 D+ 36 87 1982-1983 14.0 8.4 1.7 5.0 29.1 D+ 35 88 1897-1898 16.0 8.0 0.0 4.0 28.0 D+ 35 89 1988-1989 16.0 6.9 0.0 5.0 27.9 D+ 34 90 1943-1944 15.0 5.9 0.0 7.0 27.9 D+ 33 91 1915-1916 17.0 5.9 0.0 5.0 27.9 D+ 32 92 1948-1949 7.0 11.0 1.8 8.0 27.8 D+ 32 93 1975-1976 24.0 2.4 0.0 1.0 27.4 D+ 31 94 2023-2024 10.0 9.1 0.0 8.0 27.1 D+ 30 95 1990-1991 13.0 9.0 0.0 5.0 27.0 D+ 29 96 1922-1923 13.0 9.6 0.0 4.0 26.6 D+ 29 97 1905-1906 10.0 6.9 0.7 9.0 26.6 D+ 28 98 2005-2006 14.0 6.5 0.0 5.0 25.5 D+ 27 99 1979-1980 16.0 5.1 0.0 4.0 25.1 D+ 26 100 1940-1941 12.0 7.0 0.0 6.0 25.0 D+ 26 Rank YEAR T<=32 Snow MECSb D>1" Points Grade PCTL 101 1991-1992 21.0 2.2 0.0 1.0 24.2 D+ 25 102 1952-1953 12.0 8.2 0.0 3.0 23.2 D 24 103 1946-1947 9.0 9.8 0.0 4.0 22.8 D 23 104 1907-1908 13.0 4.7 0.0 5.0 22.7 D 23 105 1972-1973 21.0 0.0 0.0 0.0 21.0 D 22 106 2020-2021 12.0 5.9 0.0 2.0 19.9 D 21 107 1895-1896 17.0 1.2 0.0 1.0 19.2 D 20 108 2006-2007 16.0 0.9 0.0 2.0 18.9 D 20 109 1930-1931 15.0 2.8 0.0 1.0 18.8 D 19 110 1974-1975 10.0 5.5 0.0 3.0 18.5 D 18 111 1937-1938 15.0 2.2 0.0 1.0 18.2 D 17 112 1893-1894 14.0 1.2 0.0 3.0 18.2 D 17 113 1941-1942 13.0 3.1 0.0 2.0 18.1 D 16 114 1928-1929 16.0 1.1 0.0 1.0 18.1 D 15 115 1959-1960 14.0 1.8 0.0 1.0 16.8 D 14 116 1923-1924 12.0 2.4 0.0 2.0 16.4 D 14 117 2001-2002 12.0 2.3 0.0 2.0 16.3 D 13 118 2012-2013 8.0 4.3 0.0 3.0 15.3 D- 12 119 1971-1972 12.0 2.1 0.0 1.0 15.1 D- 11 120 1992-1993 11.0 2.9 0.0 0.0 13.9 D- 11 Rank YEAR T<=32 Snow MECSb D>1" Points Grade PCTL 121 2019-2020 11.0 1.8 0.0 1.0 13.8 D- 10 122 2016-2017 13.0 0.7 0.0 0.0 13.7 D- 9 123 2011-2012 9.0 1.3 0.0 3.0 13.3 D- 8 124 1918-1919 12.0 1.3 0.0 0.0 13.3 D- 8 125 1920-1921 12.0 1.1 0.0 0.0 13.1 D- 7 126 1912-1913 5.0 4.9 0.0 3.0 12.9 D- 6 127 1994-1995 10.0 0.5 0.0 0.0 10.5 D- 5 128 1997-1998 8.0 1.1 0.0 0.0 9.1 D- 5 129 1913-1914 9.0 0.0 0.0 0.0 9.0 D- 4 130 1936-1937 6.0 2.8 0.0 0.0 8.8 D- 3 131 2022-2023 5.0 0.0 0.0 0.0 5.0 F 2 132 1931-1932 2.0 1.7 0.0 0.0 3.7 F 2 133 1949-1950 3.0 0.5 0.0 0.0 3.5 F 1 dc Rank YEAR T<=32 Snow MECSb D>1" Points Grade PCTL 1 1917-1918 47.0 34.4 6.0 37.0 124.4 A++ 100 2 1904-1905 37.0 30.7 2.0 28.0 97.7 A+ 99 3 1921-1922 24.0 37.0 16.0 14.0 91.0 A 98 4 1903-1904 46.0 18.4 0.6 23.0 88.0 A 98 5 1960-1961 33.0 22.3 4.7 27.0 87.0 A- 97 6 1908-1909 21.0 28.7 8.5 22.0 80.2 A- 96 7 1924-1925 30.0 20.2 0.0 27.0 77.2 B+ 95 8 1987-1988 22.0 24.6 7.8 22.0 76.4 B+ 95 9 1939-1940 30.0 20.1 4.7 21.0 75.8 B+ 94 10 1934-1935 20.0 28.4 7.0 19.0 74.4 B+ 93 11 1976-1977 39.0 11.1 0.0 24.0 74.1 B+ 92 12 1962-1963 31.0 18.3 0.7 24.0 74.0 B+ 92 13 1929-1930 30.0 baltimore Rank YEAR T<=32 Snow MECSb D>1" Points Grade PCTL 1 1917-1918 47.0 32.5 6.0 27.0 112.5 A++ 100 2 1904-1905 39.0 35.1 5.4 31.0 110.5 A++ 99 3 1960-1961 38.0 30.1 7.0 32.0 107.1 A++ 98 4 1903-1904 48.0 21.4 1.0 27.0 97.4 A+ 98 5 1921-1922 22.0 40.1 19.5 14.0 95.6 A 97 6 1995-1996 29.0 35.9 13.5 15.0 93.4 A 96 7 1924-1925 25.0 23.0 6.0 30.0 84.0 A- 95 8 2009-2010 29.0 27.0 12.0 13.0 81.0 A- 95 9 1939-1940 32.0 16.5 1.0 30.0 79.5 B+ 94 10 1976-1977 46.0 11.1 0.0 19.0 76.1 B+ 93 11 1909-1910 27.0 25.5 5.2 18.0 75.7 B+ 92 12 2015-2016 15.0 30.0 20.5 10.0 75.5 B+ 92 13 1944-1945 29.0 14.4 2.0 30.0 75.4 B+ 91 14 1981-1982 35.0 17.2 1.1 21.0 74.3 B+ 90 15 1962-1963 34.0 15.7 0.0 24.0 73.7 B+ 89 16 1963-1964 29.0 20.0 5.8 18.0 72.8 B+ 89 17 1929-1930 29.0 19.4 4.0 20.0 72.4 B+ 88 18 2002-2003 36.0 15.0 2.4 15.0 68.4 B 87 19 1999-2000 21.0 23.3 10.6 12.0 66.9 B 86 20 1934-1935 22.0 21.3 7.5 15.0 65.8 B 86 Rank YEAR T<=32 Snow MECSb D>1" Points Grade PCTL 21 1989-1990 27.0 14.5 0.0 24.0 65.5 B 85 22 1910-1911 26.0 17.8 2.5 19.0 65.3 B 84 23 1938-1939 20.0 18.6 3.6 23.0 65.2 B 83 24 1969-1970 33.0 15.1 1.1 15.0 64.2 B 83 25 2003-2004 30.0 18.0 0.0 16.0 64.0 B 82 26 1967-1968 31.0 15.5 3.4 13.0 62.9 B- 81 27 1987-1988 22.0 20.2 2.5 18.0 62.7 B- 80 28 1935-1936 26.0 15.3 0.0 21.0 62.3 B- 80 29 2010-2011 37.0 11.9 2.6 10.0 61.5 B- 79 30 1955-1956 37.0 9.9 0.0 14.0 60.9 B- 78 31 1966-1967 22.0 20.8 6.0 12.0 60.8 B- 77 32 1945-1946 23.0 15.0 2.6 20.0 60.6 B- 77 33 1965-1966 27.0 21.4 6.0 6.0 60.4 B- 76 34 2025-2026 28.0 13.7 6.3 11.0 59.0 B- 75 35 1986-1987 16.0 25.1 8.4 9.0 58.5 B- 74 36 1977-1978 34.0 13.5 0.0 11.0 58.5 B- 74 37 1911-1912 25.0 14.4 0.0 18.0 57.4 B- 73 38 1919-1920 34.0 7.2 0.0 16.0 57.2 B- 72 39 2013-2014 31.0 12.7 0.1 13.0 56.8 B- 71 40 1902-1903 26.0 13.8 0.0 17.0 56.8 B- 71 Rank YEAR T<=32 Snow MECSb D>1" Points Grade PCTL 41 1916-1917 22.0 16.4 0.0 16.0 54.4 C+ 70 42 1896-1897 29.0 10.9 0.0 14.0 53.9 C+ 69 43 1983-1984 32.0 8.4 0.0 13.0 53.4 C+ 68 44 1908-1909 15.0 18.5 0.9 18.0 52.4 C+ 68 45 2000-2001 39.0 5.0 0.0 7.0 51.0 C+ 67 46 1898-1899 26.0 15.6 0.0 9.0 50.6 C+ 66 47 1953-1954 16.0 19.6 1.2 13.0 49.8 C+ 65 48 1927-1928 18.0 15.8 9.3 6.0 49.1 C+ 65 49 1947-1948 23.0 13.0 0.0 12.0 48.0 C+ 64 50 1993-1994 30.0 7.8 0.0 10.0 47.8 C 63 51 1961-1962 32.0 12.4 0.0 3.0 47.4 C 62 52 1964-1965 23.0 9.1 0.0 14.0 46.1 C 62 53 1970-1971 30.0 10.4 0.0 5.0 45.4 C 61 54 1942-1943 23.0 11.6 0.0 10.0 44.6 C 60 55 1932-1933 12.0 14.8 5.5 12.0 44.3 C 59 56 1958-1959 37.0 2.6 0.0 3.0 42.6 C 59 57 2017-2018 28.0 6.5 0.0 8.0 42.5 C 58 58 1984-1985 23.0 9.2 0.0 10.0 42.2 C 57 59 2021-2022 16.0 13.3 1.8 11.0 42.1 C 56 60 2024-2025 21.0 8.9 1.6 10.0 41.5 C 56 Rank YEAR T<=32 Snow MECSb D>1" Points Grade PCTL 61 1957-1958 21.0 11.0 2.8 6.0 40.8 C 55 62 2004-2005 24.0 7.6 0.0 8.0 39.6 C- 54 63 1980-1981 32.0 4.3 0.0 3.0 39.3 C- 53 64 1901-1902 28.0 7.4 0.6 3.0 39.0 C- 53 65 1925-1926 23.0 6.2 0.0 9.0 38.2 C- 52 66 1894-1895 20.0 5.0 0.0 13.0 38.0 C- 51 67 1914-1915 25.0 5.2 0.0 7.0 37.2 C- 50 68 2018-2019 20.0 9.5 0.0 7.0 36.5 C- 50 69 1950-1951 27.0 5.5 0.0 4.0 36.5 C- 49 70 1906-1907 22.0 7.5 0.0 7.0 36.5 C- 48 71 1998-1999 19.0 7.0 0.0 10.0 36.0 C- 47 72 2014-2015 23.0 6.4 0.0 6.0 35.4 C- 47 73 1933-1934 19.0 8.3 0.0 8.0 35.3 C- 46 74 1956-1957 16.0 10.9 0.0 8.0 34.9 C- 45 75 2008-2009 29.0 2.7 0.0 3.0 34.7 C- 44 76 1996-1997 27.0 5.5 0.0 2.0 34.5 C- 44 77 1968-1969 30.0 4.4 0.0 0.0 34.4 C- 43 78 1926-1927 27.0 2.8 0.0 4.0 33.8 C- 42 79 1973-1974 18.0 9.5 1.0 5.0 33.5 C- 41 80 1978-1979 18.0 9.4 0.0 6.0 33.4 C- 41 Rank YEAR T<=32 Snow MECSb D>1" Points Grade PCTL 81 1900-1901 18.0 6.5 0.0 7.0 31.5 D+ 40 82 1951-1952 22.0 7.1 0.0 2.0 31.1 D+ 39 83 1985-1986 26.0 2.6 0.0 2.0 30.6 D+ 38 84 2007-2008 19.0 7.2 0.0 4.0 30.2 D+ 38 85 1899-1900 20.0 3.2 0.0 7.0 30.2 D+ 37 86 1954-1955 26.0 2.7 0.0 1.0 29.7 D+ 36 87 1982-1983 14.0 8.4 1.7 5.0 29.1 D+ 35 88 1897-1898 16.0 8.0 0.0 4.0 28.0 D+ 35 89 1988-1989 16.0 6.9 0.0 5.0 27.9 D+ 34 90 1943-1944 15.0 5.9 0.0 7.0 27.9 D+ 33 91 1915-1916 17.0 5.9 0.0 5.0 27.9 D+ 32 92 1948-1949 7.0 11.0 1.8 8.0 27.8 D+ 32 93 1975-1976 24.0 2.4 0.0 1.0 27.4 D+ 31 94 2023-2024 10.0 9.1 0.0 8.0 27.1 D+ 30 95 1990-1991 13.0 9.0 0.0 5.0 27.0 D+ 29 96 1922-1923 13.0 9.6 0.0 4.0 26.6 D+ 29 97 1905-1906 10.0 6.9 0.7 9.0 26.6 D+ 28 98 2005-2006 14.0 6.5 0.0 5.0 25.5 D+ 27 99 1979-1980 16.0 5.1 0.0 4.0 25.1 D+ 26 100 1940-1941 12.0 7.0 0.0 6.0 25.0 D+ 26 Rank YEAR T<=32 Snow MECSb D>1" Points Grade PCTL 101 1991-1992 21.0 2.2 0.0 1.0 24.2 D+ 25 102 1952-1953 12.0 8.2 0.0 3.0 23.2 D 24 103 1946-1947 9.0 9.8 0.0 4.0 22.8 D 23 104 1907-1908 13.0 4.7 0.0 5.0 22.7 D 23 105 1972-1973 21.0 0.0 0.0 0.0 21.0 D 22 106 2020-2021 12.0 5.9 0.0 2.0 19.9 D 21 107 1895-1896 17.0 1.2 0.0 1.0 19.2 D 20 108 2006-2007 16.0 0.9 0.0 2.0 18.9 D 20 109 1930-1931 15.0 2.8 0.0 1.0 18.8 D 19 110 1974-1975 10.0 5.5 0.0 3.0 18.5 D 18 111 1937-1938 15.0 2.2 0.0 1.0 18.2 D 17 112 1893-1894 14.0 1.2 0.0 3.0 18.2 D 17 113 1941-1942 13.0 3.1 0.0 2.0 18.1 D 16 114 1928-1929 16.0 1.1 0.0 1.0 18.1 D 15 115 1959-1960 14.0 1.8 0.0 1.0 16.8 D 14 116 1923-1924 12.0 2.4 0.0 2.0 16.4 D 14 117 2001-2002 12.0 2.3 0.0 2.0 16.3 D 13 118 2012-2013 8.0 4.3 0.0 3.0 15.3 D- 12 119 1971-1972 12.0 2.1 0.0 1.0 15.1 D- 11 120 1992-1993 11.0 2.9 0.0 0.0 13.9 D- 11 Rank YEAR T<=32 Snow MECSb D>1" Points Grade PCTL 121 2019-2020 11.0 1.8 0.0 1.0 13.8 D- 10 122 2016-2017 13.0 0.7 0.0 0.0 13.7 D- 9 123 2011-2012 9.0 1.3 0.0 3.0 13.3 D- 8 124 1918-1919 12.0 1.3 0.0 0.0 13.3 D- 8 125 1920-1921 12.0 1.1 0.0 0.0 13.1 D- 7 126 1912-1913 5.0 4.9 0.0 3.0 12.9 D- 6 127 1994-1995 10.0 0.5 0.0 0.0 10.5 D- 5 128 1997-1998 8.0 1.1 0.0 0.0 9.1 D- 5 129 1913-1914 9.0 0.0 0.0 0.0 9.0 D- 4 130 1936-1937 6.0 2.8 0.0 0.0 8.8 D- 3 131 2022-2023 5.0 0.0 0.0 0.0 5.0 F 2 132 1931-1932 2.0 1.7 0.0 0.0 3.7 F 2 133 1949-1950 3.0 0.5 0.0 0.0 3.5 F 1 18.9 6.5 17.0 72.4 B+ 91 14 1995-1996 24.0 25.6 8.0 13.0 70.6 B 90 15 1910-1911 28.0 22.4 0.0 19.0 69.4 B 89 16 1911-1912 27.0 17.5 1.1 19.0 64.6 B 89 17 2009-2010 19.0 24.0 11.4 9.0 63.4 B- 88 18 1919-1920 37.0 8.5 0.0 17.0 62.5 B- 87 19 1981-1982 25.0 17.0 1.4 19.0 62.4 B- 86 20 1963-1964 26.0 15.3 0.6 19.0 60.9 B- 86 Rank YEAR T<=32 Snow MECSb D>1" Points Grade PCTL 21 1989-1990 24.0 12.7 0.0 24.0 60.7 B- 85 22 1935-1936 29.0 14.0 0.0 17.0 60.0 B- 84 23 1967-1968 26.0 16.0 1.9 15.0 58.9 B- 83 24 1945-1946 26.0 17.1 0.0 14.0 57.1 B- 83 25 1965-1966 21.0 21.5 8.9 5.0 56.4 B- 82 26 1909-1910 27.0 13.4 0.0 14.0 54.4 C+ 81 27 1947-1948 29.0 15.8 0.4 9.0 54.2 C+ 80 28 1898-1899 29.0 14.7 0.0 10.0 53.7 C+ 80 29 1896-1897 33.0 10.2 0.0 10.0 53.2 C+ 79 30 1938-1939 20.0 14.8 1.5 15.0 51.3 C+ 78 31 1894-1895 24.0 11.3 0.0 16.0 51.3 C+ 77 32 1999-2000 19.0 14.5 4.3 12.0 49.8 C+ 77 33 1977-1978 26.0 10.6 0.0 13.0 49.6 C+ 76 34 2002-2003 26.0 11.6 1.1 10.0 48.7 C+ 75 35 2015-2016 12.0 18.8 7.8 9.0 47.6 C 74 36 1966-1967 13.0 17.4 3.2 14.0 47.6 C 74 37 1916-1917 25.0 13.3 0.0 9.0 47.3 C 73 38 1986-1987 11.0 20.8 5.8 9.0 46.6 C 72 39 1953-1954 14.0 18.0 2.9 11.0 45.9 C 71 40 1914-1915 30.0 5.5 0.0 9.0 44.5 C 71 Rank YEAR T<=32 Snow MECSb D>1" Points Grade PCTL 41 1969-1970 24.0 10.4 0.0 10.0 44.4 C 70 42 1955-1956 33.0 7.3 0.0 4.0 44.3 C 69 43 1927-1928 19.0 13.1 5.5 6.0 43.6 C 68 44 2003-2004 22.0 12.4 0.0 9.0 43.4 C 68 45 1932-1933 13.0 14.5 6.5 9.0 43.0 C 67 46 1900-1901 27.0 8.8 0.0 7.0 42.8 C 66 47 1970-1971 27.0 10.0 0.0 5.0 42.0 C 65 48 1983-1984 26.0 6.8 0.0 9.0 41.8 C 65 49 1993-1994 24.0 6.1 0.0 11.0 41.1 C 64 50 1942-1943 21.0 12.0 0.0 8.0 41.0 C 63 51 2010-2011 24.0 9.4 0.0 7.0 40.4 C 62 52 2024-2025 17.0 8.4 2.2 11.0 38.6 C- 62 53 1957-1958 16.0 12.6 6.1 3.0 37.7 C- 61 54 1925-1926 23.0 5.6 0.0 9.0 37.6 C- 60 55 1901-1902 27.0 7.6 0.0 3.0 37.6 C- 59 56 1984-1985 18.0 10.3 0.0 9.0 37.3 C- 59 57 1956-1957 17.0 10.3 0.0 10.0 37.3 C- 58 58 1958-1959 29.0 4.9 0.0 3.0 36.9 C- 57 59 1964-1965 17.0 9.8 0.0 10.0 36.8 C- 56 60 2004-2005 23.0 6.5 0.0 7.0 36.5 C- 56 Rank YEAR T<=32 Snow MECSb D>1" Points Grade PCTL 61 2025-2026 19.0 8.5 1.9 7.0 36.4 C- 55 62 2000-2001 27.0 4.4 0.0 5.0 36.4 C- 54 63 2013-2014 19.0 8.1 0.0 9.0 36.1 C- 53 64 1899-1900 21.0 4.0 0.0 10.0 35.0 C- 53 65 2021-2022 14.0 12.3 1.9 6.0 34.2 C- 52 66 1915-1916 17.0 9.5 0.2 7.0 33.7 C- 51 67 1944-1945 27.0 5.6 0.0 1.0 33.6 C- 50 68 1926-1927 25.0 3.3 0.0 5.0 33.3 C- 50 69 1902-1903 25.0 5.2 0.0 3.0 33.2 C- 49 70 2018-2019 8.0 12.9 3.3 7.0 31.2 D+ 48 71 1980-1981 23.0 4.5 0.0 3.0 30.5 D+ 47 72 1906-1907 21.0 5.1 0.0 4.0 30.1 D+ 47 73 1897-1898 20.0 8.0 0.0 2.0 30.0 D+ 46 74 1950-1951 18.0 6.2 0.0 4.0 28.2 D+ 45 75 1905-1906 11.0 8.3 0.0 8.0 27.3 D+ 44 76 1893-1894 17.0 5.3 0.0 5.0 27.3 D+ 44 77 1943-1944 18.0 4.1 0.0 5.0 27.1 D+ 43 78 1973-1974 7.0 12.5 1.0 6.0 26.5 D+ 42 79 1961-1962 18.0 4.5 0.0 4.0 26.5 D+ 41 80 1933-1934 19.0 3.5 0.0 4.0 26.5 D+ 41 Rank YEAR T<=32 Snow MECSb D>1" Points Grade PCTL 81 1930-1931 21.0 2.5 0.0 3.0 26.5 D+ 40 82 1907-1908 17.0 4.7 0.0 4.0 25.7 D+ 39 83 1937-1938 22.0 1.5 0.0 2.0 25.5 D+ 38 84 1968-1969 25.0 0.2 0.0 0.0 25.2 D+ 38 85 2017-2018 19.0 3.1 0.0 3.0 25.1 D+ 37 86 1978-1979 14.0 7.1 0.0 4.0 25.1 D+ 36 87 2023-2024 9.0 7.9 0.0 8.0 24.9 D+ 35 88 1951-1952 15.0 6.4 0.0 3.0 24.4 D+ 35 89 2008-2009 20.0 1.9 0.0 2.0 23.9 D 34 90 1985-1986 19.0 2.5 0.0 2.0 23.5 D 33 91 1948-1949 7.0 11.8 0.7 4.0 23.5 D 32 92 1940-1941 15.0 4.7 0.0 3.0 22.7 D 32 93 1895-1896 19.0 1.4 0.0 2.0 22.4 D 31 94 1979-1980 8.0 8.9 0.0 5.0 21.9 D 30 95 1982-1983 9.0 6.6 1.6 4.0 21.2 D 29 96 1912-1913 7.0 7.1 1.5 5.0 20.6 D 29 97 1928-1929 20.0 0.5 0.0 0.0 20.5 D 28 98 1954-1955 16.0 2.4 0.0 1.0 19.4 D 27 99 1946-1947 10.0 6.3 0.0 3.0 19.3 D 26 100 1991-1992 13.0 4.0 0.0 2.0 19.0 D 26 Rank YEAR T<=32 Snow MECSb D>1" Points Grade PCTL 101 1990-1991 7.0 7.8 0.0 4.0 18.8 D 25 102 1998-1999 15.0 2.7 0.0 1.0 18.7 D 24 103 1923-1924 14.0 2.7 0.0 2.0 18.7 D 23 104 1988-1989 12.0 4.1 0.0 2.0 18.1 D 23 105 1941-1942 14.0 2.0 0.0 2.0 18.0 D 22 106 1920-1921 16.0 2.0 0.0 0.0 18.0 D 21 107 2005-2006 10.0 4.8 0.0 3.0 17.8 D 20 108 2014-2015 9.0 3.6 0.0 5.0 17.6 D 20 109 1922-1923 11.0 4.9 0.0 1.0 16.9 D 19 110 1996-1997 12.0 2.7 0.0 2.0 16.7 D 18 111 1975-1976 15.0 0.5 0.0 0.0 15.5 D- 17 112 2007-2008 8.0 3.9 0.0 3.0 14.9 D- 17 113 2006-2007 12.0 1.3 0.0 1.0 14.3 D- 16 114 1952-1953 7.0 5.0 0.0 2.0 14.0 D- 15 115 1974-1975 4.0 6.7 0.0 3.0 13.7 D- 14 116 1918-1919 13.0 0.5 0.0 0.0 13.5 D- 14 117 1972-1973 13.0 0.0 0.0 0.0 13.0 D- 13 118 1913-1914 12.0 0.0 0.0 0.0 12.0 D- 12 119 1971-1972 9.0 1.8 0.0 1.0 11.8 D- 11 120 1994-1995 5.0 3.9 0.0 2.0 10.9 D- 11 Rank YEAR T<=32 Snow MECSb D>1" Points Grade PCTL 121 2016-2017 8.0 1.4 0.0 1.0 10.4 D- 10 122 1959-1960 10.0 0.0 0.0 0.0 10.0 D- 9 123 2001-2002 5.0 2.7 0.0 1.0 8.7 D- 8 124 2020-2021 6.0 2.6 0.0 0.0 8.6 D- 8 125 1936-1937 7.0 1.5 0.0 0.0 8.5 D- 7 126 2011-2012 5.0 1.7 0.0 1.0 7.7 F 6 127 2012-2013 5.0 1.1 0.0 0.0 6.1 F 5 128 1992-1993 4.0 1.0 0.0 0.0 5.0 F 5 129 2019-2020 4.0 0.6 0.0 0.0 4.6 F 4 130 1949-1950 3.0 0.3 0.0 0.0 3.3 F 3 131 2022-2023 3.0 0.0 0.0 0.0 3.0 F 2 132 1931-1932 2.0 1.0 0.0 0.0 3.0 F 2 133 1997-1998 2.0 0.1 0.0 0.0 2.1 F 1
-
Wow that Pacific couldn't be more different. It'll be an interesting test. I took a Quick Look back at February 2006, the February that looks most similar to this year - Temperatures were slightly above average with one big snow https://www.extremeweatherwatch.com/cities/baltimore/year-2006#february
-
They got rid of the blizzard watch a few years before the pandemic. Blizzard warnings can still be issued but only when blizzard conditions are imminent, i.e., within 12-24 hours. Winter storm warnings can be issued before blizzard warnings or simultaneously.
-
Yes, very 1993-like with respect to how solid the snow/sleet/glaze is. I was able to walk the dogs on 4" of sleet this morning without falling through or leaving an imprint. However, we did fall through in places where there was 4" of sleet on top of 6" of snow. We haven't seen any plows on our street yet - and we're not on a cul de sac. I could try to guess when schools will open, but I wouldn't laugh at a guess of February 12th. I grew up in northeast Iowa and my dad always talked about January 1936, when schools were closed all month.
-
4.5 inches in this section of Columbia
-
Jan 24-26 Weekend Snow and Sleetfest Model Thread Part Tres
dallen7908 replied to H2O's topic in Mid Atlantic
Please read more carefully - especially before criticizing someone. -
January 24-26: Miracle or Mirage JV/Banter Thread!
dallen7908 replied to SnowenOutThere's topic in Mid Atlantic
My partner is at the grocery store and the only fruit options are zucchini spirals, cantaloupe or watermelon chunks, golden berries, a mango berry medley, and mirepoix. -
January 24-26: Miracle or Mirage JV/Banter Thread!
dallen7908 replied to SnowenOutThere's topic in Mid Atlantic
According to AI, table salt is too fine, dissolves too fast, and contains additives that create a sharp, unpleasant flavor. So perhaps they would work better than table salt - but kosher salt recommended. -
January 24-26: Miracle or Mirage JV/Banter Thread!
dallen7908 replied to SnowenOutThere's topic in Mid Atlantic
AI overview of the effectiveness of salt as a function of temperature. "Different salts work for different temperatures, with calcium chloride best for extreme cold (down to -25°F), magnesium chloride for moderate cold (around 10°F), and standard sodium chloride (rock salt) effective only above 15°F, making blends or specialized products better for deep freezes. Salt types by temperature Above 15°F: Sodium Chloride (rock salt) is affordable and works for light cold. 10°F to 20°F: Magnesium Chloride handles teens and regular cold, absorbing moisture. Below 10°F: Calcium Chloride is best for extreme cold, melting quickly and working down to -25°F. Blends: Many commercial ice melts use blends (like calcium chloride/magnesium chloride) for broader effectiveness. Key considerations Speed: Calcium chloride melts ice faster than sodium chloride. Pet/Plant Safety: Magnesium chloride is a less harmful option for pets and plants, while calcium chloride can damage lawns if overused. Application: Use ice melt before snow to prevent bonding, and apply sparingly to avoid damage. " -
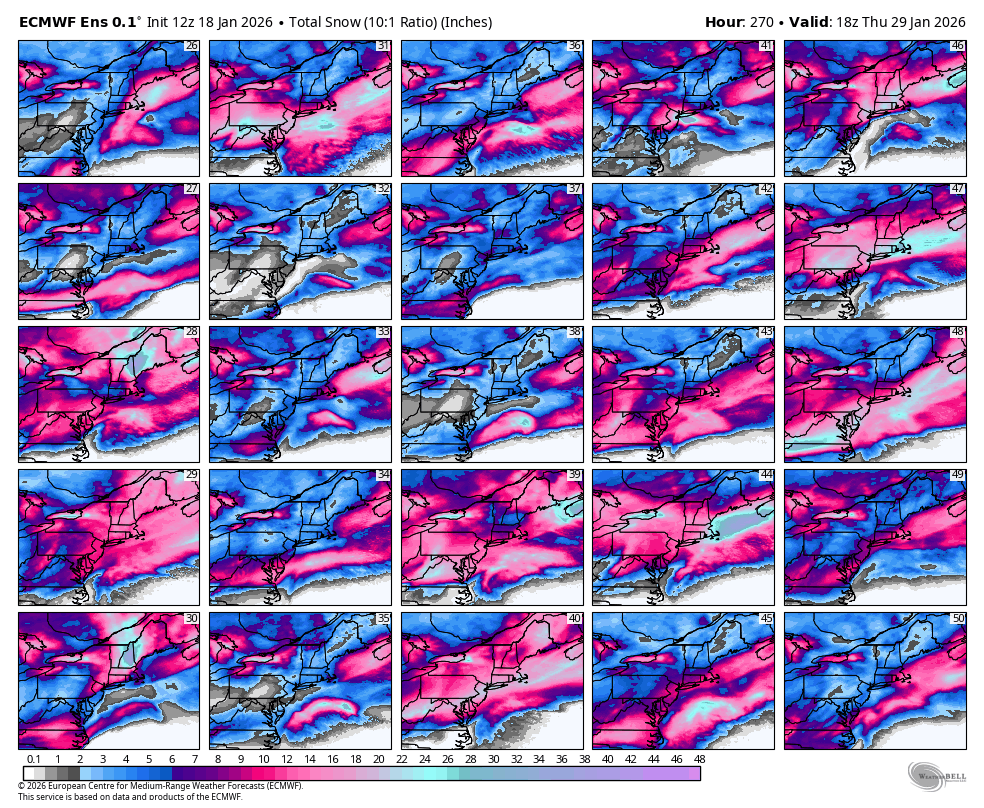
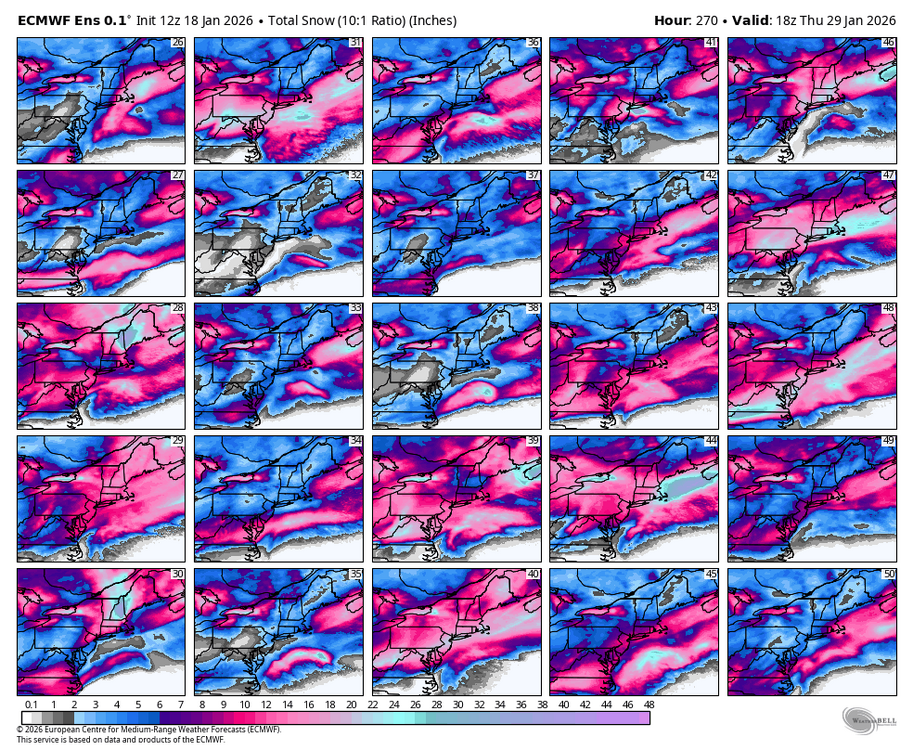
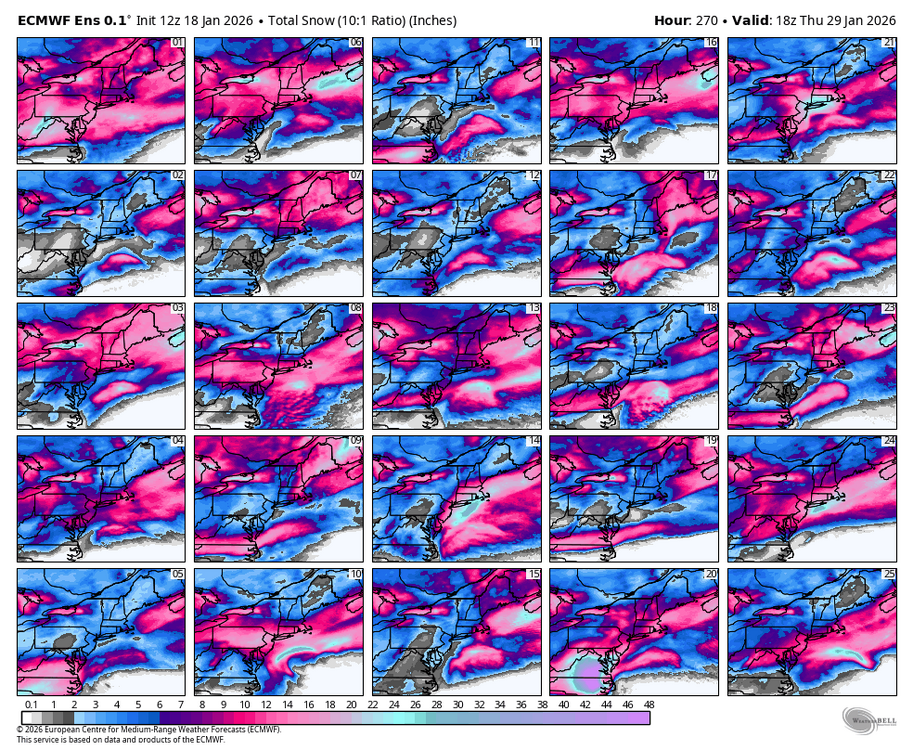
So assuming 10:1 and throwing out the extrema - 6 - 9" before changeover and assuming 3:1 afterwards we're talking 8-11 - can't complain about that. Hope it holds.
-
January 24-26: Miracle or Mirage JV/Banter Thread!
dallen7908 replied to SnowenOutThere's topic in Mid Atlantic
Not if we don't have power ... -
TMIN biases are seen in the eastern U.S. with the operational ECMWF forecasts’ largest low biases occurring in DJF (between 1.6–2.7 °C). The low bias is exacerbated when snow is present and the boundary layer is stable. See Lopes et al. 2024. ECMWF newsletter (2018) - Increasing the physical realism of surface processes in a model to reduce systematic biases may increase the root-mean-square error (RMSE) because different kinds of errors may no longer partially cancel each other. For example, 2-metre temperature (T2m) is computed diagnostically in the IFS from the temperature at the lowest model level and the skin temperature. There is a limiter in the computation of T2m which becomes active in very stable, low wind situations, and which prevents the T2m from deviating too strongly from the temperature at the lowest model level. Removing this limiter would be physically desirable, but tests have shown that doing so in the current model setup increases the RMSE.
-
Thanks for the post. As some of you are aware, MOGREPS-G is the global ensemble system run by the UK Met Office. A quick check shows that it is run every 6 hours for 7 days and has 18 members. The snow map mean is an average of 36 members (the last two cycles). To increase dispersion, additive inflation is used, i.e., flow-dependent perturbations, with a structure similar to what has been observed in the past, are added to the members as they are running. Additive inflation is one of the techniques being used to add diversity to ensemble results.
-
l love digital snow!
-
I wonder how dispersive the members of the AIFS are? Crazy mean.
-
I haven't seen any snow and was outside for the last hour or so. Perhaps early morning? On the positive side, there were a few patches of snow/graupel left from yesterday's event.
-
Posting for State Climatologist: "Maryland Climate Bulletin for December 2025, which includes sea surface temperatures for the Chesapeake Bay and the state's coastal waters, along with all its regular sections. You can access the Bulletin from the following link: https://mdsco.umd.edu/Bulletin/bulletin_mdsco_current.pdf Points to highlight are: 1) Statewide averages indicate that December 2025 was colder and drier than normal (i.e., 1991-2020 averages). The statewide mean temperature was much colder than normal (3.7°F below) in December, after a slightly colder-than-normal November (0.1°F below) and October (0.2°F below). Statewide precipitation was drier than normal (1.85 inches deficit) in December, following drier-than-normal November (1.73 inches deficit) and October (1.54 inches deficit). 2) The mean temperature was colder than normal throughout the state, particularly over Harford and Cecil counties (4.5‒4.8°F below), the counties of the Eastern Shore (3.9−4.5°F below), and the central Piedmont (3.6−4.2°F below). Precipitation was below normal in the entire state, particularly over the southern and western perimeters of the Piedmont (2.1‒2.2 inches deficit), the northern Piedmont (1.9‒2.0 inches deficit), and western Maryland and northern Eastern Shore (1.7‒1.9 inches deficit). In general, these regions received 50‒59% less precipitation than normal for the month, with western Montgomery and Frederick counties receiving the least (59‒62%). 3) Drought conditions worsened by the end of December. While the extent of the state affected by drought conditions remains the same as at the start of the month (~100%), the extent of Moderate and Severe drought conditions increased by approximately 10 and 20%, respectively. Moderate conditions covered the state westward of the Bay, with Severe conditions over Montgomery, Frederick, Washington, and Allegany counties, as well as portions of Garrett and Charles counties. Throughout the state, streams and rivers experienced Below-normal to Much-Below-normal streamflow, with more streams and rivers in the Much-Below-normal category than in November. 4) Statewide minimum daily temperatures from January 1 to December 31 indicated the number of freezing days with minimum temperatures equal to or colder than 32°F has been three days more than normal (93 vs. 90) with two freezing spells below normal (i.e., two or more consecutive freezing days; 12 vs. 14); twenty seven of these days, and two of the spells occurred in December. 5) Statewide daily total precipitation from January 1 to December 31 showed that the number of days with extreme precipitation (at least 0.64 inches ‒the 95th percentile in 1951−2000) has been five days below normal (14 vs. 19), with none in December. The number of dry spells (two or more consecutive days with daily precipitation of no more than 0.04 inches) for the calendar year has been also fewer than normal by two spells (46 vs. 48), with five of them occurring in December and the longest lasting seven days; the mean duration to date of the dry spells has been normal (5 days). 6) Statewide mean, maximum, and minimum temperatures in December 2025 (34.4, 43.4, 25.5°F) were below their (1895-2024) long-term means, but far from their coldest records (of 24.6, 33.2, and 16.0°F set in 1989). This month's mean, maximum, and minimum temperatures made this the forty-fourth, forty-seventh, and forty-second coldest December, respectively, since 1895. 7) Statewide precipitation in December 2025 (1.83 inches) was below its (1895-2024) long-term mean and within the 25% of its lowest values on record. Still, it was far from its record of 0.50 inches set in 1955. Statewide, this was the eighteenth-driest December since 1895, the sixteenth driest in Allegany and Garrett counties, the seventeenth in Montgomery County, and the nineteenth in Anne Arundel, Howard, and Washington counties. 8) Sea surface temperatures in the Chesapeake Bay in December 2025 were colder than their 2007-2020 mean everywhere, notably in the western coastal waters of the Middle Basin and southwestern Upper Basin, the Potomac River, the Chincoteague Bay, and the mouth of rivers in the Eastern Shore (5°F below). The all-basin mean temperature of 41.8°F was below the mean of the 2007-2020 base period (44.6°F) and far from the coldest December temperature in the 19-year data set (2007-2025), which was 38.7°F set in 2010. Please see the Bulletin for more details, including information on century-long trends, climatology, standard deviation maps, and links of interest. The regular production of the Bulletin is only possible thanks to the hard work and data provided by our friends at NOAA National Centers for Environmental Information, the CoastWatch East Coast Node, the Institutions involved in the U.S. Drought Monitor, and the U.S. Geological Survey's Water Watch. The Maryland Climate Bulletin is issued monthly and presents the state's recent air and sea surface temperatures and precipitation conditions in a clear, concise format, helping Marylanders better understand regional climate variations. Please help disseminate the Bulletin. Thanks, Alfredo -- ............................................. Alfredo Ruiz-Barradas, PhD Associate Research Professor Maryland State Climatologist"
-
10th, 25th, 50th, 75th, & 90th PCTL snow fall totals (inches) for GFS ensemble, EPS, and Canada at DCA over the next 10 (15) days. PCTL GFS EPS Canadian GFS EPS Canadian 10 0.1 0.1 0.0 0.3 0.3 0.2 25. 0.4. 0.2 0.1 0.7 0.7 0.5 50 1.0 0.5 0.4 2.3 1.9 0.9 75 2.2 1.0 0.9 5.1 5.2 2.0 90 3.4 1.7 1.6 8.6 8.1 3.1