dallen7908
-
Posts
960 -
Joined
-
Last visited
Content Type
Profiles
Blogs
Forums
American Weather
Media Demo
Store
Gallery
Everything posted by dallen7908
-
Almost 2" here as of 6
-
Just fell below freezing here (31.9) and on cue, despite the disconnect between air temperature and the surface, the driveway is beginning to cave. Moderate snow.
-
Yes, the current sun angle of 32.6 degrees at my location and time is more than 11 degrees higher than it would have been on the 21st of December at the same time.
-
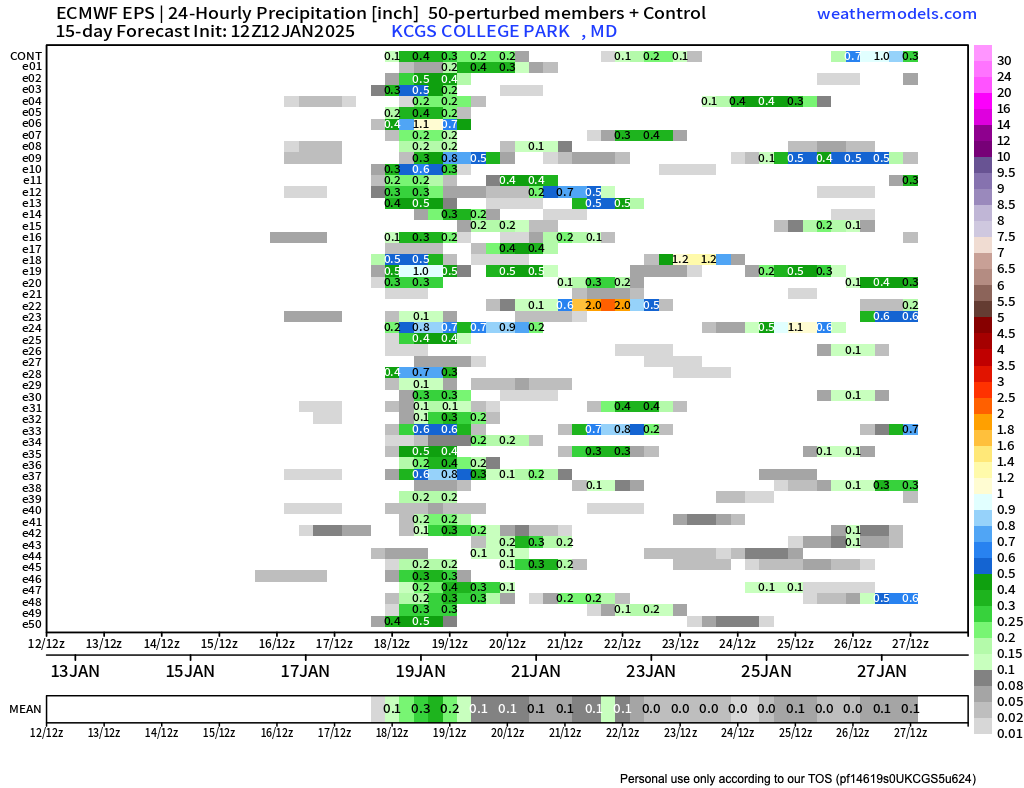
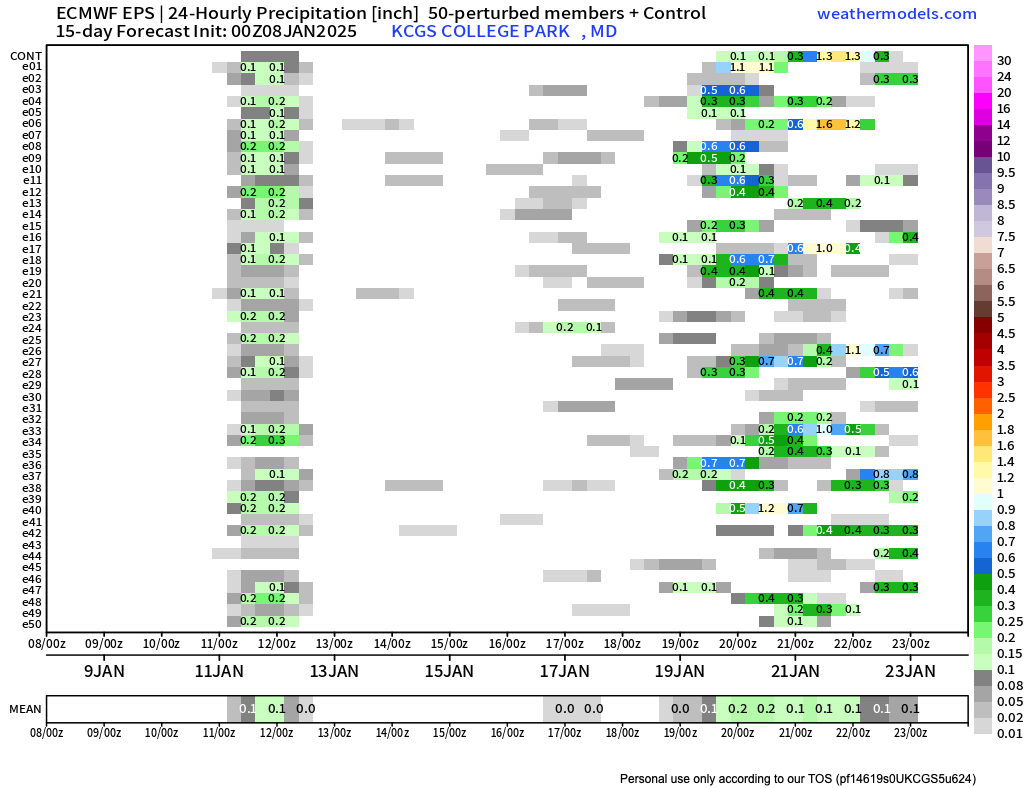
The precipitation distribution wobbled back to what it looked like in the 00 UTC run.
-
https://www.meteor.iastate.edu/~ckarsten/cobb/cobb.php?model=nam&site=kdca Here is a site that a few of you may not be aware of. It is useful for determining the timing of precipitation onset, examining rates, and looking at model temperatures from the NAM and GFS. For example, the unrealistic snow amounts from 12-km NAM are not just due to its convective algorithm but are partly due to the low temperatures it is forecasting.
-
Biased a bit high because it counts sleet as snow?
-
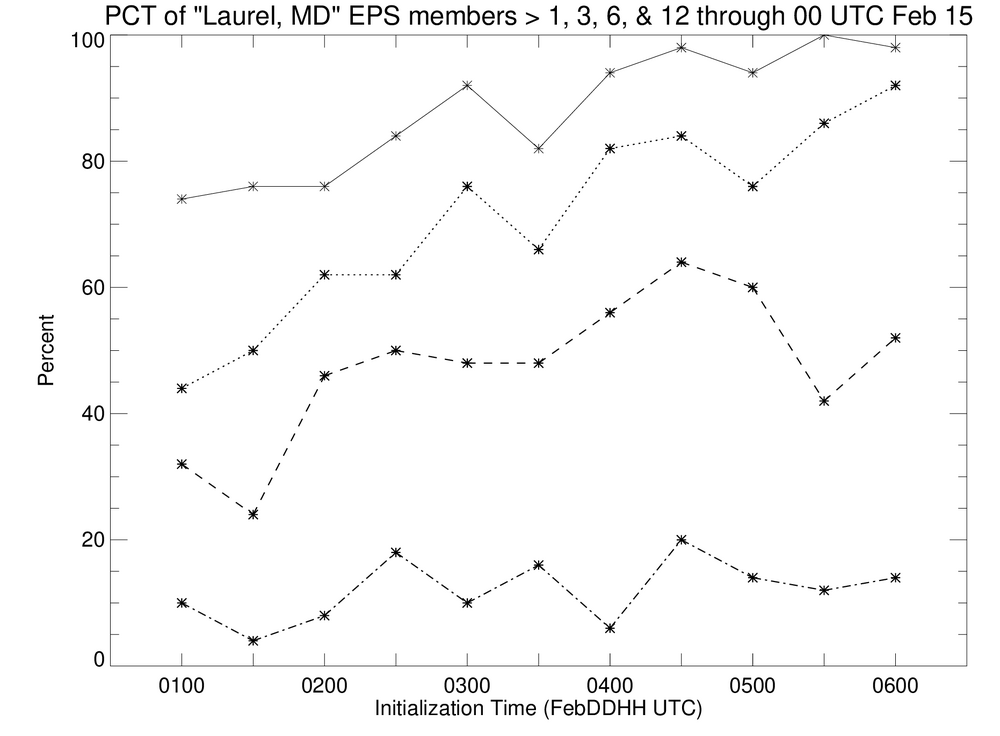
Homemade.
-
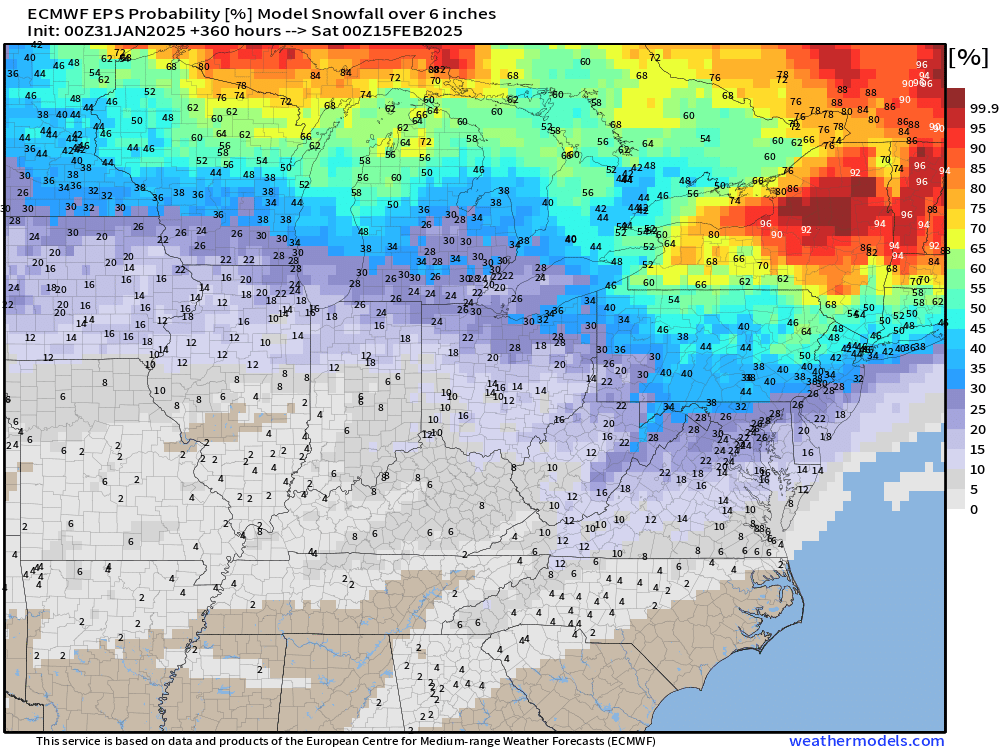
Percent of EPS members giving the Laurel area at least 12" (dash-dot), 6" (dash), 3" (dotted), and 1" (solid) of snow/sleet during the 9-14 day period before 00 UTC February 15.
-
On a more uplifting note: "February 5th is National Weatherperson's Day. The day commemorates the birth of John Jeffries in 1744. Jeffries, one of Americas first weather observers, began taking daily weather observations in Boston in 1774 and he took the first balloon observation in 1784. This is a day to recognize the men and women who collectively provide Americans with the best weather, water, and climate forecasts and warning services of any nation."
-
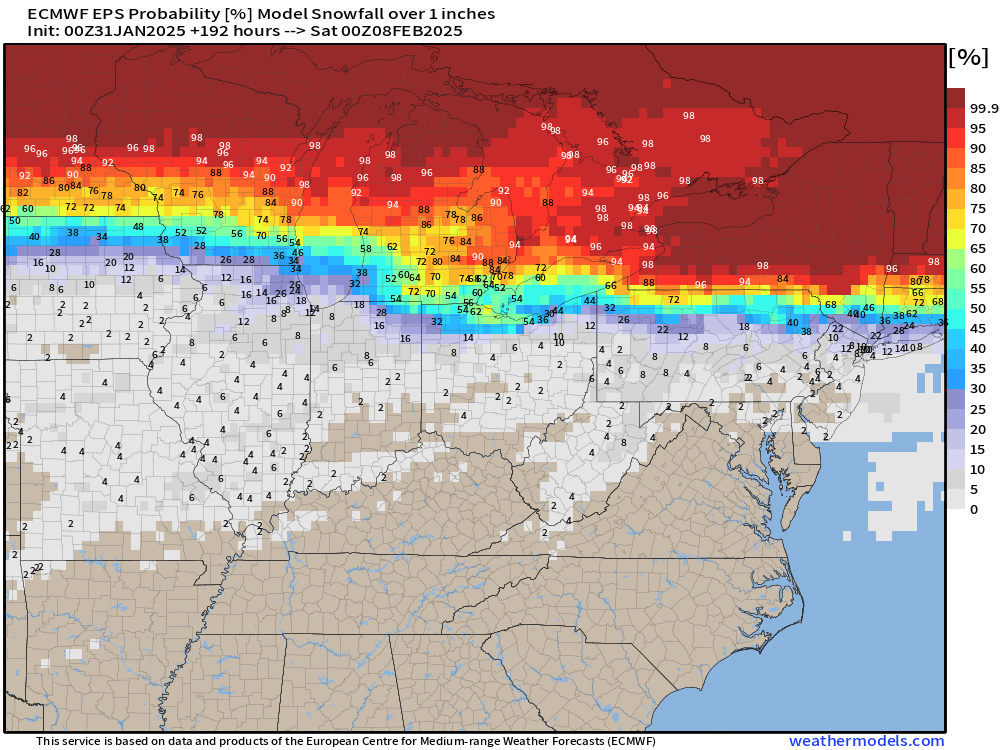
Day 8 - 15 has potential. Note first plot shows percent of ensembles with >1" of snow/sleet/ice, while latter shows pct > 6" ...
-
132 Baltimore- and DC-area winters Ranked (October - January)
dallen7908 replied to dallen7908's topic in Mid Atlantic
Sorry for the confusion, these rankings only consider snow that falls during the fall and early winter (through January 31). I'll update at the end of February. -
132 Baltimore- and DC-area winters Ranked (October - January)
dallen7908 replied to dallen7908's topic in Mid Atlantic
https://www.jstor.org/stable/207470?seq=1 Is this accessible? It is a contemporary story on the winter of 1917-1918. -
DC's winter to date has been better than 61% of past winters, while Baltimore's winter has been better than 56% of past winters Ranking: [#Days with mean T <=32[ + [inches of snow]+ [days with 1 inch on the ground] + [max(24hr snow -5",0) ] Washington DC dc Rank YEAR T<=32 Snow MECSb D>1" Points Grade PCTL 1 1917-1918 47.0 34.4 6.0 37.0 124.4 A++ 100 2 1904-1905 37.0 30.7 2.0 28.0 97.7 A- 99 3 1921-1922 24.0 37.0 16.0 14.0 91.0 A- 98 4 1903-1904 46.0 18.4 0.6 23.0 88.0 B+ 98 5 1960-1961 33.0 22.3 4.7 27.0 87.0 B+ 97 6 1908-1909 21.0 28.7 8.5 22.0 80.2 B 96 7 1924-1925 30.0 20.2 0.0 27.0 77.2 B 95 8 1987-1988 22.0 24.6 7.8 22.0 76.4 B 95 9 1939-1940 30.0 20.1 4.7 21.0 75.8 B 94 10 1934-1935 20.0 28.4 7.0 19.0 74.4 B 93 11 1976-1977 39.0 11.1 0.0 24.0 74.1 B 92 12 1962-1963 31.0 18.3 0.7 24.0 74.0 B 92 13 1929-1930 30.0 18.9 6.5 17.0 72.4 B 91 14 1995-1996 24.0 25.6 8.0 13.0 70.6 B- 90 15 1910-1911 28.0 22.4 0.0 19.0 69.4 B- 89 16 1911-1912 27.0 17.5 1.1 19.0 64.6 B- 89 17 2009-2010 19.0 24.0 11.4 9.0 63.4 B- 88 18 1919-1920 37.0 8.5 0.0 17.0 62.5 C+ 87 19 1981-1982 25.0 17.0 1.4 19.0 62.4 C+ 86 20 1963-1964 26.0 15.3 0.6 19.0 60.9 C+ 86 Rank YEAR T<=32 Snow MECSb D>1" Points Grade PCTL 21 1989-1990 24.0 12.7 0.0 24.0 60.7 C+ 85 22 1935-1936 29.0 14.0 0.0 17.0 60.0 C+ 84 23 1967-1968 26.0 16.0 1.9 15.0 58.9 C+ 83 24 1945-1946 26.0 17.1 0.0 14.0 57.1 C+ 83 25 1965-1966 21.0 21.5 8.9 5.0 56.4 C+ 82 26 1909-1910 27.0 13.4 0.0 14.0 54.4 C+ 81 27 1947-1948 29.0 15.8 0.4 9.0 54.2 C+ 80 28 1898-1899 29.0 14.7 0.0 10.0 53.7 C 80 29 1896-1897 33.0 10.2 0.0 10.0 53.2 C 79 30 1938-1939 20.0 14.8 1.5 15.0 51.3 C 78 31 1894-1895 24.0 11.3 0.0 16.0 51.3 C 77 32 1999-2000 19.0 14.5 4.3 12.0 49.8 C 77 33 1977-1978 26.0 10.6 0.0 13.0 49.6 C 76 34 2002-2003 26.0 11.6 1.1 10.0 48.7 C 75 35 2015-2016 12.0 18.8 7.8 9.0 47.6 C 74 36 1966-1967 13.0 17.4 3.2 14.0 47.6 C 73 37 1916-1917 25.0 13.3 0.0 9.0 47.3 C 73 38 1986-1987 11.0 20.8 5.8 9.0 46.6 C 72 39 1953-1954 14.0 18.0 2.9 11.0 45.9 C 71 40 1914-1915 30.0 5.5 0.0 9.0 44.5 C- 70 Rank YEAR T<=32 Snow MECSb D>1" Points Grade PCTL 41 1969-1970 24.0 10.4 0.0 10.0 44.4 C- 70 42 1955-1956 33.0 7.3 0.0 4.0 44.3 C- 69 43 1927-1928 19.0 13.1 5.5 6.0 43.6 C- 68 44 2003-2004 22.0 12.4 0.0 9.0 43.4 C- 67 45 1932-1933 13.0 14.5 6.5 9.0 43.0 C- 67 46 1900-1901 27.0 8.8 0.0 7.0 42.8 C- 66 47 1970-1971 27.0 10.0 0.0 5.0 42.0 C- 65 48 1983-1984 26.0 6.8 0.0 9.0 41.8 C- 64 49 1993-1994 24.0 6.1 0.0 11.0 41.1 C- 64 50 1942-1943 21.0 12.0 0.0 8.0 41.0 C- 63 51 2010-2011 24.0 9.4 0.0 7.0 40.4 C- 62 52 2024-2025 17.0 8.4 2.2 11.0 38.6 C- 61 53 1957-1958 16.0 12.6 6.1 3.0 37.7 C- 61 54 1925-1926 23.0 5.6 0.0 9.0 37.6 C- 60 55 1901-1902 27.0 7.6 0.0 3.0 37.6 C- 59 56 1984-1985 18.0 10.3 0.0 9.0 37.3 C- 58 57 1956-1957 17.0 10.3 0.0 10.0 37.3 C- 58 58 1958-1959 29.0 4.9 0.0 3.0 36.9 C- 57 59 1964-1965 17.0 9.8 0.0 10.0 36.8 C- 56 60 2004-2005 23.0 6.5 0.0 7.0 36.5 C- 55 Rank YEAR T<=32 Snow MECSb D>1" Points Grade PCTL 61 2000-2001 27.0 4.4 0.0 5.0 36.4 C- 55 62 2013-2014 19.0 8.1 0.0 9.0 36.1 C- 54 63 1899-1900 21.0 4.0 0.0 10.0 35.0 D+ 53 64 2021-2022 14.0 12.3 1.9 6.0 34.2 D+ 52 65 1915-1916 17.0 9.5 0.2 7.0 33.7 D+ 52 66 1944-1945 27.0 5.6 0.0 1.0 33.6 D+ 51 67 1926-1927 25.0 3.3 0.0 5.0 33.3 D+ 50 68 1902-1903 25.0 5.2 0.0 3.0 33.2 D+ 49 69 2018-2019 8.0 12.9 3.3 7.0 31.2 D+ 48 70 1980-1981 23.0 4.5 0.0 3.0 30.5 D+ 48 71 1906-1907 21.0 5.1 0.0 4.0 30.1 D+ 47 72 1897-1898 20.0 8.0 0.0 2.0 30.0 D+ 46 73 1950-1951 18.0 6.2 0.0 4.0 28.2 D+ 45 74 1905-1906 11.0 8.3 0.0 8.0 27.3 D+ 45 75 1893-1894 17.0 5.3 0.0 5.0 27.3 D+ 44 76 1943-1944 18.0 4.1 0.0 5.0 27.1 D+ 43 77 1973-1974 7.0 12.5 1.0 6.0 26.5 D 42 78 1961-1962 18.0 4.5 0.0 4.0 26.5 D 42 79 1933-1934 19.0 3.5 0.0 4.0 26.5 D 41 80 1930-1931 21.0 2.5 0.0 3.0 26.5 D 40 Rank YEAR T<=32 Snow MECSb D>1" Points Grade PCTL 81 1907-1908 17.0 4.7 0.0 4.0 25.7 D 39 82 1937-1938 22.0 1.5 0.0 2.0 25.5 D 39 83 1968-1969 25.0 0.2 0.0 0.0 25.2 D 38 84 2017-2018 19.0 3.1 0.0 3.0 25.1 D 37 85 1978-1979 14.0 7.1 0.0 4.0 25.1 D 36 86 2023-2024 9.0 7.9 0.0 8.0 24.9 D 36 87 1951-1952 15.0 6.4 0.0 3.0 24.4 D 35 88 2008-2009 20.0 1.9 0.0 2.0 23.9 D 34 89 1985-1986 19.0 2.5 0.0 2.0 23.5 D 33 90 1948-1949 7.0 11.8 0.7 4.0 23.5 D 33 91 1940-1941 15.0 4.7 0.0 3.0 22.7 D 32 92 1895-1896 19.0 1.4 0.0 2.0 22.4 D 31 93 1979-1980 8.0 8.9 0.0 5.0 21.9 D 30 94 1982-1983 9.0 6.6 1.6 4.0 21.2 D 30 95 1912-1913 7.0 7.1 1.5 5.0 20.6 D 29 96 1928-1929 20.0 0.5 0.0 0.0 20.5 D 28 97 1954-1955 16.0 2.4 0.0 1.0 19.4 D 27 98 1946-1947 10.0 6.3 0.0 3.0 19.3 D 27 99 1991-1992 13.0 4.0 0.0 2.0 19.0 D 26 100 1990-1991 7.0 7.8 0.0 4.0 18.8 D 25 Rank YEAR T<=32 Snow MECSb D>1" Points Grade PCTL 101 1998-1999 15.0 2.7 0.0 1.0 18.7 D 24 102 1923-1924 14.0 2.7 0.0 2.0 18.7 D 23 103 1988-1989 12.0 4.1 0.0 2.0 18.1 D 23 104 1941-1942 14.0 2.0 0.0 2.0 18.0 D 22 105 1920-1921 16.0 2.0 0.0 0.0 18.0 D 21 106 2005-2006 10.0 4.8 0.0 3.0 17.8 D- 20 107 2014-2015 9.0 3.6 0.0 5.0 17.6 D- 20 108 1922-1923 11.0 4.9 0.0 1.0 16.9 D- 19 109 1996-1997 12.0 2.7 0.0 2.0 16.7 D- 18 110 1975-1976 15.0 0.5 0.0 0.0 15.5 D- 17 111 2007-2008 8.0 3.9 0.0 3.0 14.9 D- 17 112 2006-2007 12.0 1.3 0.0 1.0 14.3 D- 16 113 1952-1953 7.0 5.0 0.0 2.0 14.0 D- 15 114 1974-1975 4.0 6.7 0.0 3.0 13.7 D- 14 115 1918-1919 13.0 0.5 0.0 0.0 13.5 D- 14 116 1972-1973 13.0 0.0 0.0 0.0 13.0 D- 13 117 1913-1914 12.0 0.0 0.0 0.0 12.0 D- 12 118 1971-1972 9.0 1.8 0.0 1.0 11.8 D- 11 119 1994-1995 5.0 3.9 0.0 2.0 10.9 D- 11 120 2016-2017 8.0 1.4 0.0 1.0 10.4 D- 10 Rank YEAR T<=32 Snow MECSb D>1" Points Grade PCTL 121 1959-1960 10.0 0.0 0.0 0.0 10.0 D- 9 122 2001-2002 5.0 2.7 0.0 1.0 8.7 F 8 123 2020-2021 6.0 2.6 0.0 0.0 8.6 F 8 124 1936-1937 7.0 1.5 0.0 0.0 8.5 F 7 125 2011-2012 5.0 1.7 0.0 1.0 7.7 F 6 126 2012-2013 5.0 1.1 0.0 0.0 6.1 F 5 127 1992-1993 4.0 1.0 0.0 0.0 5.0 F 5 128 2019-2020 4.0 0.6 0.0 0.0 4.6 F 4 129 1949-1950 3.0 0.3 0.0 0.0 3.3 F 3 130 2022-2023 3.0 0.0 0.0 0.0 3.0 F 2 131 1931-1932 2.0 1.0 0.0 0.0 3.0 F 2 132 1997-1998 2.0 0.1 0.0 0.0 2.1 F 1 Baltimore baltimore Rank YEAR T<=32 Snow MECSb D>1" Points Grade PCTL 1 1917-1918 47.0 32.5 6.0 27.0 112.5 A+ 100 2 1904-1905 39.0 35.1 5.4 31.0 110.5 A+ 99 3 1960-1961 38.0 30.1 7.0 32.0 107.1 A 98 4 1903-1904 48.0 21.4 1.0 27.0 97.4 A- 98 5 1921-1922 22.0 40.1 19.5 14.0 95.6 A- 97 6 1995-1996 29.0 35.9 13.5 15.0 93.4 A- 96 7 1924-1925 25.0 23.0 6.0 30.0 84.0 B+ 95 8 2009-2010 29.0 27.0 12.0 13.0 81.0 B+ 95 9 1939-1940 32.0 16.5 1.0 30.0 79.5 B 94 10 1976-1977 46.0 11.1 0.0 19.0 76.1 B 93 11 1909-1910 27.0 25.5 5.2 18.0 75.7 B 92 12 2015-2016 15.0 30.0 20.5 10.0 75.5 B 92 13 1944-1945 29.0 14.4 2.0 30.0 75.4 B 91 14 1981-1982 35.0 17.2 1.1 21.0 74.3 B 90 15 1962-1963 34.0 15.7 0.0 24.0 73.7 B 89 16 1963-1964 29.0 20.0 5.8 18.0 72.8 B 89 17 1929-1930 29.0 19.4 4.0 20.0 72.4 B 88 18 2002-2003 36.0 15.0 2.4 15.0 68.4 B- 87 19 1999-2000 21.0 23.3 10.6 12.0 66.9 B- 86 20 1934-1935 22.0 21.3 7.5 15.0 65.8 B- 86 Rank YEAR T<=32 Snow MECSb D>1" Points Grade PCTL 21 1989-1990 27.0 14.5 0.0 24.0 65.5 B- 85 22 1910-1911 26.0 17.8 2.5 19.0 65.3 B- 84 23 1938-1939 20.0 18.6 3.6 23.0 65.2 B- 83 24 1969-1970 33.0 15.1 1.1 15.0 64.2 B- 83 25 2003-2004 30.0 18.0 0.0 16.0 64.0 B- 82 26 1967-1968 31.0 15.5 3.4 13.0 62.9 C+ 81 27 1987-1988 22.0 20.2 2.5 18.0 62.7 C+ 80 28 1935-1936 26.0 15.3 0.0 21.0 62.3 C+ 80 29 2010-2011 37.0 11.9 2.6 10.0 61.5 C+ 79 30 1955-1956 37.0 9.9 0.0 14.0 60.9 C+ 78 31 1966-1967 22.0 20.8 6.0 12.0 60.8 C+ 77 32 1945-1946 23.0 15.0 2.6 20.0 60.6 C+ 77 33 1965-1966 27.0 21.4 6.0 6.0 60.4 C+ 76 34 1986-1987 16.0 25.1 8.4 9.0 58.5 C+ 75 35 1977-1978 34.0 13.5 0.0 11.0 58.5 C+ 74 36 1911-1912 25.0 14.4 0.0 18.0 57.4 C+ 73 37 1919-1920 34.0 7.2 0.0 16.0 57.2 C+ 73 38 2013-2014 31.0 12.7 0.1 13.0 56.8 C+ 72 39 1902-1903 26.0 13.8 0.0 17.0 56.8 C+ 71 40 1916-1917 22.0 16.4 0.0 16.0 54.4 C+ 70 Rank YEAR T<=32 Snow MECSb D>1" Points Grade PCTL 41 1896-1897 29.0 10.9 0.0 14.0 53.9 C 70 42 1983-1984 32.0 8.4 0.0 13.0 53.4 C 69 43 1908-1909 15.0 18.5 0.9 18.0 52.4 C 68 44 2000-2001 39.0 5.0 0.0 7.0 51.0 C 67 45 1898-1899 26.0 15.6 0.0 9.0 50.6 C 67 46 1953-1954 16.0 19.6 1.2 13.0 49.8 C 66 47 1927-1928 18.0 15.8 9.3 6.0 49.1 C 65 48 1947-1948 23.0 13.0 0.0 12.0 48.0 C 64 49 1993-1994 30.0 7.8 0.0 10.0 47.8 C 64 50 1961-1962 32.0 12.4 0.0 3.0 47.4 C 63 51 1964-1965 23.0 9.1 0.0 14.0 46.1 C 62 52 1970-1971 30.0 10.4 0.0 5.0 45.4 C 61 53 1942-1943 23.0 11.6 0.0 10.0 44.6 C- 61 54 1932-1933 12.0 14.8 5.5 12.0 44.3 C- 60 55 1958-1959 37.0 2.6 0.0 3.0 42.6 C- 59 56 2017-2018 28.0 6.5 0.0 8.0 42.5 C- 58 57 1984-1985 23.0 9.2 0.0 10.0 42.2 C- 58 58 2021-2022 16.0 13.3 1.8 11.0 42.1 C- 57 59 2024-2025 21.0 8.9 1.6 10.0 41.5 C- 56 60 1957-1958 21.0 11.0 2.8 6.0 40.8 C- 55 Rank YEAR T<=32 Snow MECSb D>1" Points Grade PCTL 61 2004-2005 24.0 7.6 0.0 8.0 39.6 C- 55 62 1980-1981 32.0 4.3 0.0 3.0 39.3 C- 54 63 1901-1902 28.0 7.4 0.6 3.0 39.0 C- 53 64 1925-1926 23.0 6.2 0.0 9.0 38.2 C- 52 65 1894-1895 20.0 5.0 0.0 13.0 38.0 C- 52 66 1914-1915 25.0 5.2 0.0 7.0 37.2 C- 51 67 2018-2019 20.0 9.5 0.0 7.0 36.5 C- 50 68 1950-1951 27.0 5.5 0.0 4.0 36.5 C- 49 69 1906-1907 22.0 7.5 0.0 7.0 36.5 C- 48 70 1998-1999 19.0 7.0 0.0 10.0 36.0 C- 48 71 2014-2015 23.0 6.4 0.0 6.0 35.4 D+ 47 72 1933-1934 19.0 8.3 0.0 8.0 35.3 D+ 46 73 1956-1957 16.0 10.9 0.0 8.0 34.9 D+ 45 74 2008-2009 29.0 2.7 0.0 3.0 34.7 D+ 45 75 1996-1997 27.0 5.5 0.0 2.0 34.5 D+ 44 76 1968-1969 30.0 4.4 0.0 0.0 34.4 D+ 43 77 1926-1927 27.0 2.8 0.0 4.0 33.8 D+ 42 78 1973-1974 18.0 9.5 1.0 5.0 33.5 D+ 42 79 1978-1979 18.0 9.4 0.0 6.0 33.4 D+ 41 80 1900-1901 18.0 6.5 0.0 7.0 31.5 D+ 40 Rank YEAR T<=32 Snow MECSb D>1" Points Grade PCTL 81 1951-1952 22.0 7.1 0.0 2.0 31.1 D+ 39 82 1985-1986 26.0 2.6 0.0 2.0 30.6 D+ 39 83 2007-2008 19.0 7.2 0.0 4.0 30.2 D+ 38 84 1899-1900 20.0 3.2 0.0 7.0 30.2 D+ 37 85 1954-1955 26.0 2.7 0.0 1.0 29.7 D+ 36 86 1982-1983 14.0 8.4 1.7 5.0 29.1 D+ 36 87 1897-1898 16.0 8.0 0.0 4.0 28.0 D+ 35 88 1988-1989 16.0 6.9 0.0 5.0 27.9 D+ 34 89 1943-1944 15.0 5.9 0.0 7.0 27.9 D+ 33 90 1915-1916 17.0 5.9 0.0 5.0 27.9 D+ 33 91 1948-1949 7.0 11.0 1.8 8.0 27.8 D+ 32 92 1975-1976 24.0 2.4 0.0 1.0 27.4 D+ 31 93 2023-2024 10.0 9.1 0.0 8.0 27.1 D+ 30 94 1990-1991 13.0 9.0 0.0 5.0 27.0 D+ 30 95 1922-1923 13.0 9.6 0.0 4.0 26.6 D 29 96 1905-1906 10.0 6.9 0.7 9.0 26.6 D 28 97 2005-2006 14.0 6.5 0.0 5.0 25.5 D 27 98 1979-1980 16.0 5.1 0.0 4.0 25.1 D 27 99 1940-1941 12.0 7.0 0.0 6.0 25.0 D 26 100 1991-1992 21.0 2.2 0.0 1.0 24.2 D 25 Rank YEAR T<=32 Snow MECSb D>1" Points Grade PCTL 101 1952-1953 12.0 8.2 0.0 3.0 23.2 D 24 102 1946-1947 9.0 9.8 0.0 4.0 22.8 D 23 103 1907-1908 13.0 4.7 0.0 5.0 22.7 D 23 104 1972-1973 21.0 0.0 0.0 0.0 21.0 D 22 105 2020-2021 12.0 5.9 0.0 2.0 19.9 D 21 106 1895-1896 17.0 1.2 0.0 1.0 19.2 D 20 107 2006-2007 16.0 0.9 0.0 2.0 18.9 D 20 108 1930-1931 15.0 2.8 0.0 1.0 18.8 D 19 109 1974-1975 10.0 5.5 0.0 3.0 18.5 D 18 110 1937-1938 15.0 2.2 0.0 1.0 18.2 D 17 111 1893-1894 14.0 1.2 0.0 3.0 18.2 D 17 112 1941-1942 13.0 3.1 0.0 2.0 18.1 D 16 113 1928-1929 16.0 1.1 0.0 1.0 18.1 D 15 114 1959-1960 14.0 1.8 0.0 1.0 16.8 D- 14 115 1923-1924 12.0 2.4 0.0 2.0 16.4 D- 14 116 2001-2002 12.0 2.3 0.0 2.0 16.3 D- 13 117 2012-2013 8.0 4.3 0.0 3.0 15.3 D- 12 118 1971-1972 12.0 2.1 0.0 1.0 15.1 D- 11 119 1992-1993 11.0 2.9 0.0 0.0 13.9 D- 11 120 2019-2020 11.0 1.8 0.0 1.0 13.8 D- 10 Rank YEAR T<=32 Snow MECSb D>1" Points Grade PCTL 121 2016-2017 13.0 0.7 0.0 0.0 13.7 D- 9 122 2011-2012 9.0 1.3 0.0 3.0 13.3 D- 8 123 1918-1919 12.0 1.3 0.0 0.0 13.3 D- 8 124 1920-1921 12.0 1.1 0.0 0.0 13.1 D- 7 125 1912-1913 5.0 4.9 0.0 3.0 12.9 D- 6 126 1994-1995 10.0 0.5 0.0 0.0 10.5 D- 5 127 1997-1998 8.0 1.1 0.0 0.0 9.1 D- 5 128 1913-1914 9.0 0.0 0.0 0.0 9.0 D- 4 129 1936-1937 6.0 2.8 0.0 0.0 8.8 F 3 130 2022-2023 5.0 0.0 0.0 0.0 5.0 F 2 131 1931-1932 2.0 1.7 0.0 0.0 3.7 F 2 132 1949-1950 3.0 0.5 0.0 0.0 3.5 F 1
-

-
January Medium/Long Range: A snowy January ahead?
dallen7908 replied to mappy's topic in Mid Atlantic
https://journals.ametsoc.org/view/journals/bams/101/6/bamsD190014.xml ok, only tangentially related, but if you're in the mood to read about some real cold - and Laura Ingalls Wilder - check out the link. -
January Medium/Long Range: A snowy January ahead?
dallen7908 replied to mappy's topic in Mid Atlantic
https://www.cpc.ncep.noaa.gov/products/predictions/610day/fxus06.html The amplified mid-level pattern leads to a generally confident precipitation forecast, with better model agreement compared to yesterday regarding a more suppressed storm track in the East. Therefore, the highest chances for above-normal precipitation are highlighted across the Gulf Coast and coastal Southeast. However, given the cold air in place, there is some concern for wintry weather over some of these areas, as evidenced by the deterministic 12z GFS and ECMWF. -
January Medium/Long Range: A snowy January ahead?
dallen7908 replied to mappy's topic in Mid Atlantic
The control and 3 or 4 other members also show a MECS around the 23rd - so it's not just resolution driving the large snow amounts.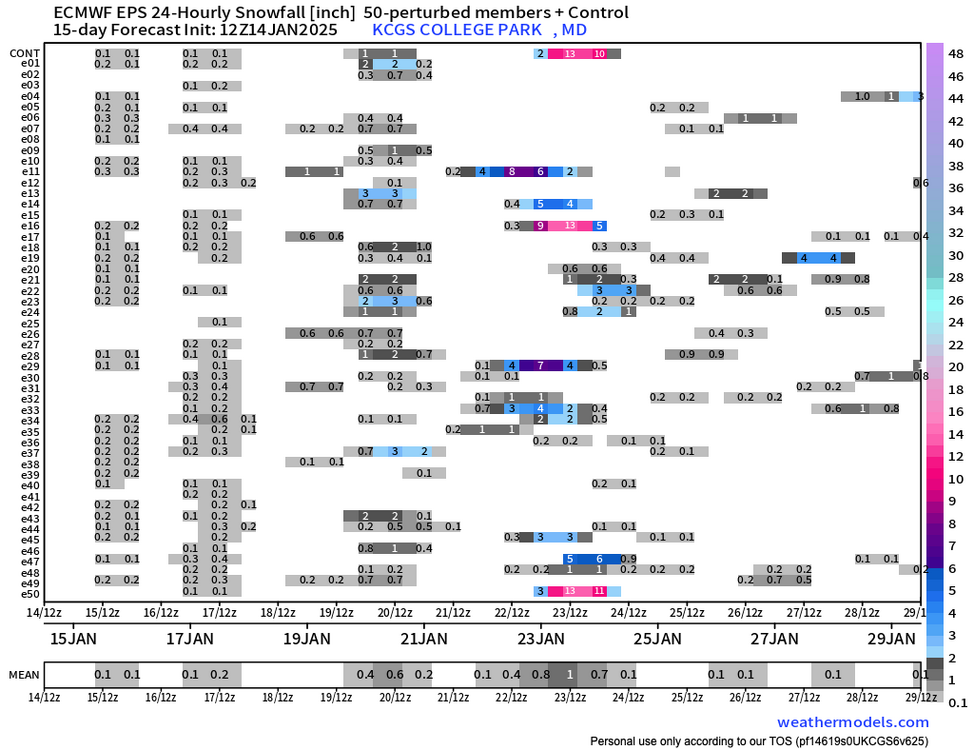
-
January Medium/Long Range: A snowy January ahead?
dallen7908 replied to mappy's topic in Mid Atlantic
If summing, remember to divide by 2 as these are 24-hour precipitation values for six-hour periods with every other one shown.
-
January Medium/Long Range: A snowy January ahead?
dallen7908 replied to mappy's topic in Mid Atlantic
I was in Seattle for the AMS meeting that week and recall that one of the lead CWG writers missed at least a half-day of the meeting because of the storm. -
January Medium/Long Range: A snowy January ahead?
dallen7908 replied to mappy's topic in Mid Atlantic
Correct, my statement was misleading. There are indeed two threat windows. The 6" threshold is only reached after the second. -
January Medium/Long Range: A snowy January ahead?
dallen7908 replied to mappy's topic in Mid Atlantic
Big game hunters should be excited about this map -Unfortunately, the best "threat" appears to be days 13-15 - see Bob Chill's caution about the decrease in predictability as we shift away from a blocking regime. Also, the 8-14 day outlook shows a confidence level of only 2 of 5 for the period.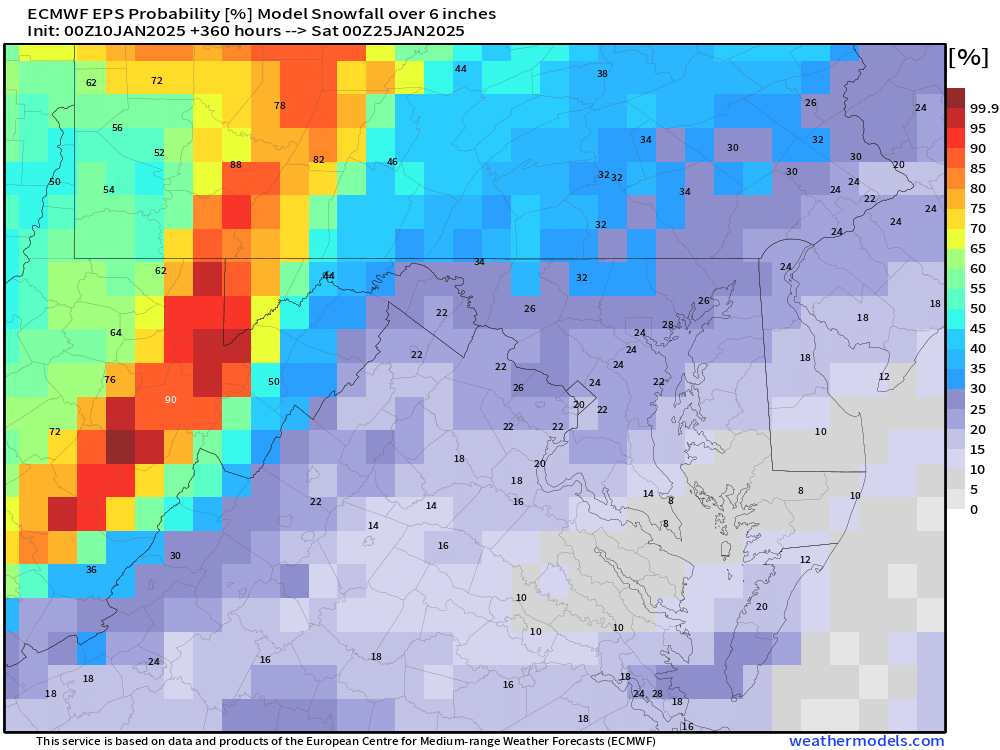
-
January Medium/Long Range: A snowy January ahead?
dallen7908 replied to mappy's topic in Mid Atlantic
I grew up about 40 miles northeast of Waterloo. 1977 was the coolest January in the history of Waterloo, Iowa. The average daily high temperature was 11.7 °F, and the average low was -11.9 °F. -
January Medium/Long Range: A snowy January ahead?
dallen7908 replied to mappy's topic in Mid Atlantic

-
January Medium/Long Range: A snowy January ahead?
dallen7908 replied to mappy's topic in Mid Atlantic
EPS Signal for the 20th - 22nd is still pretty weak. Note: Numbers show 24-hour snow fall totals for every other six-hour period Coloring shows 24-hour snow fall totals every six-hours.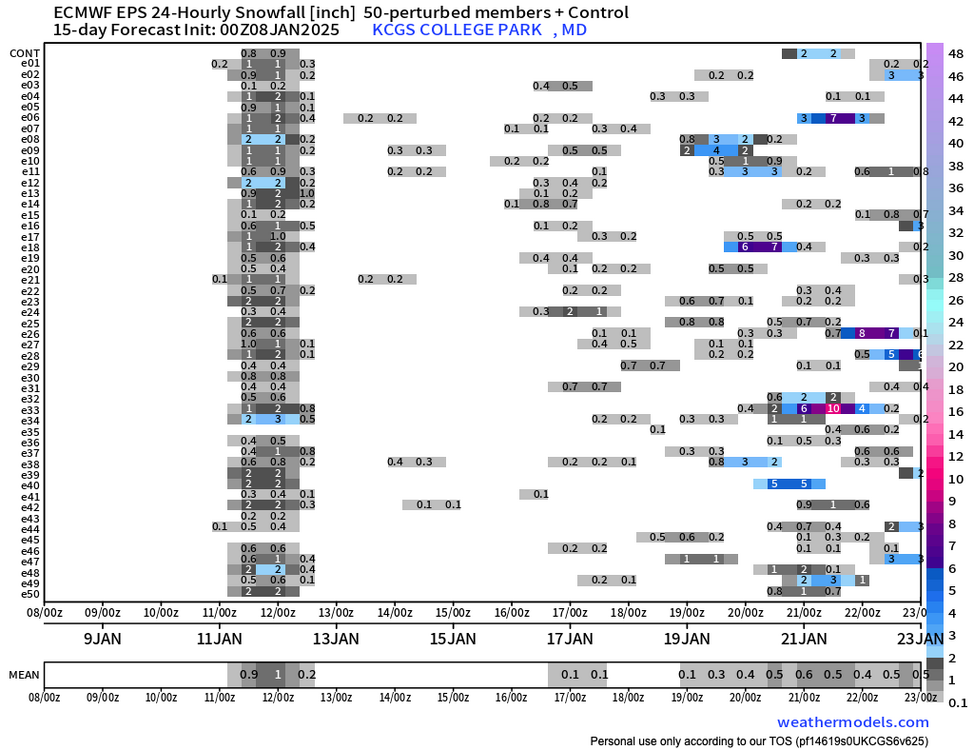
-
Certainly fun searching for the yard stick.