dallen7908
-
Posts
960 -
Joined
-
Last visited
Content Type
Profiles
Blogs
Forums
American Weather
Media Demo
Store
Gallery
Everything posted by dallen7908
-
Good luck all! I was supposed to put together a wish list for XMAS but got distracted but wasted by time perusing these articles from the winter of 2023-2024. Capital Weather Gang: “Thirteen things need to come into alignment to give a big snowstorm to the coastal plain – in a bad year they are uncorrelated – In 2023-2024 R was close to 1! January 25, 2024 was a January 25, 2000 redux but 50 miles further west . How to measure snow in a blizzard (hint don't slant stick or you'll lose the stick) How to make an igloo - the most googled phrase in Maryland last week Potassium or magnesium chloride: a quick guide With the five inches Baltimore received yesterday, it joined the 100-inch club The top ten snowstorms of 2023-2024 Rain-snow line? In 2023-2024 for DC, it was as simple as multiplying by 10. … and that is why there are 5 categories of a blizzard. Let's hope for several forum uniting storms!
-
Another great way to experience tomorrow's wind/rain event is to sign up for tomorrow morning's Lake Anna Triathlon, which is still on as of noon today "Good Morning Giant Acorn Athletes! Yes, we are watching the weather and yes the race is still on. Currently at Lake Anna they are calling for winds out of the north and rain. The Olympic swim will be 2 loops to keep athletes closer to shore. If we need to modify the event further we will. Keeping athletes safe while racing is what we do. Bring layers and a positive mindset! #gokinetic"
-
Here is Alfredo's Climate Bulletin for spring 2023. https://www2.atmos.umd.edu/~climate/Bulletin/bulletin_mdsco_spr23.pdf Points to highlight for spring 2023 are: 1) Spring 2023 was warmer and much drier than normal (i.e., 1991-2020 averages). 2) Spring 2023 precipitation and partial October 2022 - May 2023 water year were both below normal over the state. 3) Statewide, spring 2023 was the 9th driest among the 129 springs since 1895. 4) A significant warming trend in statewide mean temperature (1.9°F/century) is coincident with a significant decreasing trend in statewide heating degree-days (-162.57°FDD). 5) An increasing trend in the statewide partial October-May water year (2.31 in/century) is also found. 6) Regionally, mean temperature in spring showed a significant warming trend everywhere in the state, with maximum values over the Eastern Shore (above 2.0°F/century) and Baltimore City (2.8°F/century). 7) Regionally, accumulated total precipitation in spring showed significant increasing trends in two regions: Allegany County (1.4 in/century), and Baltimore and Harford counties (1.8 in/century). The seasonal bulletin is issued quarterly to indicate the state's recent surface temperature and precipitation conditions in a simple format, allowing Marylanders to understand regional climate variations better. This publication is part of our efforts to make the Maryland State Climatologist Office more visible across the State and be central to all discussions of regional climate variability and change. Please help disseminate this bulletin. Thank you, Alfredo (MD State Climatologist)
-
Good Afternoon, We now share the May 2023 Maryland Climate Bulletin. You can access it from the following link: https://www2.atmos.umd.edu/~climate/Bulletin/bulletin_mdsco_current.pdf Points to highlight are: 1) A colder and drier than normal May. 2) The largest deficits in precipitation occurred in the counties of the Piedmont. 3) Drought conditions occupied around 66% of the area of the state. Moderate drought conditions appeared in Charles and Prince George's counties and portions of Montgomery, Howard, Anne Arundel, Baltimore, Harford, and Cecil counties 4) Long-term trends (1895-2023) show significant warming trends from Washington County to the east. Notably, the largest trend (2°F/century) is over Baltimore City. Significant precipitation trends (above 1.0 in/century) are present in Allegany, Garrett, Frederick, Montgomery, Howard, Carroll, Baltimore counties, and Baltimore City. 5) Statewide precipitation was ranked 8th among the driest Mays since 1895. However, Baltimore City, Baltimore, and Howard counties recorded the driest May. 6) A significant warming trend in statewide mean temperature (1.0°F/century) is coincident with significant decreasing and increasing trends in statewide heating (-18.4°FDD) and cooling (15.9°FDD) degree-days for the period 1895-2023. A significant wetting trend (0.77 in/century) in statewide precipitation is also present for May. The bulletin is issued once per month to indicate the state's recent monthly surface temperature and precipitation conditions in a simple format, allowing Marylanders to understand regional climate variations better. This publication is part of our efforts to make the Maryland State Climatologist Office more visible across the State and be central to all discussions of regional climate variability and change. Please help disseminate this bulletin. from Alfredo
-
Here is the April 2023 Maryland Climate Bulletin prepared by state climatologist Alfredo Ruiz-Barradas https://www2.atmos.umd.edu/~climate/Bulletin/bulletin_mdsco_current.pdf Points to highlight are: 1) Warmer-than-normal conditions still persisted in the state since the beginning of the year. Wetter-than-normal conditions appeared on the western and eastern shores. 2) Statewide warm anomalies increased from March, and dry anomalies changed to wet anomalies. 3) While the extent of the surface under drought conditions (abnormally dry and moderate drouth) decreased from March to April, abnormally dry conditions developed to the west of Washington County. 4) Most counties had mean, maximum, and minimum temperatures within the top five warmest Aprils since 1895. The statewide maximum temperature was the warmest on record, while the mean temperature was the second warmest. 5) Significant, century-plus (1895-2023) warming trends are identified over the state, especially over Baltimore City (3.9°F/century). However, significant wet trends are only found over Allegany and Garrett counties (0.6 in/century). 6) A significant increasing trend in statewide mean temperature (2.8°F/century) is coincident with a significant decreasing trend in statewide heating degree-days (-84.21°FDD). The bulletin is issued once per month to indicate the state's recent monthly surface temperature and precipitation conditions in a simple format, allowing Marylanders to understand regional climate variations better. This publication is part of our efforts to make the Maryland State Climatologist Office more visible across the State and be central to all discussions of regional climate variability and change. Please help disseminate this bulletin. Thank you, Alfredo
-
Wish I were in the Palisades or perhaps preparing for tomorrow's Classique Alex Harvey at Mont-Saint-Anne. Weather looks great after today's snow showers tomorrow's high is expected to be 32F.

-
When I started at NASA-Goddard in the late 1980s there was still an ice skating club and a sign telling you whether the pond was safe for skating. I believe the last time any skating occurred there was December 1989. It was years before it was cold enough to skate there again and by then the club and sign were just memories. I'm probably misremembering but I believe the last good skating weather was February 2015.
-
Yet another excuse if 2023-2024 fails to deliver. "When Hunga Tonga–Hunga Ha‘apai (HTHH) erupted in January 2022, it shot the standard volcanic cocktail of ash, gas, and pulverized rock into the sky. But the eruption included one extra ingredient that’s now causing climate concerns: a significant splash of ocean water. The underwater caldera shot 146 metric megatons of water into the stratosphere like a geyser, potentially contributing to atmospheric warming over the next 5 years, according to a new study published in Nature Climate Change. The model calculated the monthly change in Earth’s energy balance caused by the eruption and showed that water vapor could increase the average global temperature by up to 0.035°C over the next 5 years. That’s a large anomaly for a single event, but it’s not outside the usual level of noise in the climate system, Jenkins said."
-
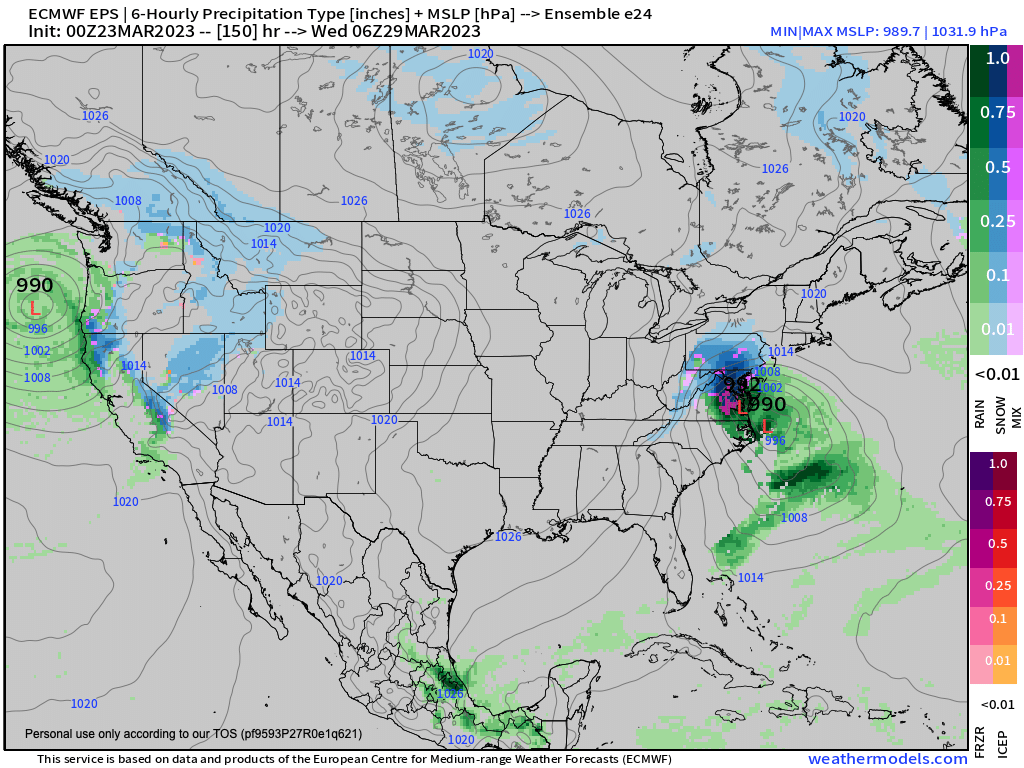
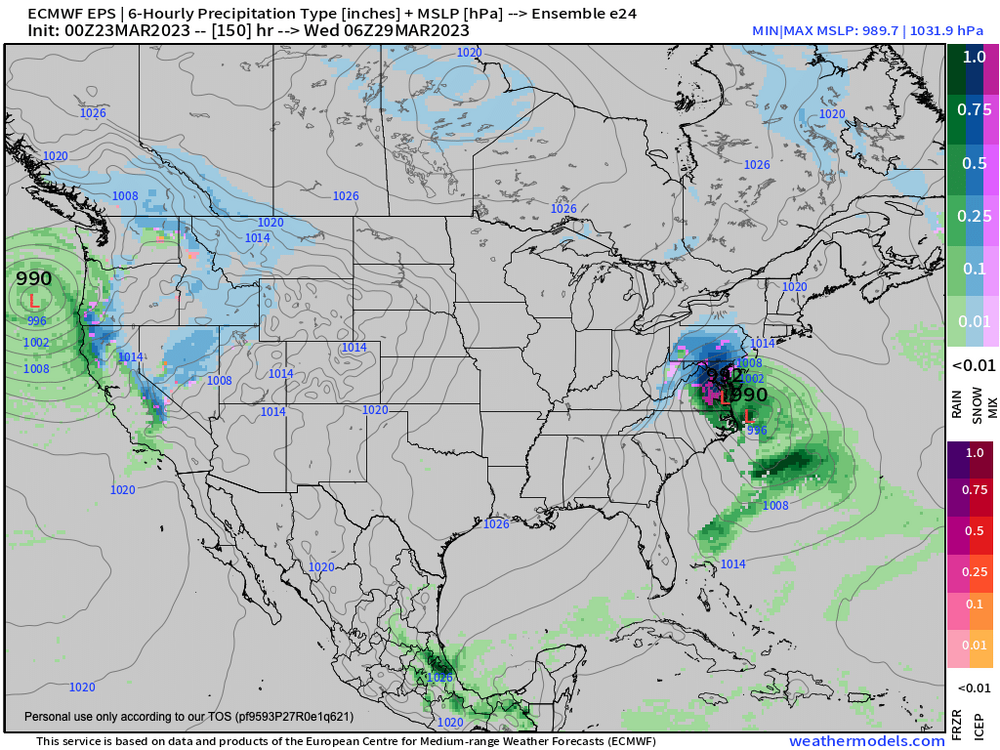
They must have really tweaked the IC on this EPS ensemble member.
-
Did you check out the Washington Post today. Apparently, Alaska is the #4 retirement "destination" in the U.S. behind Arizona, California, and Florida. You'll have company. Surprisingly, to people on this list, desire for snow is not believed to be the main reason.
-
Good to hear. One more in the unlikely camp versus the snowball chance in hell camp.
-
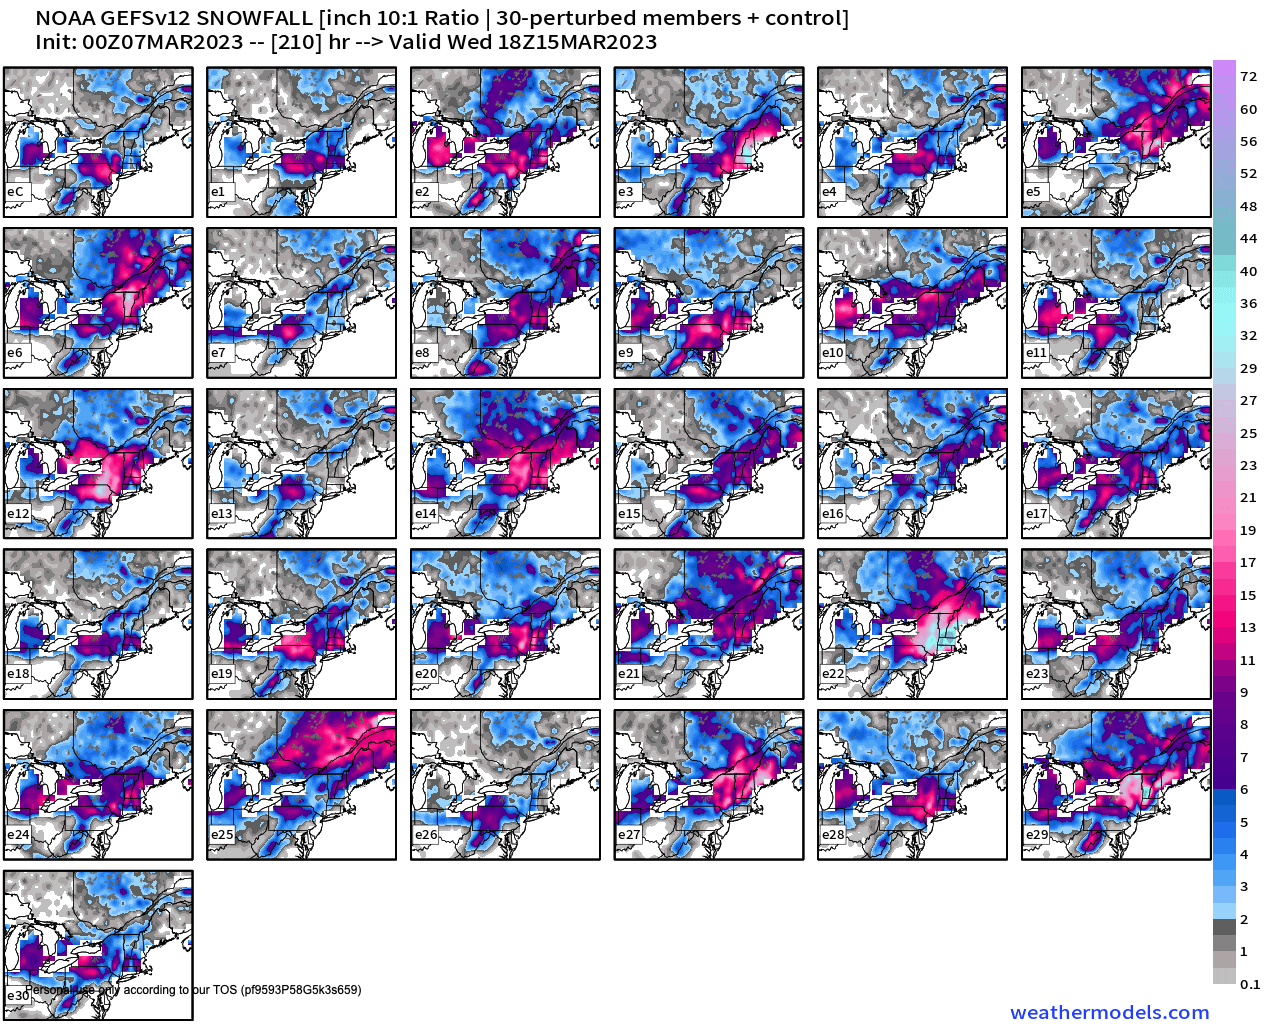
It's interesting that only one of the 31 06 UT GEFS members shows measurable snow around the 23rd in College Park. The 10-day mean snowfall for my backyard is about a 1/4 inch. Early-April numbers. While this could be chance, It really illustrates the fact that the parent model of the ensembles is not the operational model. It is an older version of the operational model. Hopefully the improvements matter here or perhaps the resolution.
-
EPS 10-day snow mean in my back yard for the last 5 runs: 5.5", 3.6", 3.2", 2.3", and today 12 UT 1.2". Tonight the rebound begins.
-
With respect to next week's chances, I feel like a 4th string point guard on a 7th grade basketball team warming up for the last game of the season. Will I finally score a basket? Spoiler alert, I never did score that basket - but I did make one of two free throws in the one minute I played in that last game. I went out for wrestling in 8th grade. Perhaps I'll track cold-rain-storms next year. Oh wait ... ... am encouraged to see the southern extent of the wintry precipitation next week and the general pattern
-
March Medium/Long Range Thread: The Empire Strikes Back
dallen7908 replied to stormtracker's topic in Mid Atlantic
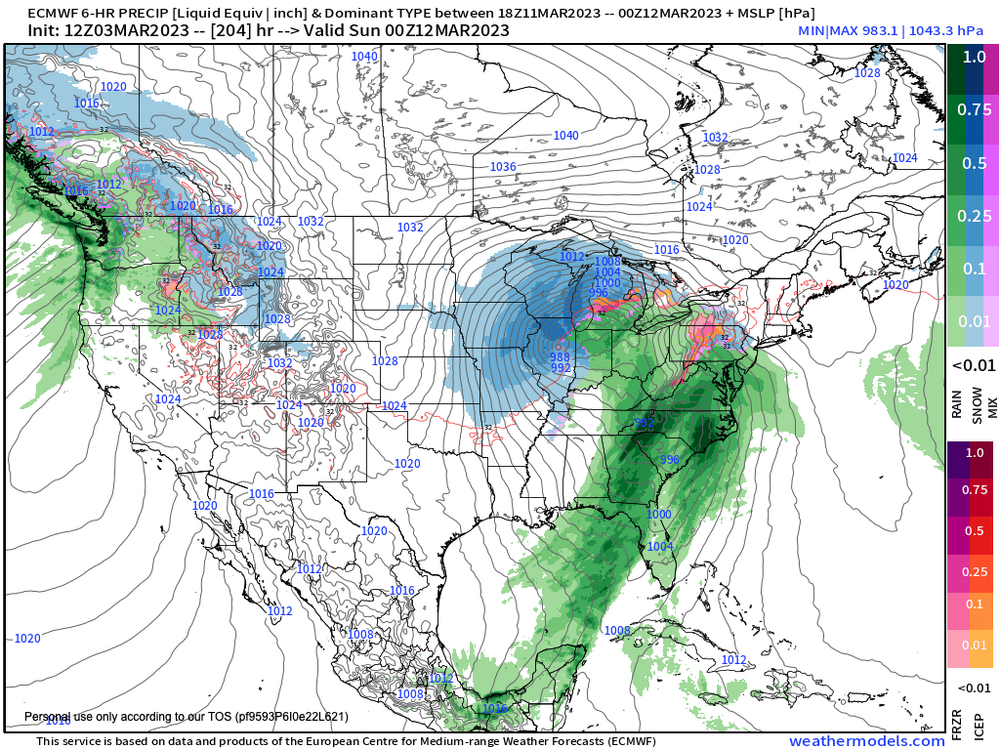
We don't know yet, it was the 00 UT EPS run from the 5th of March. -
March Medium/Long Range Thread: The Empire Strikes Back
dallen7908 replied to stormtracker's topic in Mid Atlantic
That's great. Only one of the 51 EPS members of the 12 UT suite gives the DC area no snow over the next 15 days. Mean is the 2nd highest its been all winter. -
March Medium/Long Range Thread: The Empire Strikes Back
dallen7908 replied to stormtracker's topic in Mid Atlantic
Perhaps they forgot to color in central MD? Certainly chase-able. The 6 UT ensembles are similar.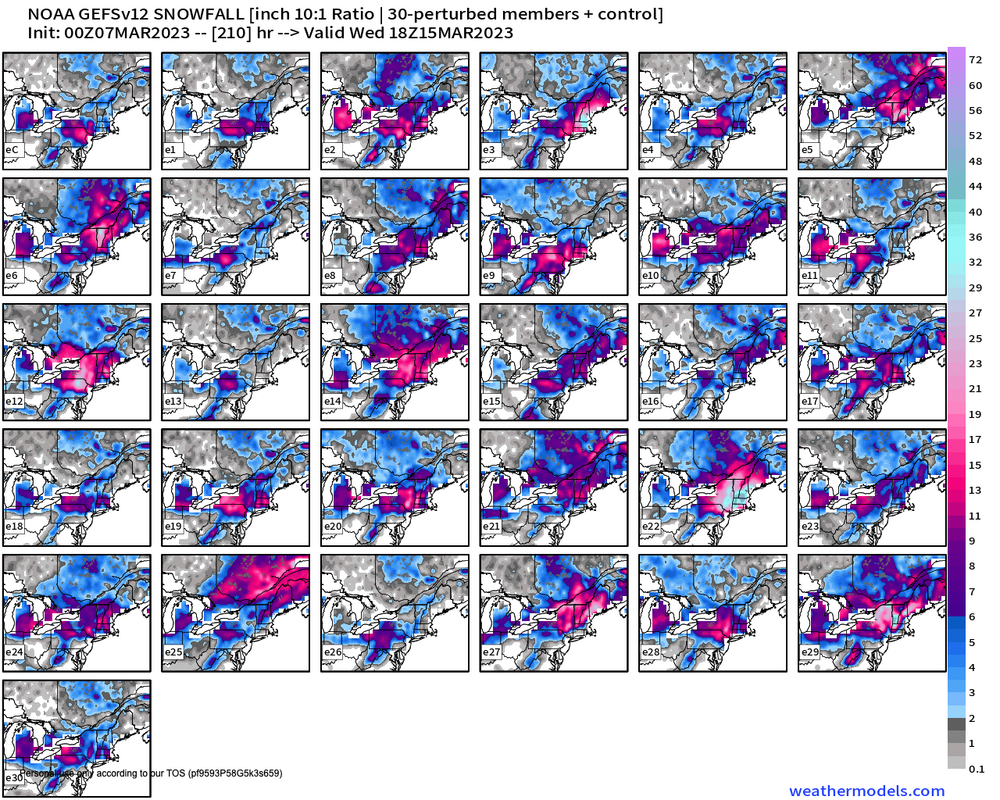
-
March Medium/Long Range Thread: The Empire Strikes Back
dallen7908 replied to stormtracker's topic in Mid Atlantic
-
March Medium/Long Range Thread: The Empire Strikes Back
dallen7908 replied to stormtracker's topic in Mid Atlantic
Well I was hoping to be up watching the snow fall -
March Medium/Long Range Thread: The Empire Strikes Back
dallen7908 replied to stormtracker's topic in Mid Atlantic
Rule of thumb based on Baltimore statistics over the last 130 years. Chances of a substantial event drop off by a factor of two between March 1 - 10th and March 11th - 20th and another factor of two between March 10-20 and March 21 -April 1. Chances essentially zero after that. Certainly the EPS mean snowfall totals for the next few weeks are as good as we've seen this "winter". CAPE's post about how good day 12-14 looks made me nostalgic for earlier this year when the events were only 10 days away. -
Yes any snow in March or even April would add to the DC total. With respect to 2009-2010, the measured amount at DCA was quite a bit lower than at nearby locations.
-
March Medium/Long Range Thread: The Empire Strikes Back
dallen7908 replied to stormtracker's topic in Mid Atlantic
Each fall I plan an extended trip to New England or Quebec and follow that location's weather too. This year I went to Quebec City spent 4 days Nordic skiing and also a couple of days at the Winter Carnival. I also did a walking tour of Quebec in what my sister called a blizzard. Fortunately, we arrived a few days after -47 - but they were still talking about it. -
March Medium/Long Range Thread: The Empire Strikes Back
dallen7908 replied to stormtracker's topic in Mid Atlantic
Yes, sometimes an ensemble of 4 operational models is as valuable as a 30 or 50 member ensemble of just one operational - non-dispersion for the loss -
March Medium/Long Range Thread: The Empire Strikes Back
dallen7908 replied to stormtracker's topic in Mid Atlantic
-
March Medium/Long Range Thread: The Empire Strikes Back
dallen7908 replied to stormtracker's topic in Mid Atlantic
Officially, they got 4.7" on the 19th, 3.5" on the 20th, and 0.2" on the 21st. Didn't even meet winter storm warning criteria.