dallen7908
-
Posts
960 -
Joined
-
Last visited
Content Type
Profiles
Blogs
Forums
American Weather
Media Demo
Store
Gallery
Everything posted by dallen7908
-
Snow / graupel squall in Columbia too. Briefly heavy.
-
Encouraging 3-4 week outlook. https://www.cpc.ncep.noaa.gov/products/predictions/WK34/
-
4th straight post mentioning/showing a positive trend?
-
Bottom line: Oct-Dec 2025 was the best start to winter since Oct-Dec 2017. DC had 8 days with a mean T of 32 or less, 1.5" of snow, and 0 days with >1" on the ground; while Baltimore had 11 days with a mean T of 32 or less, 2.0" of snow, and 4 days with >1" of snow on the ground. Ranking wise, the DC start-to-winter ranked 77th (9.5 points; 43rd PCTL; letter grade of D) of 133 winters while the Baltimore start-to-winter ranked 52nd (17 points; 62nd PCTL; letter grade of C-) of 133 winters One point is awarded for each day with a mean T of 32 or below. One point is also awarded for each day with at least 1" of snow on the ground. One point is also awarded for each inch of snow, and finally a MECs bonus of (Snowfall - 5) is added for 24-hour snow totals exceeding 5". dc Rank YEAR T<=32 Snow MECSb D>1" Points Grade PCTL 1 1989-1990 24.0 12.5 0.0 24.0 60.5 A++ 100 2 1904-1905 19.0 17.2 2.0 16.0 54.2 A++ 99 3 1910-1911 20.0 16.5 0.0 15.0 51.5 A+ 98 4 1917-1918 21.0 9.3 0.0 16.0 46.3 A 98 5 1960-1961 17.0 8.7 1.8 15.0 42.5 A- 97 6 1962-1963 14.0 16.2 0.7 11.0 41.9 A- 96 7 1932-1933 11.0 14.5 6.5 9.0 41.0 A- 95 8 2009-2010 7.0 16.6 10.0 7.0 40.6 A- 95 9 1966-1967 10.0 16.1 3.2 11.0 40.3 A- 94 10 1908-1909 8.0 15.0 3.5 12.0 38.5 B+ 93 11 1945-1946 14.0 10.3 0.0 11.0 35.3 B 92 12 1935-1936 14.0 11.0 0.0 10.0 35.0 B 92 13 1963-1964 16.0 6.4 0.6 9.0 32.0 B 91 14 1909-1910 16.0 6.7 0.0 8.0 30.7 B- 90 15 1916-1917 14.0 8.5 0.0 8.0 30.5 B- 89 16 1919-1920 17.0 4.8 0.0 7.0 28.8 B- 89 17 1967-1968 8.0 13.2 1.9 5.0 28.1 B- 88 18 1914-1915 18.0 3.5 0.0 6.0 27.5 C+ 87 19 1987-1988 5.0 11.5 6.5 4.0 27.0 C+ 86 20 1957-1958 5.0 12.3 6.1 3.0 26.4 C+ 86 Rank YEAR T<=32 Snow MECSb D>1" Points Grade PCTL 21 1903-1904 24.0 1.9 0.0 0.0 25.9 C+ 85 22 1898-1899 14.0 6.4 0.0 5.0 25.4 C+ 84 23 1955-1956 20.0 2.8 0.0 1.0 23.8 C 83 24 1938-1939 9.0 7.0 1.5 6.0 23.5 C 83 25 1896-1897 15.0 3.5 0.0 5.0 23.5 C 82 26 2002-2003 7.0 7.1 1.1 8.0 23.2 C 81 27 1929-1930 15.0 2.6 0.0 5.0 22.6 C 80 28 2000-2001 17.0 2.0 0.0 2.0 21.0 C 80 29 1973-1974 4.0 11.0 1.0 5.0 21.0 C 79 30 1933-1934 13.0 3.5 0.0 4.0 20.5 C 78 31 1950-1951 12.0 5.4 0.0 3.0 20.4 C 77 32 1958-1959 17.0 0.9 0.0 1.0 18.9 C- 77 33 1912-1913 5.0 7.1 1.5 5.0 18.6 C- 76 34 1930-1931 13.0 2.5 0.0 3.0 18.5 C- 75 35 1926-1927 10.0 3.0 0.0 5.0 18.0 C- 74 36 1942-1943 9.0 5.8 0.0 3.0 17.8 C- 74 37 1893-1894 11.0 3.3 0.0 3.0 17.3 C- 73 38 2005-2006 9.0 4.8 0.0 3.0 16.8 C- 72 39 1969-1970 6.0 6.8 0.0 4.0 16.8 C- 71 40 1951-1952 10.0 4.8 0.0 2.0 16.8 C- 71 Rank YEAR T<=32 Snow MECSb D>1" Points Grade PCTL 41 1915-1916 9.0 3.8 0.0 4.0 16.8 C- 70 42 1894-1895 8.0 2.6 0.0 6.0 16.6 C- 69 43 1924-1925 15.0 0.5 0.0 1.0 16.5 C- 68 44 1905-1906 6.0 5.5 0.0 5.0 16.5 C- 68 45 1982-1983 4.0 6.6 1.6 4.0 16.2 C- 67 46 1899-1900 9.0 1.8 0.0 5.0 15.8 D+ 66 47 1947-1948 11.0 3.6 0.0 1.0 15.6 D+ 65 48 1921-1922 7.0 5.5 0.0 3.0 15.5 D+ 65 49 1976-1977 13.0 1.4 0.0 1.0 15.4 D+ 64 50 1970-1971 10.0 5.2 0.0 0.0 15.2 D+ 63 51 2010-2011 12.0 2.1 0.0 1.0 15.1 D+ 62 52 1902-1903 12.0 3.0 0.0 0.0 15.0 D+ 62 53 1934-1935 7.0 3.0 0.0 4.0 14.0 D+ 61 54 1939-1940 4.0 4.8 0.0 5.0 13.8 D+ 60 55 1993-1994 8.0 2.6 0.0 3.0 13.6 D+ 59 56 1901-1902 13.0 0.5 0.0 0.0 13.5 D+ 59 57 1953-1954 4.0 6.7 1.5 1.0 13.2 D+ 58 58 1995-1996 10.0 1.8 0.0 1.0 12.8 D+ 57 59 1948-1949 5.0 4.4 0.0 3.0 12.4 D+ 56 60 1944-1945 10.0 2.2 0.0 0.0 12.2 D+ 56 Rank YEAR T<=32 Snow MECSb D>1" Points Grade PCTL 61 1925-1926 9.0 2.2 0.0 1.0 12.2 D+ 55 62 1952-1953 6.0 3.7 0.0 2.0 11.7 D 54 63 1900-1901 11.0 0.7 0.0 0.0 11.7 D 53 64 1927-1928 7.0 2.5 0.0 2.0 11.5 D 53 65 1983-1984 11.0 0.3 0.0 0.0 11.3 D 52 66 1895-1896 8.0 1.2 0.0 2.0 11.2 D 51 67 1943-1944 11.0 0.0 0.0 0.0 11.0 D 50 68 1897-1898 9.0 2.0 0.0 0.0 11.0 D 50 69 1985-1986 9.0 0.7 0.0 1.0 10.7 D 49 70 1961-1962 7.0 2.5 0.0 1.0 10.5 D 48 71 1906-1907 10.0 0.5 0.0 0.0 10.5 D 47 72 1977-1978 10.0 0.3 0.0 0.0 10.3 D 47 73 2003-2004 1.0 6.2 0.0 3.0 10.2 D 46 74 1937-1938 10.0 0.0 0.0 0.0 10.0 D 45 75 2017-2018 7.0 1.9 0.0 1.0 9.9 D 44 76 1907-1908 7.0 1.9 0.0 1.0 9.9 D 44 77 2025-2026 8.0 1.5 0.0 0.0 9.5 D 43 78 1988-1989 8.0 1.2 0.0 0.0 9.2 D 42 79 1946-1947 6.0 2.2 0.0 1.0 9.2 D 41 80 2004-2005 9.0 0.1 0.0 0.0 9.1 D 41 Rank YEAR T<=32 Snow MECSb D>1" Points Grade PCTL 81 1978-1979 4.0 3.1 0.0 2.0 9.1 D 40 82 1968-1969 9.0 0.0 0.0 0.0 9.0 D 39 83 1964-1965 7.0 0.7 0.0 1.0 8.7 D 38 84 1936-1937 7.0 1.5 0.0 0.0 8.5 D 38 85 1922-1923 6.0 1.8 0.0 0.0 7.8 D- 37 86 1981-1982 5.0 1.7 0.0 1.0 7.7 D- 36 87 1980-1981 7.0 0.3 0.0 0.0 7.3 D- 35 88 1920-1921 7.0 0.2 0.0 0.0 7.2 D- 35 89 1954-1955 7.0 0.1 0.0 0.0 7.1 D- 34 90 1990-1991 2.0 3.0 0.0 2.0 7.0 D- 33 91 2007-2008 2.0 2.6 0.0 2.0 6.6 D- 32 92 2013-2014 5.0 1.5 0.0 0.0 6.5 D- 32 93 1998-1999 6.0 0.5 0.0 0.0 6.5 D- 31 94 2008-2009 6.0 0.0 0.0 0.0 6.0 D- 30 95 1923-1924 2.0 1.7 0.0 2.0 5.7 D- 29 96 1928-1929 5.0 0.2 0.0 0.0 5.2 D- 29 97 1913-1914 5.0 0.0 0.0 0.0 5.0 D- 28 98 1971-1972 2.0 1.5 0.0 1.0 4.5 D- 27 99 1956-1957 4.0 0.2 0.0 0.0 4.2 D- 26 100 1911-1912 4.0 0.1 0.0 0.0 4.1 D- 26 Rank YEAR T<=32 Snow MECSb D>1" Points Grade PCTL 101 1991-1992 4.0 0.0 0.0 0.0 4.0 D- 25 102 1959-1960 4.0 0.0 0.0 0.0 4.0 D- 24 103 1918-1919 4.0 0.0 0.0 0.0 4.0 D- 23 104 1940-1941 2.0 1.5 0.0 0.0 3.5 F 23 105 1996-1997 3.0 0.4 0.0 0.0 3.4 F 22 106 1975-1976 3.0 0.4 0.0 0.0 3.4 F 21 107 1965-1966 3.0 0.2 0.0 0.0 3.2 F 20 108 1941-1942 3.0 0.2 0.0 0.0 3.2 F 20 109 2022-2023 3.0 0.0 0.0 0.0 3.0 F 19 110 2016-2017 3.0 0.0 0.0 0.0 3.0 F 18 111 2001-2002 3.0 0.0 0.0 0.0 3.0 F 17 112 1999-2000 3.0 0.0 0.0 0.0 3.0 F 17 113 1992-1993 2.0 1.0 0.0 0.0 3.0 F 16 114 1986-1987 3.0 0.0 0.0 0.0 3.0 F 15 115 1972-1973 3.0 0.0 0.0 0.0 3.0 F 14 116 2018-2019 1.0 1.4 0.0 0.0 2.4 F 14 117 2024-2025 2.0 0.1 0.0 0.0 2.1 F 13 118 2006-2007 2.0 0.0 0.0 0.0 2.0 F 12 119 1949-1950 2.0 0.0 0.0 0.0 2.0 F 11 120 1931-1932 1.0 1.0 0.0 0.0 2.0 F 11 Rank YEAR T<=32 Snow MECSb D>1" Points Grade PCTL 121 2019-2020 1.0 0.4 0.0 0.0 1.4 F 10 122 1984-1985 1.0 0.3 0.0 0.0 1.3 F 9 123 1979-1980 1.0 0.3 0.0 0.0 1.3 F 8 124 2023-2024 1.0 0.1 0.0 0.0 1.1 F 8 125 1997-1998 1.0 0.1 0.0 0.0 1.1 F 7 126 2020-2021 1.0 0.0 0.0 0.0 1.0 F 6 127 2014-2015 1.0 0.0 0.0 0.0 1.0 F 5 128 2012-2013 0.0 0.2 0.0 0.0 0.2 F 5 129 1974-1975 0.0 0.1 0.0 0.0 0.1 F 4 130 2021-2022 0.0 0.0 0.0 0.0 0.0 F 3 131 2015-2016 0.0 0.0 0.0 0.0 0.0 F 2 132 2011-2012 0.0 0.0 0.0 0.0 0.0 F 2 133 1994-1995 0.0 0.0 0.0 0.0 0.0 F 1 baltimore Rank YEAR T<=32 Snow MECSb D>1" Points Grade PCTL 1 1989-1990 26.0 14.0 0.0 24.0 64.0 A++ 100 2 1904-1905 21.0 20.1 4.5 18.0 63.6 A++ 99 3 1960-1961 20.0 15.8 4.3 20.0 60.1 A++ 98 4 2009-2010 14.0 20.1 12.0 11.0 57.1 A++ 98 5 1910-1911 19.0 13.1 2.5 17.0 51.6 A+ 97 6 1966-1967 12.0 20.4 6.0 11.0 49.4 A+ 96 7 1945-1946 13.0 12.2 2.6 19.0 46.8 A 95 8 1917-1918 20.0 10.3 0.0 14.0 44.3 A 95 9 1932-1933 10.0 14.7 5.5 12.0 42.2 A- 94 10 1962-1963 17.0 12.0 0.0 10.0 39.0 B+ 93 11 1909-1910 15.0 12.3 3.8 7.0 38.1 B+ 92 12 1963-1964 17.0 9.7 3.0 8.0 37.7 B+ 92 13 1935-1936 13.0 11.6 0.0 11.0 35.6 B 91 14 2002-2003 14.0 9.7 2.4 9.0 35.1 B 90 15 1967-1968 13.0 13.0 3.4 4.0 33.4 B 89 16 1916-1917 11.0 10.5 0.0 10.0 31.5 B- 89 17 1903-1904 23.0 4.8 0.0 3.0 30.8 B- 88 18 1933-1934 13.0 8.3 0.0 8.0 29.3 B- 87 19 1938-1939 9.0 9.5 3.6 7.0 29.1 B- 86 20 1969-1970 12.0 9.0 1.1 6.0 28.1 B- 86 Rank YEAR T<=32 Snow MECSb D>1" Points Grade PCTL 21 1902-1903 13.0 7.0 0.0 8.0 28.0 B- 85 22 1961-1962 15.0 10.4 0.0 2.0 27.4 C+ 84 23 1896-1897 13.0 6.2 0.0 8.0 27.2 C+ 83 24 1908-1909 3.0 12.3 0.9 11.0 27.2 C+ 83 25 1955-1956 22.0 2.5 0.0 2.0 26.5 C+ 82 26 2000-2001 23.0 1.3 0.0 2.0 26.3 C+ 81 27 1919-1920 15.0 5.1 0.0 6.0 26.1 C+ 80 28 2003-2004 8.0 9.6 0.0 7.0 24.6 C+ 80 29 2005-2006 13.0 6.5 0.0 5.0 24.5 C+ 79 30 1898-1899 10.0 10.3 0.0 4.0 24.3 C+ 78 31 1929-1930 13.0 4.4 0.0 6.0 23.4 C 77 32 1944-1945 10.0 4.6 0.0 8.0 22.6 C 77 33 1958-1959 22.0 0.5 0.0 0.0 22.5 C 76 34 1957-1958 6.0 9.5 2.8 4.0 22.3 C 75 35 1976-1977 18.0 2.6 0.0 1.0 21.6 C 74 36 1948-1949 5.0 6.8 1.8 8.0 21.6 C 74 37 1914-1915 14.0 2.6 0.0 5.0 21.6 C 73 38 1951-1952 15.0 5.4 0.0 1.0 21.4 C 72 39 1950-1951 16.0 3.0 0.0 2.0 21.0 C 71 40 1921-1922 6.0 8.6 0.0 6.0 20.6 C 71 Rank YEAR T<=32 Snow MECSb D>1" Points Grade PCTL 41 1973-1974 7.0 8.3 1.0 4.0 20.3 C 70 42 2013-2014 13.0 2.9 0.0 4.0 19.9 C- 69 43 1926-1927 14.0 1.9 0.0 4.0 19.9 C- 68 44 2017-2018 11.0 4.3 0.0 4.0 19.3 C- 68 45 1982-1983 6.0 7.2 1.7 4.0 18.9 C- 67 46 1981-1982 13.0 2.4 0.0 3.0 18.4 C- 66 47 1995-1996 12.0 3.3 0.0 3.0 18.3 C- 65 48 2010-2011 15.0 1.2 0.0 2.0 18.2 C- 65 49 1942-1943 10.0 5.1 0.0 3.0 18.1 C- 64 50 1970-1971 11.0 6.3 0.0 0.0 17.3 C- 63 51 1915-1916 9.0 4.3 0.0 4.0 17.3 C- 62 52 2025-2026 11.0 2.0 0.0 4.0 17.0 C- 62 53 1939-1940 5.0 6.9 0.0 5.0 16.9 C- 61 54 1952-1953 9.0 5.8 0.0 2.0 16.8 C- 60 55 1905-1906 5.0 5.7 0.7 5.0 16.4 C- 59 56 1968-1969 12.0 4.3 0.0 0.0 16.3 C- 59 57 1987-1988 5.0 6.5 1.0 3.0 15.5 D+ 58 58 1998-1999 7.0 3.0 0.0 5.0 15.0 D+ 57 59 1993-1994 9.0 2.9 0.0 3.0 14.9 D+ 56 60 2007-2008 7.0 4.8 0.0 3.0 14.8 D+ 56 Rank YEAR T<=32 Snow MECSb D>1" Points Grade PCTL 61 1983-1984 14.0 0.0 0.0 0.0 14.0 D+ 55 62 1985-1986 12.0 0.7 0.0 1.0 13.7 D+ 54 63 1901-1902 13.0 0.7 0.0 0.0 13.7 D+ 53 64 1897-1898 8.0 2.6 0.0 3.0 13.6 D+ 53 65 1925-1926 9.0 2.9 0.0 1.0 12.9 D+ 52 66 1996-1997 12.0 0.5 0.0 0.0 12.5 D+ 51 67 1953-1954 5.0 5.9 0.5 1.0 12.4 D+ 50 68 1924-1925 12.0 0.3 0.0 0.0 12.3 D+ 50 69 1980-1981 12.0 0.2 0.0 0.0 12.2 D+ 49 70 1947-1948 5.0 4.1 0.0 3.0 12.1 D+ 48 71 1899-1900 9.0 0.7 0.0 2.0 11.7 D 47 72 2008-2009 10.0 0.6 0.0 1.0 11.6 D 47 73 1977-1978 10.0 1.1 0.0 0.0 11.1 D 46 74 1912-1913 3.0 4.9 0.0 3.0 10.9 D 45 75 1990-1991 4.0 4.8 0.0 2.0 10.8 D 44 76 1964-1965 9.0 0.8 0.0 1.0 10.8 D 44 77 1922-1923 7.0 2.8 0.0 1.0 10.8 D 43 78 1978-1979 6.0 3.7 0.0 1.0 10.7 D 42 79 1930-1931 8.0 1.6 0.0 1.0 10.6 D 41 80 1954-1955 10.0 0.4 0.0 0.0 10.4 D 41 Rank YEAR T<=32 Snow MECSb D>1" Points Grade PCTL 81 1906-1907 10.0 0.2 0.0 0.0 10.2 D 40 82 1893-1894 8.0 0.2 0.0 2.0 10.2 D 39 83 1991-1992 10.0 0.0 0.0 0.0 10.0 D 38 84 1988-1989 9.0 0.9 0.0 0.0 9.9 D 38 85 1943-1944 9.0 0.7 0.0 0.0 9.7 D 37 86 2020-2021 6.0 1.6 0.0 2.0 9.6 D 36 87 1927-1928 6.0 1.5 0.0 2.0 9.5 D 35 88 1946-1947 5.0 3.2 0.0 1.0 9.2 D 35 89 1907-1908 4.0 2.1 0.0 3.0 9.1 D 34 90 2004-2005 9.0 0.0 0.0 0.0 9.0 D 33 91 1937-1938 8.0 0.8 0.0 0.0 8.8 D 32 92 1936-1937 6.0 2.8 0.0 0.0 8.8 D 32 93 1895-1896 8.0 0.2 0.0 0.0 8.2 D 31 94 1934-1935 8.0 0.1 0.0 0.0 8.1 D 30 95 1972-1973 8.0 0.0 0.0 0.0 8.0 D 29 96 2014-2015 7.0 0.5 0.0 0.0 7.5 D- 29 97 1959-1960 5.0 1.5 0.0 1.0 7.5 D- 28 98 1965-1966 7.0 0.0 0.0 0.0 7.0 D- 27 99 1900-1901 7.0 0.0 0.0 0.0 7.0 D- 26 100 1894-1895 4.0 0.0 0.0 3.0 7.0 D- 26 Rank YEAR T<=32 Snow MECSb D>1" Points Grade PCTL 101 2018-2019 5.0 1.7 0.0 0.0 6.7 D- 25 102 1975-1976 6.0 0.7 0.0 0.0 6.7 D- 24 103 1992-1993 5.0 1.5 0.0 0.0 6.5 D- 23 104 2016-2017 6.0 0.0 0.0 0.0 6.0 D- 23 105 2001-2002 6.0 0.0 0.0 0.0 6.0 D- 22 106 1986-1987 6.0 0.0 0.0 0.0 6.0 D- 21 107 1971-1972 5.0 1.0 0.0 0.0 6.0 D- 20 108 1920-1921 5.0 0.5 0.0 0.0 5.5 D- 20 109 2019-2020 5.0 0.3 0.0 0.0 5.3 D- 19 110 1999-2000 5.0 0.2 0.0 0.0 5.2 D- 18 111 2024-2025 5.0 0.0 0.0 0.0 5.0 D- 17 112 2022-2023 5.0 0.0 0.0 0.0 5.0 D- 17 113 1923-1924 1.0 1.8 0.0 2.0 4.8 D- 16 114 1997-1998 4.0 0.4 0.0 0.0 4.4 D- 15 115 1984-1985 4.0 0.1 0.0 0.0 4.1 D- 14 116 2006-2007 4.0 0.0 0.0 0.0 4.0 D- 14 117 1940-1941 2.0 1.5 0.0 0.0 3.5 F 13 118 1979-1980 3.0 0.4 0.0 0.0 3.4 F 12 119 1974-1975 3.0 0.4 0.0 0.0 3.4 F 11 120 1928-1929 3.0 0.3 0.0 0.0 3.3 F 11 Rank YEAR T<=32 Snow MECSb D>1" Points Grade PCTL 121 1956-1957 3.0 0.2 0.0 0.0 3.2 F 10 122 1941-1942 3.0 0.1 0.0 0.0 3.1 F 9 123 1918-1919 3.0 0.0 0.0 0.0 3.0 F 8 124 1911-1912 3.0 0.0 0.0 0.0 3.0 F 8 125 2012-2013 1.0 1.4 0.0 0.0 2.4 F 7 126 1994-1995 2.0 0.2 0.0 0.0 2.2 F 6 127 1949-1950 2.0 0.0 0.0 0.0 2.0 F 5 128 1931-1932 1.0 0.9 0.0 0.0 1.9 F 5 129 2023-2024 1.0 0.0 0.0 0.0 1.0 F 4 130 1913-1914 1.0 0.0 0.0 0.0 1.0 F 3 131 2021-2022 0.0 0.0 0.0 0.0 0.0 F 2 132 2015-2016 0.0 0.0 0.0 0.0 0.0 F 2 133 2011-2012 0.0 0.0 0.0 0.0 0.0 F 1
-
... and that is why they are called the primitive equations ...
-
A few seconds of graupel here in Columbia- fringed!
-
... and very dark. Likely the darkest it'll be at this time of day all year.
-
"We are pleased to share the Maryland Climate Bulletin for October 2025, which includes sea surface temperatures for the Chesapeake Bay and the state's coastal waters. However, due to the federal government shutdown, the availability of our primary data source for the Bulletin has been affected, and consequently, the extent of the Bulletin has been impacted. The regular production of the Bulletin is only possible thanks to the hard work and data provided by our friends at NOAA National Centers for Environmental Information, the CoastWatch East Coast Node, the Institutions involved in the U.S. Drought Monitor, and the U.S. Geological Survey's Water Watch. You can access the Bulletin from the following link: https://mdsco.umd.edu/Bulletin/bulletin_mdsco_current.pdf Points to highlight are: 1) Statewide averages indicate that October 2025 was slightly colder and drier than normal (i.e., 1991-2020 averages). 2) Regionally, the mean temperature was warmer than normal in some areas of the state, particularly over counties in the central Piedmont and the Eastern Shore. Colder-than-normal conditions appeared over parts of Garrett, Prince George's, and Charles counties. 3) Precipitation was below normal for most of the state, especially over portions of Saint Mary's, Charles, Calvert, Somerset, Dorchester, and Talbot counties, which received around 50% less precipitation than normal for the month. Above-normal precipitation was observed only over western Washington County, which received approximately 25% more precipitation than normal. The rest of the state, with below-normal precipitation, received around 25% less precipitation than normal. 4) Drought conditions deteriorated in October. The extent of the state affected by drought increased from 50% to 90%, with a rise in the areas having Abnormally Dry and Moderate Drought conditions. Moderate Drought conditions affected Garrett, Allegany, Washington, Frederick, and Montgomery counties, as well as western Carroll, Howard, Prince George's, Charles, and northeastern Cecil counties. The Severe Drought conditions in Garrett and Washington counties, and the Extreme Drought conditions in Garrett County that appeared in September, persisted into this month. Abnormally Dry conditions covered the rest of the counties in the Piedmont, and most of the counties on the Eastern Shore; Worcester and Queen Anne's counties, as well as parts of Wicomico and Kent counties, remained drought-free. The number of streams and rivers experiencing Below-normal and Much-below-normal streamflow increased this month. 5) The Chesapeake Bay sea surface temperatures (SST) in October 2025 were in the 63−70°F range. Regionally, they were below their 2007–2020 mean across much of the Bay, except in the waters north of Baltimore, extending into the Upper Bay, where warm anomalies exceeded 4°F. The coldest anomalies were found in the southeastern Lower Bay, in the Tangier Sound waters off Somerset, Wicomico, and Dorchester counties, as well as in the Chincoteague Bay (3–4°F below). The all-basin mean temperature of 66.3°F was still warmer than the coldest October in the 19-year dataset (2007-2025), which recorded a temperature of 62.2°F in 2002. Please refer to the Bulletin for more details. The Maryland Climate Bulletin is issued monthly and presents the state's recent surface temperature and precipitation conditions in a clear and concise format, enabling Marylanders to better understand regional climate variations. Please help disseminate this Bulletin. Thanks, Alfredo -- ............................................. Alfredo Ruiz-Barradas, PhD Associate Research Professor Maryland State Climatologist"
-
Hi all, MD Climate Bulletin for September 2025 follows: "We are pleased to share the Maryland Climate Bulletin for September2025, which includes sea surface temperatures for the Chesapeake Bayand the state's coastal waters. However, due to the ongoing federalgovernment shutdown, the availability of the main data source we usefor the Bulletin has been affected. The regular production of thebulletin is only possible thanks to the hard work and data provided byour friends at NOAA National Centers for Environmental Information,the CoastWatch East Coast Node, the Institutions involved in the U.S.Drought Monitor, and the U.S. Geological Survey's Water Watch.You can access the Bulletin from the following link:https://mdsco.umd.edu/Bulletin/bulletin_mdsco_current.pdfPoints to highlight are:1) Statewide averages indicate that September 2025 was warmer anddrier than normal (i.e., 1991-2020 averages).2) Regionally, the mean temperature was warmer than normal over themajority of the state. Warmer-than-normal anomalies appeared over thenorthern half of the state, especially over parts of Carroll,Frederick, and Washington counties (around 1.0°F). Colder-than-normalconditions appeared over the southern counties to both sides of theBay, particularly over Charles County (around 1.0°F below).3) Precipitation was below normal for the majority of the state,notably over Frederick and Washington counties (2.0 to 3.0 inchesdeficit), and over Garrett, Allegany, Carroll, Montgomery, Howard,Baltimore, Harford, Cecil, Charles, and Prince George’s counties (1.0to 2.0 inches deficit). Above normal precipitation appeared over someareas in the Eastern Shore, over Queen Anne’s, Kent, and Worcestercounties (larger than 2 inches), as well as over portions ofDorchester and Wicomico counties (1.0 to 2.0 inches). The first ofthese regions, over the western states, received 25 to 50% lessprecipitation than normal, while the regions in the Eastern Shore got25 to 50% more precipitation than normal for the month.4) Drought conditions intensified in September, primarily in thewestern counties. While the extent of the state affected by droughtdiminished from 70% to 50%, Moderate Drought conditions affectedGarrett, Allegany, and Washington counties along the limits with WestVirginia, as well as western and central Montgomery County. SevereDrought conditions also developed over the western counties, and evenExtreme Drought conditions started to creep over the southern tip ofGarrett County. The rest of these counties were under Abnormally Dryconditions, which also affected Frederick, Carroll, Baltimore, Howard,Prince George’s, Charles, Calvert, Saint Mary’s, and Caroline. Severalstreams and rivers in the Piedmont and western Maryland hadBelow-normal streamflow, with a few experiencing Much-below-normalstreamflow.5) The Chesapeake Bay sea surface temperatures (SST) in September 2025ranged between 73 and 78°F, marking the second consecutive month theyremained below their 2007–2020 mean across the entire region. Adistinct north-to-south gradient defined the magnitude of the coldanomalies. The most significant deficit (3–4°F below average) wasrecorded in the southeastern Lower Bay, encompassing Tangier Soundwaters off Somerset, Wicomico, and Dorchester counties. Movingnorthward, along the coasts of Talbot and Queen Ann counties up toEastern Bay, the anomalies lessened to 2–3°F below the mean. Thewaters off Kent and Baltimore counties and farther northward in theUpper Bay, showed the smallest cold anomalies (1–2°F below).Chincoteague Bay temperatures were also notably colder than normal(2–3°F below). The all-basin mean temperature of 74.0°F was stillwarmer than the coldest September in the 19-year dataset (2007-2025),which recorded 72.8°F in 2009.Please refer to the bulletin for more details. The bulletin is issuedonce per month and shows the state's recent monthly surfacetemperature and precipitation conditions in a simple format, helpingMarylanders better understand regional climate variations.Please help disseminate this bulletin.Thanks,Alfredo.............................................Alfredo Ruiz-Barradas, PhDAssociate Research ProfessorMaryland State Climatologist"
-
We are pleased to share with you the Seasonal Maryland Climate Bulletin for summer 2025, which includes sea surface temperatures for the Chesapeake Bay and the state's coastal waters. You can access it from the following link: https://mdsco.umd.edu/Bulletin/bulletin_mdsco_sum25.pdf Points to highlight are: 1) Summer 2025 was warmer and drier than normal (i.e., 1991-2020 averages) in Maryland, with colder and drier-than-normal conditions in August, warmer and wetter-than-normal conditions in July, and warmer and drier-than-normal conditions in June. 2) The mean temperature was warmer than normal throughout the state, especially in Garrett County (2.0−2.8°F), Somerset and Worcester counties (1.0‒1.4°F), and Washington County (1.0°F); minimum temperatures were also warmer than normal everywhere in the state, with maximum values in the previously cited counties, but maximum temperatures were split between warmer (central Piedmont to the west) and colder (Eastern Shore) anomalies. Precipitation was below normal over almost the entire state, particularly in Frederick, Carroll, and Montgomery counties (3.2−4.0 inches deficit), which received 20 to 32% less precipitation than their climatological seasonal precipitation. 3) The partial water year 2025 (October 2024 − August 2025), except for northwestern Garrett County, was below normal everywhere else in the state, notably over Frederick, Carroll, and Montgomery counties (7−10 inches deficit) and parts of Harford, Kent, and Queen Anne’s counties (7−9 inches deficit). The region over Frederick received 18−27% less than its climatological water amount, while the region over Harford received 18% less. 4) Statewide, mean temperature showed that summer 2025 was the seventeenth warmest summer since 1895, while the maximum temperature indicated that this was the thirty-eighth warmest summer. On the other hand, the statewide minimum temperature revealed that this was the seventh warmest summer on record. Seventeen counties reached minimum temperatures within the ten warmest on record, and three of them within the five warmest; among these, Garrett County set a record, Somerset had its fourth warmest summer, and Worcester had its fifth warmest. 5) Statewide precipitation indicated that summer 2025 was the fiftieth driest summer on record. No counties were closer to any record, but Frederick had its twenty-eighth driest summer, while Washington got its thirty-sixth driest summer on record. 6) Sea surface temperatures in the Chesapeake Bay in summer 2025 were below their 2007-2020 mean over the majority of the Bay from the Upper Basin (1.2°F below) and the Middle Basin (0.6°F), where the anomalies largely occupied the main steam of the Bay and rivers on the Eastern Shore, to the Lower Basin where the extent of anomalies on the main steam diminished from north to south until they were confined to the waters along the Eastern Shore and rivers reaching the waters of the Tangier and Pocomoke Sounds (0.2‒0.4°F below). The waters off Worcester County’s Chincoteague Bay were also colder than the mean (0.2‒0.4°F below). On the other hand, warmer anomalies than the 2007-2020 mean appeared along the western shore waters from the Back and Patapsco Rivers (0.8-1.2°F above) to the southern Calvert County coast, where they expanded to reach the Taylor and Hoopers Islands (0.2−0.4°F above). The current all-basin mean temperature of 79.2°F was slightly below the 19-year mean of the dataset (79.4°F) and far from the coldest summer temperature of 77.5°F, set in 2014, within the 19-year record (2007−2025). Please refer to the bulletin for more details, including the century-long trends and links of interest. The bulletins are issued to monitor the state's recent surface conditions in a simple format, allowing Marylanders to better understand regional climate variations. This bulletin is possible thanks to the hard work and data made available by our friends at NOAA National Centers for Environmental Information and the CoastWatch East Coast Node. Please help disseminate this bulletin. Thanks, Alfredo -- ............................................. Alfredo Ruiz-Barradas, PhD Associate Research Professor Maryland State ClimatologistDepartment of Atmospheric and Oceanic Science 3437 Atlantic Building, 4254 Stadium Dr.University of Maryland College Park, MD 20742-2425, USA Email: [email protected]
-
Hi all, Reposting Alfredo's bulletin here, "Good afternoon, With apologies for the delay, we are pleased to share the Maryland Climate Bulletin for August 2025, which includes sea surface temperatures for the Chesapeake Bay and the state's coastal waters. You can access the Bulletin from the following link: https://mdsco.umd.edu/Bulletin/bulletin_mdsco_current.pdf Points to highlight are: 1) Statewide averages indicate that August 2025 was colder and drier than normal (i.e., 1991-2020 averages). The statewide temperature was colder than normal (3.0°F below), after warmer-than-normal June and July, for the second time since January. Statewide precipitation was below normal (2.52 inches deficit) in August, following a wetter-than-normal July and a drier-than-normal June. 2) The mean temperature was colder than normal over all the state, particularly over Caroline and Dorchester counties (3.6 to 3.9°F below), and counties in the central Piedmont and coastal plains (3.0 to 3.3°F below). Precipitation was below normal all over the state after the below normal precipitation, particularly from the southern halves of Prince George’s and Anne Arundel counties to Charles, Calvert, and Saint Mary’s counties (3.0 to 3.6 inches deficit), Caroline, Talbot, Dorchester, and western Wicomico counties (3.0 to 3.3 inches deficit), and western Piedmont (2.4 to 2.7 inches deficit). The first of these regions, over the southwestern coastal plain, received between 20 and 30% of its climatological rainfall for the month, while the other two regions, over the Eastern Shore and western Piedmont, got 30 to 40% of theirs. 3) Drought conditions returned to the state in August, with around 70% of the state experiencing Abnormally Dry conditions. Drought-free conditions were present only over Cecil, Harford, Dorchester, and portions of Queen Anne’s, Talbot, Wicomico, Worcester, Allegany, and Garrett counties. Abnormally Dry conditions can be a precursor to drought if rainfall continues to be below normal. The majority of streams and rivers had normal streamflow throughout the state, with a few already showing below-normal streamflow in western Maryland, the central Piedmont, and the southeastern Eastern Shore 4) Statewide maximum daily temperatures from January 1 to August 31, 2025, indicated that the number of days with extreme temperatures has been less than normal. On the other hand, statewide minimum daily temperatures showed that the number of days with extreme temperatures has been larger than normal. There was one less hot day (maximum temperatures larger than 86°F) than normal (43 vs. 44), but one more heatwave than normal (9 vs. 8). There were thirteen more warm nights (minimum temperature larger than 68°F) than normal (38 vs. 25), and a normal number of warm night spells (5) by the end of August. 5) Statewide daily total precipitation from January 1 to August 31 showed a normal number of days with extreme precipitation (12; at least 0.64 inches; the 95th percentile in 1951−2000), with the last one occurring on August 1. The number of dry spells (two or more consecutive days with daily precipitation of no more than 0.04 inches) was fewer than normal by five spells (28 vs. 33), with three of them occurring in August. 6) The cumulative calendar year (January 1 to August 31) modified growing degree days (base 86/50°F) reached 3219°FDD by the end of August and have been greater than normal since the second week of March, with a departure above normal of 190°FDD. The curve of the cumulative modified growing degree days in the summer months was very similar to that of last year and is among the most extreme on record since 1951. 7) Statewide mean, maximum, and minimum temperatures (71.8, 81.6, 62.0°F) indicated that August 2025 was the twenty-fifth, nineteenth, and thirty-seventh coldest August since 1895, respectively. Three counties experienced maximum temperatures among the ten coldest on record: Calvert had its eighth coldest, while Dorchester and Saint Mary’s had their ninth coldest 8) Statewide precipitation (1.66 inches) showed that August 2025 was the seventh driest August since 1895. Thirteen counties had rainfall within the ten driest, and nine of them within the five driest on record: Carroll and Frederick counties had their driest August; Charles had its second driest, Saint Mary’s had its third driest, Calvert had its fourth driest, while Anne Arundel, Garrett, Montgomery, and Prince George’s had their fifth driest. 9) Sea surface temperatures in the Chesapeake Bay in August 2025 were below their 2007-2020 mean. The coldest anomalies were found in the southeastern Lower Bay, including the Tangier Sound waters along the coasts of Somerset, Wicomico, and Dorchester counties, as well as in the narrow strip of water in front of Worcester County’s Sinepuxent Bay (1.8‒2.7°F below). The current all-basin mean temperature of 79.5°F was far from the coldest August temperature in the 19-year data set (2007-2025), which was 77.8°F in 2013. Please refer to the bulletin for more details, including information on century-long trends and links of interest. The bulletin is issued once per month and shows the state's recent monthly surface temperature and precipitation conditions in a simple format, helping Marylanders better understand regional climate variations. This bulletin is possible thanks to the hard work and data made available by our friends at NOAA National Centers for Environmental Information, CoastWatch East Coast Node, the Institutions involved in the U.S. Drought Monitor, and the U.S. Geological Survey's Water Watch. Please help disseminate this bulletin. .................. Alfredo Ruiz-Barradas, PhD Associate Research Professor Maryland State ClimatologistDepartment of Atmospheric and Oceanic Science
-
Hi all, Here is the MD Climate Bulletin for July 2025 from the State Climatologist Office. "We now share the Maryland Climate Bulletin for July 2025. You can access the Bulletin from the following link: https://mdsco.umd.edu/Bulletin/bulletin_mdsco_current.pdf Points to highlight are: 1) Statewide averages indicate that July 2025 was warmer and wetter than normal (i.e., 1991-2020 averages). Warmer-than-normal conditions persisted for a sixth consecutive month, while precipitation was back to above-normal conditions after a drier-than-normal June. 2) The mean temperature was warmer than normal throughout the state, especially over Garrett County (4.2 to 4.8°F), and parts of Harford and Carroll counties (3.3 to 3.6°F). Precipitation was above normal in more than half of the state, largely over the coastal counties around the Chesapeake Bay and northern Garrett County. In particular, Caroline and Talbot counties (3.6 to 4.4 inches above) received between 90 and 110% more than their climatological precipitation for the month; Anne Arundel, Calvert, and Baltimore counties (2.4 to 3.2 inches) received 50 to 70% more than their climatological precipitation. Precipitation was below normal in the western counties, especially over Frederick County (1.2−1.6 inches deficit), which received between 30% and 40% less than its climatological precipitation. 3) Drought conditions kept improving by the end of July, as approximately 97% of the state was drought-free, and only around 3% of the state, over southern Baltimore County and Baltimore City, was under abnormally dry conditions. Streams and rivers experienced normal to much above-normal streamflow throughout the state, with above-normal streamflow in some of them in western Maryland, the central and southwestern Piedmont, and the coastal plains on both sides of the Bay; much above-normal streamflow appeared in some rivers and streams in the central and southwestern Piedmont. 4) Statewide maximum and minimum daily temperatures from January 1 to July 31, 2025, indicated that the number of days with extreme temperatures has been larger than normal. There were seven more hot days (maximum temperatures larger than 86°F) than normal (38 vs. 31), and one more heatwave than normal (7 vs. 6). There were fifteen more warm nights (minimum temperature larger than 68°F) than normal (32 vs. 17), and a normal number of warm night spells (4) by the end of July; 5) Statewide daily total precipitation from January 1 to July 31 showed one more day with extreme precipitation (at least 0.64 inches; the 95th percentile in 1951−2000) than normal (11 vs. 10), with three of them occurring in July. The number of dry spells (two or more consecutive days with daily precipitation of no more than 0.04 inches) was fewer than normal by five spells (24 vs. 29), with two of them occurring in July. 6) The cumulative calendar year (January 1 to July 31) modified growing degree days (base 86/50°F) reached around 2555°FDD by the end of July and have been greater than normal since the second week of March, with a departure above normal of 274°FDD by the end of July. The curve of the cumulative modified growing degree days in June and July was very similar to that of last year and is among the most extreme on record since 1951. 7) Statewide mean, maximum, and minimum temperatures indicated that July 2025 was the second, eleventh, and first warmest July since 1895, respectively. Twenty-two of the counties experienced mean temperatures among the five warmest on record, with Frederick, Garrett, and Washington counties establishing records. Notably, twenty counties set records in minimum temperatures. 8) Statewide precipitation showed that July 2025 was the twentieth wettest July since 1895, and Caroline County had its sixth wettest July, while Talbot got its tenth wettest. Please take a look at the bulletin for more details, including information on century-long trends and links of interest. The bulletin is issued once per month and shows the state's recent monthly surface temperature and precipitation conditions in a simple format, helping Marylanders better understand regional climate variations. Please help disseminate this bulletin. Thanks, Alfredo -- ............................................. Alfredo Ruiz-Barradas, PhD Associate Research Professor Maryland State ClimatologistDepartment of Atmospheric and Oceanic Science 3437 Atlantic Building, 4254 Stadium Dr.University of Maryland College Park, MD 20742-2425, USA Email: [email protected] "
- 1 reply
-
- 2
-

-
In case you haven't seen this from the State Climatologist ... "Good afternoon, We now share the Maryland Climate Bulletin for June 2025. You can access the Bulletin from the following link: https://mdsco.umd.edu/Bulletin/bulletin_mdsco_current.pdf Points to highlight are: 1) Statewide averages indicate that June 2025 was warmer and drier than normal (i.e., 1991-2020 averages). Warmer-than-normal conditions persisted for a fifth consecutive month, while precipitation was back to below-normal conditions after a wetter-than-normal May. 2) The mean temperature was warmer than normal in the entire state, particularly over Saint Mary’s and southern Calvert counties (3.9 to 4.2°F), parts of Charles, Calvert, Talbot, Dorchester, Wicomico, Somerset, and Worcester counties (3.3 to 3.9°F), and southwestern Garrett County (3.0 to 3.3°F). Precipitation was below normal in more than half of the state, largely over the coastal counties around the Chesapeake Bay, and particularly over Caroline, Talbot, Dorchester, and Wicomico counties (1.2 to 1.8 inches deficit). These counties received between 60 to 70% of their climatological precipitation for the month. Precipitation was above normal in several counties, especially in Garrett County (1.2−2.1 inches) and northern Carroll and Baltimore counties (0.9−1.5 inches), which received between 20% and 40% more than their climatological precipitation. 3) Drought conditions kept improving by the end of June, as approximately 69% of the state was now drought-free, an increase of 18% with respect to the start of June. The extent of Moderate Drought conditions was reduced to around 12%, impacting only Baltimore and Harford counties. The extent of Abnormally Dry conditions was reduced to 19%, primarily affecting the central and eastern Piedmont, as well as some coastal counties on both sides of the Bay, reflecting the transition of these areas toward improved conditions. Streams and rivers experienced much above-normal streamflow in western Maryland and normal streamflow in the Piedmont and on both sides of the Bay. Still, some streams and rivers on the Piedmont and northern Eastern Shore had below-normal stream flow. 4) Statewide maximum and minimum daily temperatures from January 1 to June 30, 2025, indicated that the number of days with extreme temperatures has been larger than normal, and so has the number of warm spells. Most of these extreme temperatures occurred in June. For instance, there have been six more warm nights (minimum temperature larger than 68°F) than normal (10 vs. 4), and one more warm night spell than normal (2 vs. 1) by the end of June; the mean temperature of all the warm nights was 71.5°F, while the maximum was 75.4°F, which occurred on June 24. 5) Statewide daily total precipitation from January 1 to June 30 showed 1 less day with extreme precipitation (at least 0.64 inches; the 95th percentile in 1951−2000) than normal (8 vs. 9), with none occurring in June. The number of dry spells (two or more consecutive days with daily precipitation of no more than 0.04 inches) from January 1 to June 30 was also fewer than normal by 3 spells (22 vs. 25). 6) The cumulative calendar year (January 1 to June 30, 2025) modified growing degree days (base 86/50°F) reached around 1684°FDD by the end of June and have been greater than normal since the second week of March, with a departure above normal of 192°FDD by the end of June. The modified growing degree days in June were very similar to those in June of last year. 7) Statewide mean, maximum, and minimum temperatures in June 2025 (74.8, 84.9, 64.7°F) were above their long-term mean (1895-2024); the mean and minimum temperatures were among the 5% of their highest values, while the maximum temperature was within the 10% of its highest values on record. The mean, maximum, and minimum temperatures were still far from their historical record highs of 76.6°F in 1943, 87.7°F in 1925, and 65.9°F in 1943, respectively. Statewide precipitation in June (3.92 inches) was close to the long-term mean and far from the record low of 0.93 inches in 1988. 8) Statewide mean, maximum, and minimum temperatures indicated that June 2025 was the fourth, tenth, and third warmest June since 1895, respectively. Ten of the counties experienced mean temperatures among the five warmest on record, and five of these counties had maximum temperatures among the five warmest Junes. Twenty-two counties recorded minimum temperatures among the four warmest on record; nineteen of them reached their third-warmest June, while Washington County recorded its second warmest. 9) Statewide precipitation showed that June 2025 was the seventy-second driest (or sixty wettest) June since 1895. Please take a look at the bulletin for more details, including information on century-long trends. The bulletin is issued once per month and shows the state's recent monthly surface temperature and precipitation conditions in a simple format, helping Marylanders better understand regional climate variations. Please help disseminate this bulletin. Thanks, Alfredo" -- ............................................. Alfredo Ruiz-Barradas, PhD Associate Research Professor Maryland State ClimatologistDepartment of Atmospheric and Oceanic Science 3437 Atlantic Building, 4254 Stadium Dr.University of Maryland College Park, MD 20742-2425, USA Email: [email protected]
- 1 reply
-
- 4
-
-

-
Good afternoon, We now share the seasonal Maryland Climate Bulletin for winter 2024-25. You can access the winter Bulletin from the following link: https://www2.atmos.umd.edu/~climate/Bulletin/bulletin_mdsco_win25.pdf Points to highlight are: 1) Winter 2024-25 was colder and drier than normal (i.e., 1991-2020 averages) in Maryland, with warmer and wetter-than-normal conditions in February, but colder and drier-than-normal conditions in January and December. 2) The mean temperature was colder than normal everywhere in the state, especially in southeastern Baltimore and Harford counties, Kent, Queen Anne’s counties (2.4−2.8°F below), Caroline County, and portions of Talbot, Dorchester, Wicomico and Worcester counties (2.2‒2.6°F below), and Garrett County (2.2‒2.4°F below). Precipitation was below normal over almost the entire state, particularly in Harford and Kent Counties, portions of Cecil and Queen Anne’s counties (4‒4.8 inches below), and counties in the Piedmont (2.8‒3.6 inches below). The regions with the maximum deficit over the state's northeast received around 55−60% of their climatological winter precipitation. 3) The partial water year 2025 (October 2024 − February 2025) was below normal across the entire state, especially over Harford, Kent, Queen Anne’s, and northern Caroline counties (8−9 inches below); this region received 45−50% of its climatological water amount. The counties in the central and western Piedmont, as well as Washington and eastern Allegany counties, received 50−55% of their normal water amount. Somerset and Wicomico counties received 70−75% of their climatological water amount, while Garrett County got 80−95% of its normal water amount. 4) Statewide mean temperatures showed that winter 2024-25 was the seventy-second coldest winter (or fifty-ninth warmest) since 1896. Statewide maximum temperatures indicated that this winter was the sixty-ninth coldest (or sixty-second warmest), while statewide minimum temperatures showed this winter was the seventy-fourth coldest (or fifty-seventh warmest) winter on record. 5) Statewide precipitation revealed that winter 2024-25 was the nineteenth driest winter and among the ten driest for four counties. It was the seventh driest winter for Carroll and Harford counties and the fifth driest for Kent and Queen Anne’s counties. This winter was also the twelfth driest for Talbot and Washington counties and the eleventh for Baltimore and Caroline counties. Please take a look at the bulletin for more details, including the winter century-plus long trends. The bulletins are issued to monitor the state's recent surface temperature and precipitation conditions in a simple format, allowing Marylanders to better understand regional climate variations. Please help disseminate this bulletin.
-
This might come as a surprise to us weather weenies as we want 14 day forecasts to be quite accurate but April 1st snow storms are very rare. Thus, there are two competing forces here, and since the rareness of a 12” snowfall in late March / early April is greater than the accuracy of a 13-day forecast, there is still good chance that we may not get that 12” snow fall a fortnight hence.
-
Dr no ensembles say likely at least if you look at the Sunday-Monday time period.
-
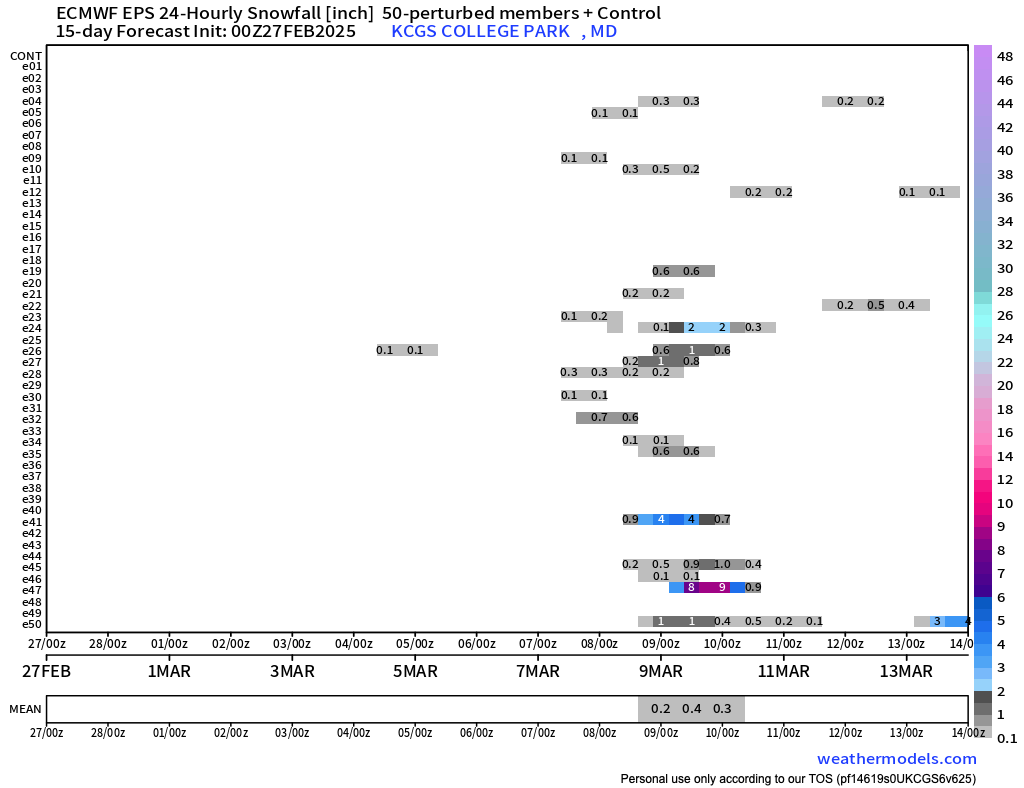
Not dead yet. EPS still has one member (of 51) giving the DC area >+ 3" of snow/sleet during the next 10 days.
-
According to "me", Baltimore's winter through February is the 71st best of 132 winters (47th PCTL). So far, it has had 29 days with mean temperatures of freezing or below, 12.7" of snow, and 12 days with at least an inch on the ground. DC's winter is 66th best of 132 winters (51st PCTL). So far it has had 20 days with mean temperatures of freezing or below, 14.9" of snow, and 13 days with 1" or more of snow on the ground. Hope you're enjoying such a mediocre (near the median) winter. baltimore Rank YEAR T<=32 Snow MECSb D>1" Points Grade PCTL 1 2009-2010 46.0 77.0 37.5 35.0 195.5 A++ 100 2 2002-2003 54.0 55.5 19.2 37.0 165.7 A++ 99 3 1904-1905 59.0 41.8 5.4 56.0 162.2 A++ 98 4 1960-1961 48.0 46.5 11.6 49.0 155.1 A+ 98 5 1995-1996 42.0 54.9 18.3 26.0 141.2 A 97 6 1917-1918 58.0 34.9 6.0 39.0 137.9 A 96 7 1898-1899 41.0 49.5 11.9 29.0 131.4 A- 95 8 1903-1904 68.0 23.9 1.0 34.0 126.9 A- 95 9 1921-1922 30.0 44.8 19.5 28.0 122.3 A- 94 10 1933-1934 43.0 35.6 5.4 36.0 120.0 A- 93 11 1978-1979 38.0 42.5 13.4 25.0 118.9 B+ 92 12 1935-1936 44.0 30.1 2.0 41.0 117.1 B+ 92 13 1966-1967 40.0 40.9 11.1 25.0 117.0 B+ 91 14 1963-1964 41.0 38.2 10.1 24.0 113.3 B+ 90 15 1977-1978 56.0 25.8 3.4 22.0 107.2 B 89 16 1965-1966 41.0 32.8 9.1 20.0 102.9 B 89 17 2013-2014 47.0 26.9 4.7 21.0 99.6 B 88 18 1957-1958 39.0 29.3 9.3 21.0 98.6 B 87 19 1981-1982 47.0 24.8 1.1 25.0 97.9 B 86 20 1962-1963 53.0 17.8 0.0 27.0 97.8 B 86 Rank YEAR T<=32 Snow MECSb D>1" Points Grade PCTL 21 1934-1935 28.0 29.5 7.5 32.0 97.0 B 85 22 1982-1983 23.0 35.6 19.5 18.0 96.1 B 84 23 1939-1940 36.0 21.8 1.0 37.0 95.8 B- 83 24 1944-1945 35.0 18.4 2.0 40.0 95.4 B- 83 25 1909-1910 37.0 30.7 5.2 22.0 94.9 B- 82 26 1924-1925 29.0 23.0 6.0 36.0 94.0 B- 81 27 1919-1920 46.0 16.8 0.0 30.0 92.8 B- 80 28 1999-2000 31.0 25.9 10.6 23.0 90.5 B- 80 29 1910-1911 34.0 26.8 3.1 26.0 89.9 B- 79 30 2015-2016 23.0 32.6 20.5 13.0 89.1 B- 78 31 1947-1948 37.0 23.4 0.7 26.0 87.1 B- 77 32 1976-1977 57.0 11.1 0.0 19.0 87.1 B- 77 33 1945-1946 29.0 26.1 5.2 26.0 86.3 B- 76 34 1929-1930 34.0 22.8 4.0 25.0 85.8 B- 75 35 1986-1987 22.0 35.2 9.5 19.0 85.7 B- 74 36 2014-2015 43.0 21.0 1.3 20.0 85.3 B- 73 37 1906-1907 39.0 23.4 0.2 22.0 84.6 B- 73 38 1894-1895 38.0 11.3 0.0 32.0 81.3 C+ 72 39 1961-1962 48.0 21.6 0.0 11.0 80.6 C+ 71 40 2003-2004 40.0 18.1 0.0 21.0 79.1 C+ 70 Rank YEAR T<=32 Snow MECSb D>1" Points Grade PCTL 41 1925-1926 30.0 22.3 5.1 21.0 78.4 C+ 70 42 1969-1970 40.0 19.1 1.1 18.0 78.2 C+ 69 43 2010-2011 47.0 14.4 2.6 14.0 78.0 C+ 68 44 1901-1902 47.0 8.4 0.6 22.0 78.0 C+ 67 45 1916-1917 34.0 23.1 0.0 20.0 77.1 C+ 67 46 1902-1903 32.0 19.8 0.0 25.0 76.8 C+ 66 47 1967-1968 41.0 18.1 3.4 14.0 76.5 C+ 65 48 1932-1933 20.0 25.4 8.5 20.0 73.9 C+ 64 49 1911-1912 40.0 14.4 0.0 19.0 73.4 C+ 64 50 1993-1994 40.0 13.1 0.0 20.0 73.1 C+ 63 51 1987-1988 31.0 20.4 2.5 18.0 71.9 C 62 52 1989-1990 31.0 14.5 0.0 24.0 69.5 C 61 53 1938-1939 23.0 18.9 3.6 23.0 68.5 C 61 54 1985-1986 40.0 15.6 0.0 12.0 67.6 C 60 55 1955-1956 43.0 10.3 0.0 14.0 67.3 C 59 56 1946-1947 23.0 22.3 4.9 16.0 66.2 C 58 57 2004-2005 35.0 17.6 0.2 13.0 65.8 C 58 58 2000-2001 47.0 8.7 0.0 9.0 64.7 C 57 59 1896-1897 36.0 12.3 0.0 16.0 64.3 C 56 60 1899-1900 33.0 16.2 1.0 13.0 63.2 C 55 Rank YEAR T<=32 Snow MECSb D>1" Points Grade PCTL 61 1964-1965 37.0 10.2 0.0 15.0 62.2 C 55 62 1973-1974 31.0 17.1 2.3 10.0 60.4 C 54 63 1927-1928 25.0 15.9 9.3 10.0 60.2 C 53 64 1900-1901 39.0 8.6 0.0 12.0 59.6 C- 52 65 1983-1984 38.0 8.4 0.0 13.0 59.4 C- 52 66 1942-1943 29.0 13.7 0.0 16.0 58.7 C- 51 67 1907-1908 28.0 16.8 0.6 13.0 58.4 C- 50 68 2005-2006 24.0 19.6 4.6 10.0 58.2 C- 49 69 1908-1909 16.0 21.8 0.9 19.0 57.7 C- 48 70 1953-1954 21.0 20.6 1.2 14.0 56.8 C- 48 71 2024-2025 29.0 12.7 1.6 12.0 55.3 C- 47 72 1970-1971 39.0 11.0 0.0 5.0 55.0 C- 46 73 1913-1914 26.0 11.8 0.0 16.0 53.8 C- 45 74 1915-1916 27.0 13.2 0.0 13.0 53.2 C- 45 75 2017-2018 35.0 8.7 0.0 9.0 52.7 C- 44 76 2006-2007 33.0 9.4 0.0 10.0 52.4 C- 43 77 2018-2019 27.0 15.6 0.0 9.0 51.6 C- 42 78 1984-1985 31.0 9.6 0.0 11.0 51.6 C- 42 79 1958-1959 46.0 2.6 0.0 3.0 51.6 C- 41 80 1996-1997 31.0 12.6 0.8 7.0 51.4 C- 40 Rank YEAR T<=32 Snow MECSb D>1" Points Grade PCTL 81 1928-1929 27.0 12.4 5.6 6.0 51.0 C- 39 82 1954-1955 34.0 8.9 0.0 8.0 50.9 C- 39 83 1905-1906 23.0 13.8 0.7 13.0 50.5 C- 38 84 1979-1980 35.0 8.9 0.0 6.0 49.9 C- 37 85 2021-2022 22.0 14.0 1.8 12.0 49.8 C- 36 86 1968-1969 37.0 10.8 0.0 1.0 48.8 C- 36 87 1980-1981 41.0 4.3 0.0 3.0 48.3 C- 35 88 1922-1923 26.0 13.9 0.0 8.0 47.9 D+ 34 89 1950-1951 35.0 6.2 0.0 6.0 47.2 D+ 33 90 1914-1915 31.0 6.8 0.0 9.0 46.8 D+ 33 91 1926-1927 27.0 10.7 0.0 9.0 46.7 D+ 32 92 1923-1924 24.0 13.0 1.3 8.0 46.3 D+ 31 93 1940-1941 23.0 11.8 0.0 11.0 45.8 D+ 30 94 1971-1972 24.0 13.5 0.0 8.0 45.5 D+ 30 95 1893-1894 23.0 12.1 0.0 10.0 45.1 D+ 29 96 2020-2021 20.0 10.9 0.0 14.0 44.9 D+ 28 97 1943-1944 21.0 11.7 0.0 12.0 44.7 D+ 27 98 1998-1999 25.0 7.6 0.0 11.0 43.6 D+ 27 99 2008-2009 37.0 3.3 0.0 3.0 43.3 D+ 26 100 1948-1949 9.0 19.9 2.0 11.0 41.9 D+ 25 Rank YEAR T<=32 Snow MECSb D>1" Points Grade PCTL 101 1992-1993 26.0 11.7 0.0 4.0 41.7 D+ 24 102 1959-1960 22.0 12.5 1.0 6.0 41.5 D+ 23 103 1956-1957 18.0 13.6 0.0 9.0 40.6 D+ 23 104 2007-2008 26.0 8.5 0.0 5.0 39.5 D+ 22 105 1994-1995 21.0 8.0 2.2 8.0 39.2 D+ 21 106 1988-1989 26.0 8.0 0.0 5.0 39.0 D+ 20 107 1991-1992 28.0 4.1 0.0 3.0 35.1 D 20 108 1897-1898 23.0 8.0 0.0 4.0 35.0 D 19 109 1975-1976 29.0 3.7 0.0 2.0 34.7 D 18 110 1920-1921 17.0 9.8 0.5 7.0 34.3 D 17 111 1972-1973 32.0 1.2 0.0 1.0 34.2 D 17 112 1974-1975 18.0 11.0 0.0 5.0 34.0 D 16 113 1990-1991 19.0 9.1 0.0 5.0 33.1 D 15 114 1936-1937 14.0 11.3 1.0 6.0 32.3 D 14 115 1951-1952 22.0 7.1 0.0 2.0 31.1 D 14 116 2023-2024 10.0 11.3 0.0 9.0 30.3 D 13 117 1941-1942 23.0 4.1 0.0 2.0 29.1 D 12 118 1895-1896 23.0 3.3 0.0 2.0 28.3 D 11 119 2012-2013 19.0 4.8 0.0 3.0 26.8 D 11 120 1937-1938 21.0 3.0 0.0 2.0 26.0 D 10 Rank YEAR T<=32 Snow MECSb D>1" Points Grade PCTL 121 1912-1913 15.0 7.3 0.0 3.0 25.3 D 9 122 1952-1953 14.0 8.2 0.0 3.0 25.2 D 8 123 1930-1931 18.0 3.6 0.0 1.0 22.6 D- 8 124 1918-1919 15.0 4.3 0.0 1.0 20.3 D- 7 125 2001-2002 14.0 2.3 0.0 2.0 18.3 D- 6 126 2019-2020 14.0 1.8 0.0 1.0 16.8 D- 5 127 2016-2017 16.0 0.7 0.0 0.0 16.7 D- 5 128 2011-2012 10.0 1.8 0.0 4.0 15.8 D- 4 129 1997-1998 9.0 1.1 0.0 0.0 10.1 F 3 130 1949-1950 9.0 0.5 0.0 0.0 9.5 F 2 131 2022-2023 7.0 0.2 0.0 0.0 7.2 F 2 132 1931-1932 5.0 1.7 0.0 0.0 6.7 F 1 dc Rank YEAR T<=32 Snow MECSb D>1" Points Grade PCTL 1 1904-1905 58.0 42.0 2.0 53.0 155.0 A+ 100 2 1917-1918 58.0 35.9 6.0 50.0 149.9 A+ 99 3 2009-2010 29.0 56.1 21.3 30.0 136.4 A 98 4 1960-1961 42.0 40.3 8.1 44.0 134.4 A 98 5 1898-1899 44.0 49.9 9.5 30.0 133.4 A 97 6 1935-1936 47.0 33.0 9.4 29.0 118.4 B+ 96 7 1903-1904 67.0 20.2 0.6 30.0 117.8 B+ 95 8 1921-1922 32.0 40.0 16.0 28.0 116.0 B+ 95 9 2002-2003 37.0 40.3 9.4 26.0 112.7 B+ 94 10 1995-1996 36.0 40.8 10.1 23.0 109.9 B+ 93 11 1894-1895 43.0 24.7 1.0 39.0 107.7 B 92 12 1978-1979 33.0 37.7 10.2 23.0 103.9 B 92 13 1966-1967 26.0 36.4 7.6 26.0 96.0 B- 91 14 1910-1911 36.0 32.6 0.0 26.0 94.6 B- 90 15 1939-1940 37.0 24.4 4.7 28.0 94.1 B- 89 16 1962-1963 46.0 20.3 0.7 27.0 94.0 B- 89 17 1933-1934 43.0 23.1 3.0 24.0 93.1 B- 88 18 1934-1935 28.0 31.9 7.0 26.0 92.9 B- 87 19 1919-1920 48.0 16.2 0.0 28.0 92.2 B- 86 20 1911-1912 42.0 18.0 1.1 30.0 91.1 B- 86 Rank YEAR T<=32 Snow MECSb D>1" Points Grade PCTL 21 1947-1948 44.0 23.5 0.4 22.0 89.9 B- 85 22 1908-1909 22.0 35.1 8.7 23.0 88.8 B- 84 23 1957-1958 31.0 29.8 14.0 12.0 86.8 B- 83 24 1963-1964 31.0 27.0 3.7 25.0 86.7 B- 83 25 1965-1966 30.0 28.4 9.1 18.0 85.5 B- 82 26 1929-1930 36.0 20.4 6.5 22.0 84.9 B- 81 27 1987-1988 30.0 24.6 7.8 22.0 84.4 B- 80 28 1976-1977 48.0 11.1 0.0 24.0 83.1 C+ 80 29 1924-1925 34.0 20.2 0.0 28.0 82.2 C+ 79 30 1901-1902 46.0 10.6 0.0 22.0 78.6 C+ 78 31 1977-1978 43.0 14.4 0.0 18.0 75.4 C+ 77 32 1981-1982 28.0 22.3 1.4 22.0 73.7 C+ 77 33 1909-1910 38.0 17.0 0.0 18.0 73.0 C+ 76 34 1899-1900 32.0 19.9 4.0 17.0 72.9 C+ 75 35 1906-1907 37.0 20.5 0.0 15.0 72.5 C+ 74 36 1967-1968 36.0 18.4 1.9 16.0 72.3 C+ 73 37 1986-1987 14.0 31.1 7.7 17.0 69.8 C 73 38 1982-1983 15.0 27.6 13.0 13.0 68.6 C 72 39 1925-1926 29.0 17.9 4.4 17.0 68.3 C 71 40 1896-1897 39.0 16.2 0.0 13.0 68.2 C 70 Rank YEAR T<=32 Snow MECSb D>1" Points Grade PCTL 41 1945-1946 30.0 21.6 0.0 16.0 67.6 C 70 42 1907-1908 35.0 18.3 0.0 14.0 67.3 C 69 43 1900-1901 47.0 9.0 0.0 9.0 65.0 C 68 44 1893-1894 27.0 23.4 1.5 13.0 64.9 C 67 45 1916-1917 36.0 15.8 0.0 12.0 63.8 C 67 46 1989-1990 27.0 12.7 0.0 24.0 63.7 C 66 47 1932-1933 20.0 22.8 6.5 14.0 63.3 C 65 48 1999-2000 23.0 15.4 4.3 20.0 62.7 C 64 49 1993-1994 33.0 9.2 0.0 20.0 62.2 C 64 50 2013-2014 25.0 19.3 0.9 15.0 60.2 C 63 51 1985-1986 30.0 15.4 0.0 14.0 59.4 C- 62 52 2015-2016 17.0 21.9 7.8 11.0 57.7 C- 61 53 1905-1906 26.0 18.4 0.4 12.0 56.8 C- 61 54 1946-1947 26.0 16.6 2.6 11.0 56.2 C- 60 55 1969-1970 29.0 14.0 0.0 13.0 56.0 C- 59 56 1915-1916 28.0 14.3 0.2 13.0 55.5 C- 58 57 1914-1915 36.0 8.5 0.0 11.0 55.5 C- 58 58 2003-2004 28.0 12.4 0.0 15.0 55.4 C- 57 59 1964-1965 30.0 11.7 0.0 13.0 54.7 C- 56 60 1938-1939 23.0 15.1 1.5 15.0 54.6 C- 55 Rank YEAR T<=32 Snow MECSb D>1" Points Grade PCTL 61 1913-1914 28.0 10.8 0.0 15.0 53.8 C- 55 62 2014-2015 26.0 13.4 0.0 13.0 52.4 C- 54 63 1961-1962 29.0 11.0 0.0 12.0 52.0 C- 53 64 1942-1943 28.0 12.7 0.0 11.0 51.7 C- 52 65 1927-1928 24.0 13.2 5.5 9.0 51.7 C- 52 66 2024-2025 20.0 14.9 3.1 13.0 51.0 C- 51 67 1970-1971 34.0 10.3 0.0 5.0 49.3 C- 50 68 1953-1954 17.0 18.0 2.9 11.0 48.9 C- 49 69 2004-2005 28.0 11.7 0.0 9.0 48.7 C- 48 70 1902-1903 31.0 8.2 0.0 9.0 48.2 C- 48 71 1955-1956 36.0 7.3 0.0 4.0 47.3 D+ 47 72 2010-2011 27.0 9.9 0.0 10.0 46.9 D+ 46 73 1984-1985 27.0 10.3 0.0 9.0 46.3 D+ 45 74 2006-2007 29.0 7.2 0.0 10.0 46.2 D+ 45 75 1944-1945 34.0 8.2 0.0 4.0 46.2 D+ 44 76 1928-1929 31.0 8.0 2.5 4.0 45.5 D+ 43 77 1983-1984 29.0 6.8 0.0 9.0 44.8 D+ 42 78 2000-2001 30.0 7.2 0.0 6.0 43.2 D+ 42 79 1897-1898 29.0 8.0 0.0 6.0 43.0 D+ 41 80 1958-1959 35.0 4.9 0.0 3.0 42.9 D+ 40 Rank YEAR T<=32 Snow MECSb D>1" Points Grade PCTL 81 1926-1927 25.0 8.8 0.0 9.0 42.8 D+ 39 82 1979-1980 19.0 14.0 0.0 9.0 42.0 D+ 39 83 1950-1951 24.0 9.2 0.0 7.0 40.2 D+ 38 84 1956-1957 18.0 11.9 0.0 10.0 39.9 D+ 37 85 1971-1972 18.0 16.2 0.5 5.0 39.7 D+ 36 86 2018-2019 10.0 16.6 3.3 9.0 38.9 D+ 36 87 1973-1974 12.0 16.7 1.0 9.0 38.7 D+ 35 88 2021-2022 18.0 12.3 1.9 6.0 38.2 D+ 34 89 1923-1924 26.0 8.0 0.0 4.0 38.0 D+ 33 90 1922-1923 25.0 8.8 0.0 4.0 37.8 D+ 33 91 1940-1941 26.0 6.7 0.0 4.0 36.7 D+ 32 92 2005-2006 15.0 13.6 1.7 6.0 36.3 D+ 31 93 1943-1944 23.0 6.2 0.0 7.0 36.2 D+ 30 94 1920-1921 22.0 9.1 1.0 4.0 36.1 D+ 30 95 1980-1981 28.0 4.5 0.0 3.0 35.5 D 29 96 1994-1995 15.0 9.7 0.0 10.0 34.7 D 28 97 1954-1955 23.0 6.6 0.0 4.0 33.6 D 27 98 1968-1969 29.0 2.4 0.0 2.0 33.4 D 27 99 1912-1913 18.0 8.8 1.5 5.0 33.3 D 26 100 1948-1949 9.0 15.8 0.7 7.0 32.5 D 25 Rank YEAR T<=32 Snow MECSb D>1" Points Grade PCTL 101 1937-1938 26.0 3.0 0.0 3.0 32.0 D 24 102 1936-1937 17.0 9.2 0.6 5.0 31.8 D 23 103 2008-2009 26.0 2.0 0.0 2.0 30.0 D 23 104 1941-1942 25.0 2.1 0.0 2.0 29.1 D 22 105 1895-1896 25.0 1.5 0.0 2.0 28.5 D 21 106 2017-2018 22.0 3.3 0.0 3.0 28.3 D 20 107 1930-1931 22.0 2.5 0.0 3.0 27.5 D 20 108 1959-1960 15.0 7.2 0.0 5.0 27.2 D 19 109 1991-1992 16.0 6.6 0.0 4.0 26.6 D 18 110 1988-1989 19.0 5.3 0.0 2.0 26.3 D 17 111 2023-2024 9.0 8.0 0.0 8.0 25.0 D 17 112 1951-1952 15.0 6.4 0.0 3.0 24.4 D 16 113 1974-1975 6.0 12.5 0.0 5.0 23.5 D- 15 114 1998-1999 19.0 2.9 0.0 1.0 22.9 D- 14 115 1996-1997 12.0 6.7 0.0 4.0 22.7 D- 14 116 2020-2021 14.0 5.4 0.0 3.0 22.4 D- 13 117 1992-1993 15.0 5.1 0.0 2.0 22.1 D- 12 118 1990-1991 10.0 8.1 0.0 4.0 22.1 D- 11 119 2007-2008 13.0 4.9 0.0 4.0 21.9 D- 11 120 1975-1976 19.0 1.4 0.0 1.0 21.4 D- 10 Rank YEAR T<=32 Snow MECSb D>1" Points Grade PCTL 121 1972-1973 21.0 0.1 0.0 0.0 21.1 D- 9 122 1918-1919 16.0 3.3 0.0 0.0 19.3 D- 8 123 1952-1953 8.0 5.2 0.0 2.0 15.2 D- 8 124 2012-2013 11.0 1.5 0.0 0.0 12.5 D- 7 125 2016-2017 9.0 1.4 0.0 1.0 11.4 F 6 126 2001-2002 6.0 3.2 0.0 1.0 10.2 F 5 127 2011-2012 6.0 2.0 0.0 1.0 9.0 F 5 128 1949-1950 8.0 0.3 0.0 0.0 8.3 F 4 129 2019-2020 6.0 0.6 0.0 0.0 6.6 F 3 130 2022-2023 5.0 0.4 0.0 0.0 5.4 F 2 131 1931-1932 4.0 1.0 0.0 0.0 5.0 F 2 132 1997-1998 2.0 0.1 0.0 0.0 2.1 F 1
-
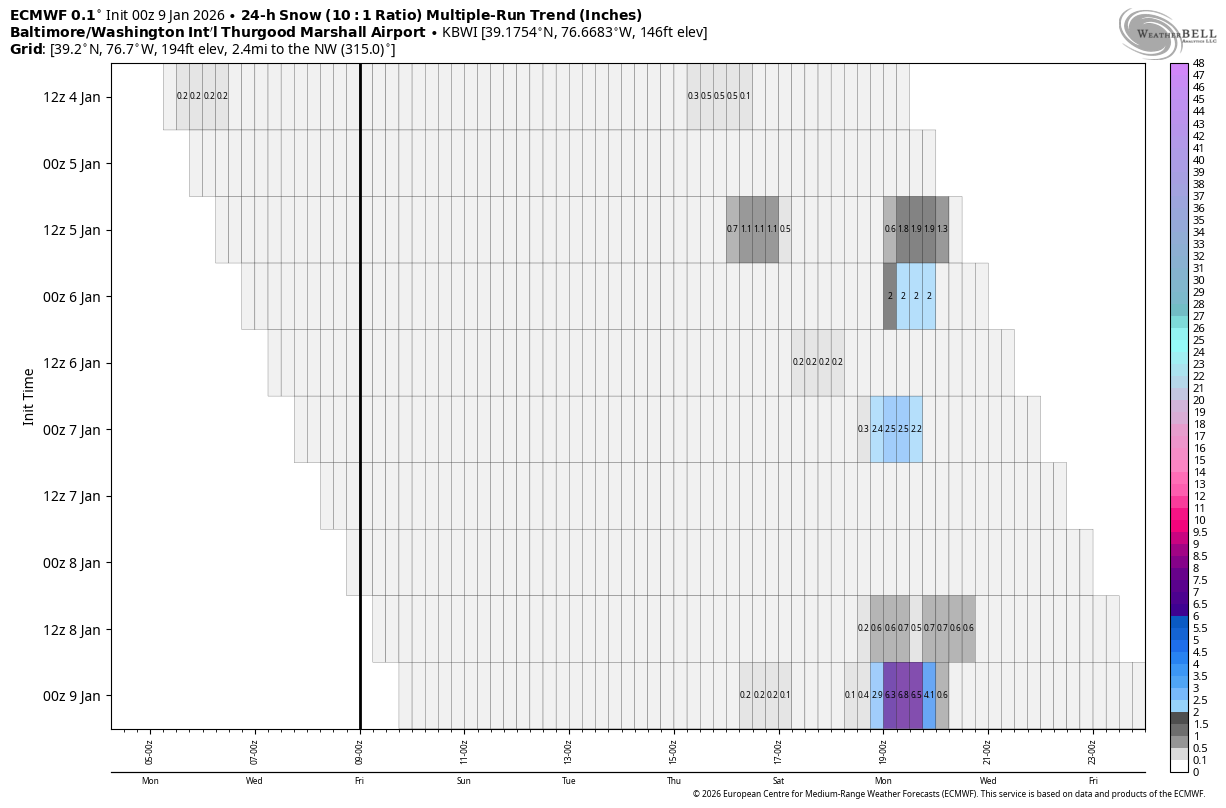
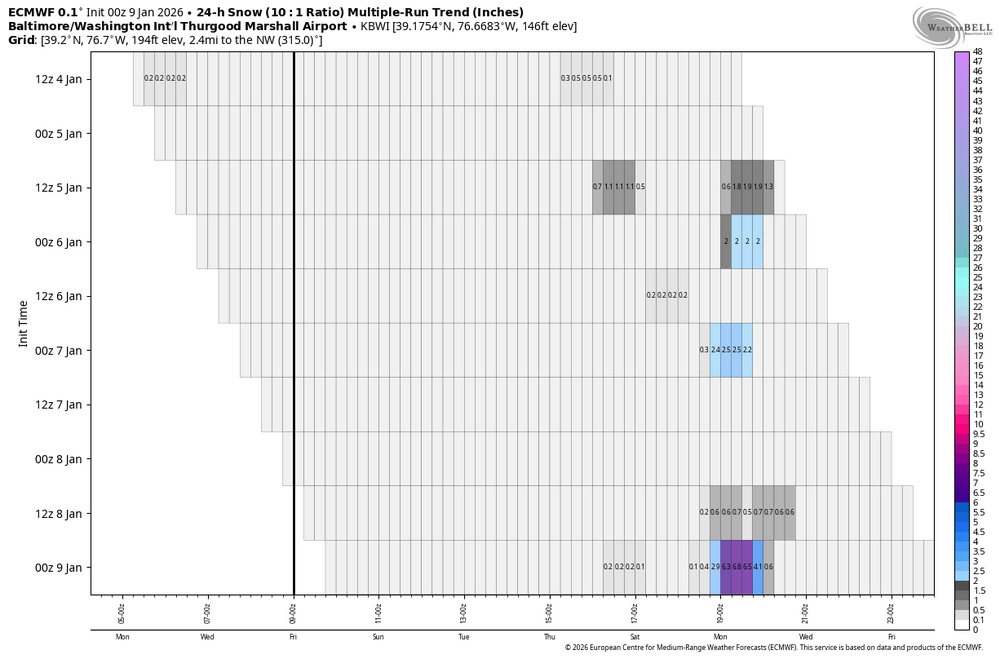
While 75+% of the EPS members give us no snow during the March 9th-10th period, there are now ~15% that give us several inches - strongest signal in several days yet still weak.
-
-
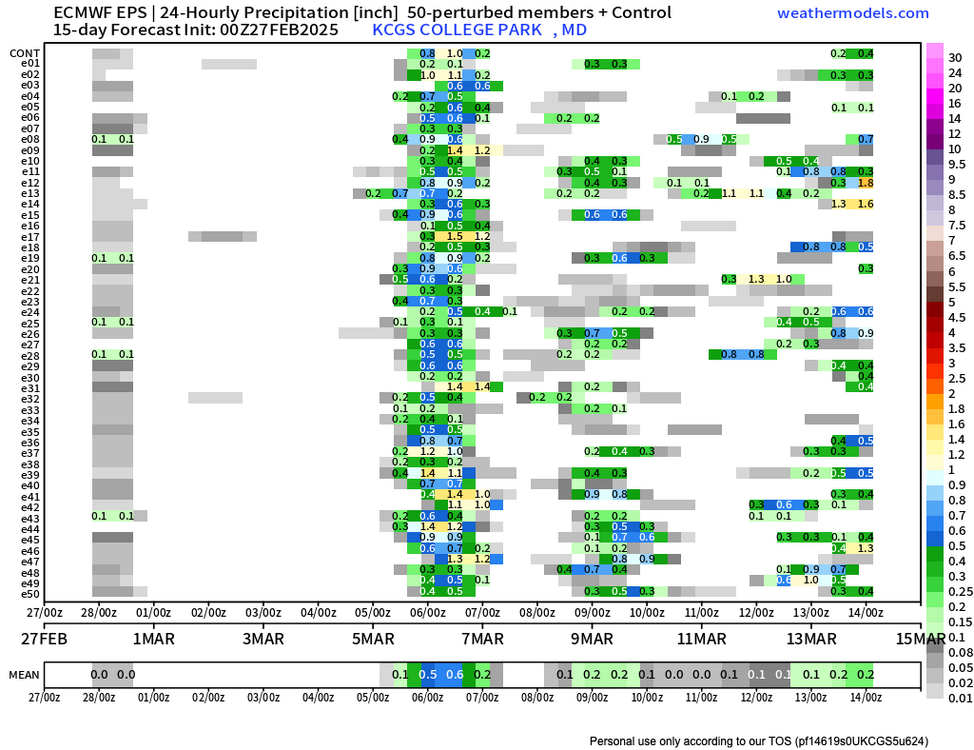
Over the last 7 model runs, the percent of EPS members giving College Park 3" of snow/sleet during the next 15 days has bounced between 4% and 12%; it is currently at 8%. Here are the 24-hour snow/sleet numbers from the latest run - weak signal persists for the 9th - 10th.
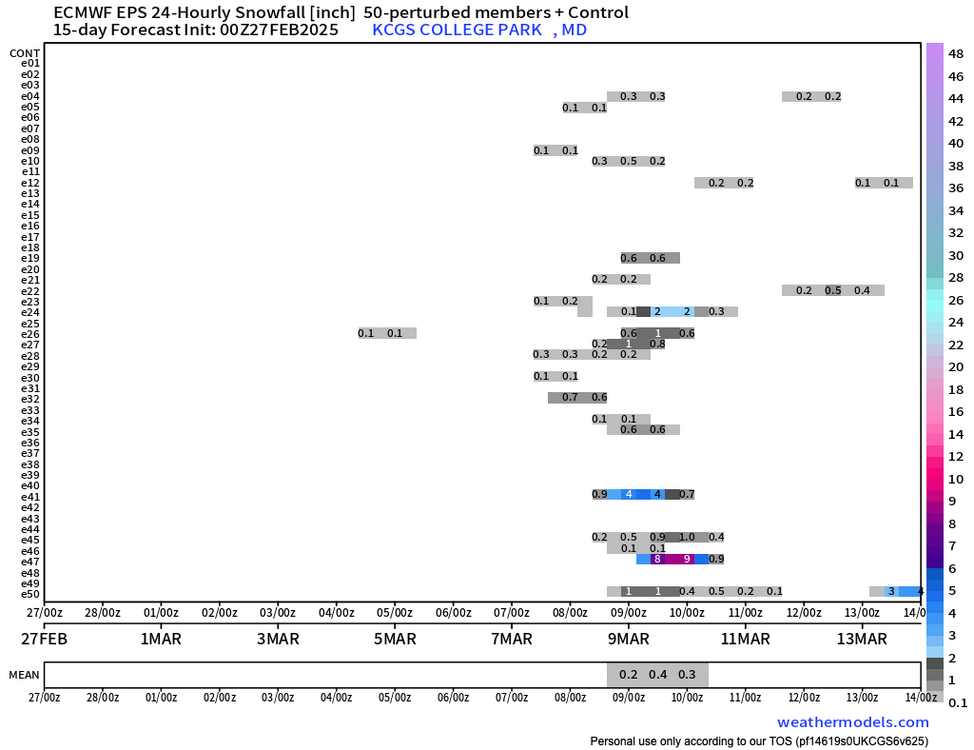
-
Not quite what you're looking for ... but ...
-
at least? StnID: kdca Profile Thermal Adjust: 0.0 Cloud RH threshold: 85% Average Hourly Sounding: NO Date/hour FHr Wind SfcT Ptype SR |Snow||Sleet|| FZRA|| QPF CumSR|TotSN||TotPL||TotZR|| TQPF S%| I%| L% ============================================================================================================================ 250218/1300Z 1 32009KT 23.3F 0:1| 0.0|| 0.00|| 0.00|| 0.000 0:1| 0.0|| 0.00|| 0.00|| 0.00 0| 0| 0 250218/1400Z 2 31011KT 24.0F 0:1| 0.0|| 0.00|| 0.00|| 0.000 0:1| 0.0|| 0.00|| 0.00|| 0.00 0| 0| 0 250218/1500Z 3 30011KT 24.5F 0:1| 0.0|| 0.00|| 0.00|| 0.000 0:1| 0.0|| 0.00|| 0.00|| 0.00 0| 0| 0 250218/1600Z 4 30011KT 25.8F 0:1| 0.0|| 0.00|| 0.00|| 0.000 0:1| 0.0|| 0.00|| 0.00|| 0.00 0| 0| 0 250218/1700Z 5 30011KT 26.9F 0:1| 0.0|| 0.00|| 0.00|| 0.000 0:1| 0.0|| 0.00|| 0.00|| 0.00 0| 0| 0 250218/1800Z 6 30011KT 27.4F 0:1| 0.0|| 0.00|| 0.00|| 0.000 0:1| 0.0|| 0.00|| 0.00|| 0.00 0| 0| 0 ----------------------------------------------+----++-----+-------------++--------------++-------------++-----------+---+--- 250218/1900Z 7 29010KT 27.8F 0:1| 0.0|| 0.00|| 0.00|| 0.000 0:1| 0.0|| 0.00|| 0.00|| 0.00 0| 0| 0 250218/2000Z 8 30010KT 28.1F 0:1| 0.0|| 0.00|| 0.00|| 0.000 0:1| 0.0|| 0.00|| 0.00|| 0.00 0| 0| 0 250218/2100Z 9 30009KT 28.7F 0:1| 0.0|| 0.00|| 0.00|| 0.000 0:1| 0.0|| 0.00|| 0.00|| 0.00 0| 0| 0 250218/2200Z 10 31008KT 27.6F 0:1| 0.0|| 0.00|| 0.00|| 0.000 0:1| 0.0|| 0.00|| 0.00|| 0.00 0| 0| 0 250218/2300Z 11 32007KT 25.2F 0:1| 0.0|| 0.00|| 0.00|| 0.000 0:1| 0.0|| 0.00|| 0.00|| 0.00 0| 0| 0 250219/0000Z 12 33007KT 23.8F 0:1| 0.0|| 0.00|| 0.00|| 0.000 0:1| 0.0|| 0.00|| 0.00|| 0.00 0| 0| 0 ----------------------------------------------+----++-----+-------------++--------------++-------------++-----------+---+--- 250219/0100Z 13 34007KT 22.5F 0:1| 0.0|| 0.00|| 0.00|| 0.000 0:1| 0.0|| 0.00|| 0.00|| 0.00 0| 0| 0 250219/0200Z 14 33007KT 21.5F 0:1| 0.0|| 0.00|| 0.00|| 0.000 0:1| 0.0|| 0.00|| 0.00|| 0.00 0| 0| 0 250219/0300Z 15 34007KT 20.7F 0:1| 0.0|| 0.00|| 0.00|| 0.000 0:1| 0.0|| 0.00|| 0.00|| 0.00 0| 0| 0 250219/0400Z 16 33006KT 19.3F 0:1| 0.0|| 0.00|| 0.00|| 0.000 0:1| 0.0|| 0.00|| 0.00|| 0.00 0| 0| 0 250219/0500Z 17 33006KT 18.4F 0:1| 0.0|| 0.00|| 0.00|| 0.000 0:1| 0.0|| 0.00|| 0.00|| 0.00 0| 0| 0 250219/0600Z 18 33007KT 17.9F 0:1| 0.0|| 0.00|| 0.00|| 0.000 0:1| 0.0|| 0.00|| 0.00|| 0.00 0| 0| 0 ----------------------------------------------+----++-----+-------------++--------------++-------------++-----------+---+--- 250219/0700Z 19 33006KT 17.1F 0:1| 0.0|| 0.00|| 0.00|| 0.000 0:1| 0.0|| 0.00|| 0.00|| 0.00 0| 0| 0 250219/0800Z 20 33006KT 17.0F 0:1| 0.0|| 0.00|| 0.00|| 0.000 0:1| 0.0|| 0.00|| 0.00|| 0.00 0| 0| 0 250219/0900Z 21 33006KT 16.4F 0:1| 0.0|| 0.00|| 0.00|| 0.000 0:1| 0.0|| 0.00|| 0.00|| 0.00 0| 0| 0 250219/1000Z 22 33005KT 16.4F 0:1| 0.0|| 0.00|| 0.00|| 0.000 0:1| 0.0|| 0.00|| 0.00|| 0.00 0| 0| 0 250219/1100Z 23 33005KT 15.3F 0:1| 0.0|| 0.00|| 0.00|| 0.000 0:1| 0.0|| 0.00|| 0.00|| 0.00 0| 0| 0 250219/1200Z 24 33005KT 16.4F 0:1| 0.0|| 0.00|| 0.00|| 0.000 0:1| 0.0|| 0.00|| 0.00|| 0.00 0| 0| 0 ----------------------------------------------+----++-----+-------------++--------------++-------------++-----------+---+--- 250219/1300Z 25 33006KT 17.5F 0:1| 0.0|| 0.00|| 0.00|| 0.000 0:1| 0.0|| 0.00|| 0.00|| 0.00 0| 0| 0 250219/1400Z 26 32006KT 18.9F 0:1| 0.0|| 0.00|| 0.00|| 0.000 0:1| 0.0|| 0.00|| 0.00|| 0.00 0| 0| 0 250219/1500Z 27 33006KT 19.5F 0:1| 0.0|| 0.00|| 0.00|| 0.000 0:1| 0.0|| 0.00|| 0.00|| 0.00 0| 0| 0 250219/1600Z 28 33005KT 21.1F 0:1| 0.0|| 0.00|| 0.00|| 0.000 0:1| 0.0|| 0.00|| 0.00|| 0.00 0| 0| 0 250219/1700Z 29 33005KT 21.6F 0:1| 0.0|| 0.00|| 0.00|| 0.000 0:1| 0.0|| 0.00|| 0.00|| 0.00 0| 0| 0 250219/1800Z 30 33005KT 22.2F 0:1| 0.0|| 0.00|| 0.00|| 0.000 0:1| 0.0|| 0.00|| 0.00|| 0.00 0| 0| 0 ----------------------------------------------+----++-----+-------------++--------------++-------------++-----------+---+--- 250219/1900Z 31 33005KT 22.4F 0:1| 0.0|| 0.00|| 0.00|| 0.000 0:1| 0.0|| 0.00|| 0.00|| 0.00 0| 0| 0 250219/2000Z 32 32003KT 22.7F 0:1| 0.0|| 0.00|| 0.00|| 0.000 0:1| 0.0|| 0.00|| 0.00|| 0.00 0| 0| 0 250219/2100Z 33 VRB01KT 21.6F 0:1| 0.0|| 0.00|| 0.00|| 0.000 0:1| 0.0|| 0.00|| 0.00|| 0.00 0| 0| 0 250219/2200Z 34 VRB01KT 20.7F SNOW 13:1| 0.1|| 0.00|| 0.00|| 0.009 13:1| 0.1|| 0.00|| 0.00|| 0.01 100| 0| 0 250219/2300Z 35 VRB02KT 21.1F SNOW 14:1| 0.1|| 0.00|| 0.00|| 0.010 13:1| 0.3|| 0.00|| 0.00|| 0.02 100| 0| 0 250220/0000Z 36 VRB01KT 21.3F SNOW 18:1| 0.2|| 0.00|| 0.00|| 0.009 15:1| 0.4|| 0.00|| 0.00|| 0.03 100| 0| 0 ----------------------------------------------+----++-----+-------------++--------------++-------------++-----------+---+--- 250220/0100Z 37 33003KT 21.5F SNOW 19:1| 0.3|| 0.00|| 0.00|| 0.019 16:1| 0.8|| 0.00|| 0.00|| 0.05 100| 0| 0 250220/0200Z 38 36005KT 21.5F SNOW 20:1| 0.4|| 0.00|| 0.00|| 0.019 17:1| 1.1|| 0.00|| 0.00|| 0.06 100| 0| 0 250220/0300Z 39 36009KT 21.5F SNOW 20:1| 0.2|| 0.00|| 0.00|| 0.009 18:1| 1.3|| 0.00|| 0.00|| 0.07 100| 0| 0 250220/0400Z 40 01008KT 21.6F SNOW 19:1| 0.1|| 0.00|| 0.00|| 0.007 18:1| 1.5|| 0.00|| 0.00|| 0.08 100| 0| 0 250220/0500Z 41 02006KT 21.8F SNOW 14:1| 0.2|| 0.00|| 0.00|| 0.013 17:1| 1.6|| 0.00|| 0.00|| 0.09 100| 0| 0 250220/0600Z 42 02005KT 22.0F SNOW 18:1| 0.9|| 0.00|| 0.00|| 0.048 18:1| 2.5|| 0.00|| 0.00|| 0.14 100| 0| 0 ----------------------------------------------+----++-----+-------------++--------------++-------------++-----------+---+--- 250220/0700Z 43 02004KT 22.2F SNOW 17:1| 1.0|| 0.00|| 0.00|| 0.060 18:1| 3.6|| 0.00|| 0.00|| 0.20 100| 0| 0 250220/0800Z 44 01005KT 22.4F SNOW 19:1| 0.9|| 0.00|| 0.00|| 0.051 18:1| 4.5|| 0.00|| 0.00|| 0.25 100| 0| 0 250220/0900Z 45 36005KT 22.4F SNOW 18:1| 0.7|| 0.00|| 0.00|| 0.040 18:1| 5.2|| 0.00|| 0.00|| 0.29 100| 0| 0 250220/1000Z 46 36006KT 22.4F SNOW 20:1| 0.8|| 0.00|| 0.00|| 0.041 18:1| 6.0|| 0.00|| 0.00|| 0.33 100| 0| 0 250220/1100Z 47 35006KT 22.5F SNOW 24:1| 0.8|| 0.00|| 0.00|| 0.031 19:1| 6.8|| 0.00|| 0.00|| 0.37 100| 0| 0 250220/1200Z 48 36006KT 22.5F SNOW 20:1| 0.5|| 0.00|| 0.00|| 0.027 19:1| 7.3|| 0.00|| 0.00|| 0.39 100| 0| 0 ----------------------------------------------+----++-----+-------------++--------------++-------------++-----------+---+--- 250220/1300Z 49 36006KT 23.1F SNOW 21:1| 0.6|| 0.00|| 0.00|| 0.028 19:1| 7.9|| 0.00|| 0.00|| 0.42 100| 0| 0 250220/1400Z 50 35007KT 23.6F SNOW 20:1| 0.5|| 0.00|| 0.00|| 0.026 19:1| 8.4|| 0.00|| 0.00|| 0.45 100| 0| 0 250220/1500Z 51 34007KT 23.8F SNOW 15:1| 0.4|| 0.00|| 0.00|| 0.024 19:1| 8.8|| 0.00|| 0.00|| 0.47 100| 0| 0 250220/1600Z 52 34008KT 24.2F SNOW 17:1| 0.2|| 0.00|| 0.00|| 0.013 19:1| 9.0|| 0.00|| 0.00|| 0.48 100| 0| 0 250220/1700Z 53 33010KT 24.2F SNOW 24:1| 0.3|| 0.00|| 0.00|| 0.014 19:1| 9.4|| 0.00|| 0.00|| 0.50 100| 0| 0 250220/1800Z 54 32010KT 23.4F SNOW 13:1| 0.2|| 0.00|| 0.00|| 0.013 19:1| 9.5|| 0.00|| 0.00|| 0.51 100| 0| 0 ----------------------------------------------+----++-----+-------------++--------------++-------------++-----------+---+--- 250220/1900Z 55 32010KT 24.0F SNOW 8:1| 0.2|| 0.00|| 0.00|| 0.027 18:1| 9.8|| 0.00|| 0.00|| 0.54 100| 0| 0 250220/2000Z 56 32011KT 24.9F SNOW 10:1| 0.1|| 0.00|| 0.00|| 0.012 18:1| 9.9|| 0.00|| 0.00|| 0.55 100| 0| 0
-
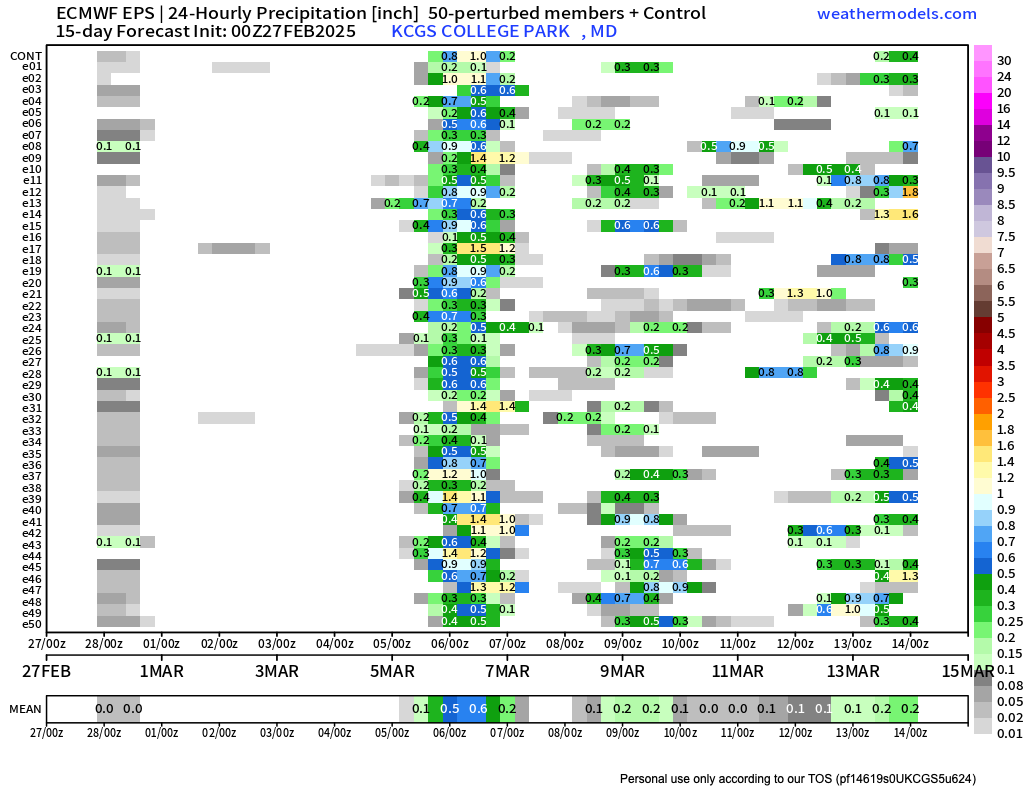
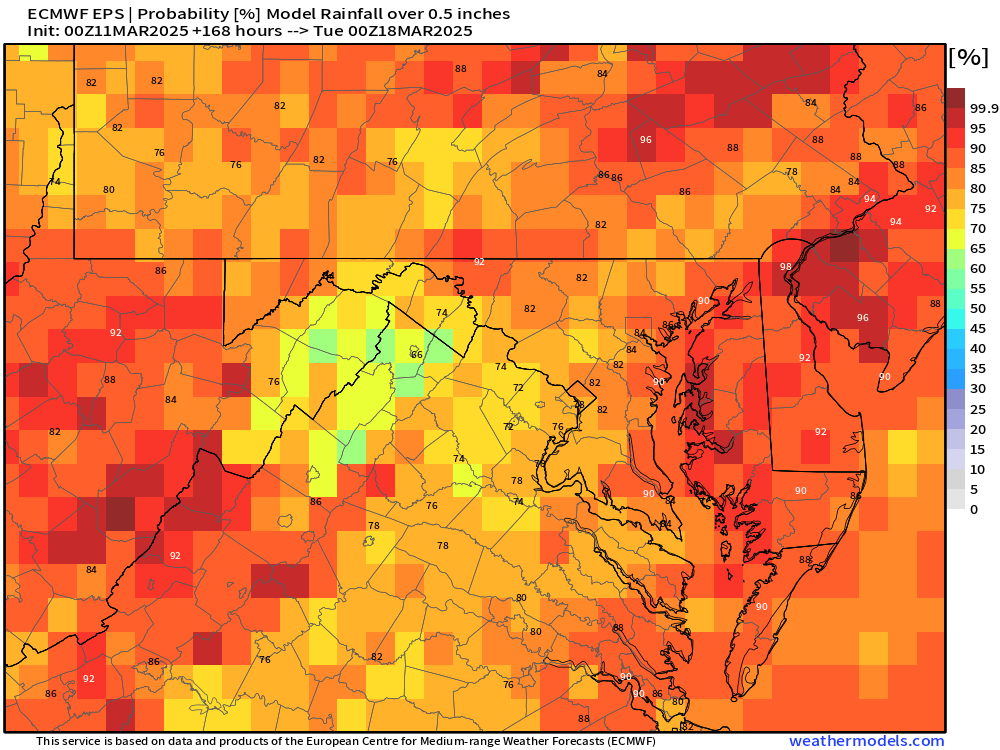
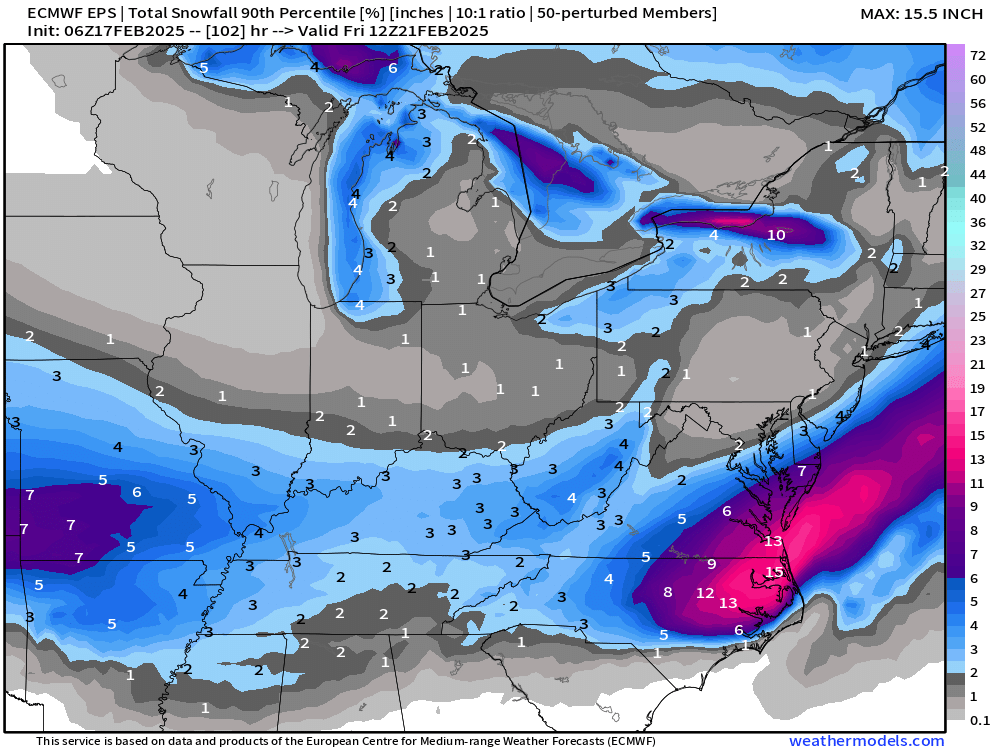
While the median forecast snow/sleet from the ECMWF EPS is about 0.1" for most of us, the 90th PCTL outcome shows the 2" line just southeast of many of us.
-
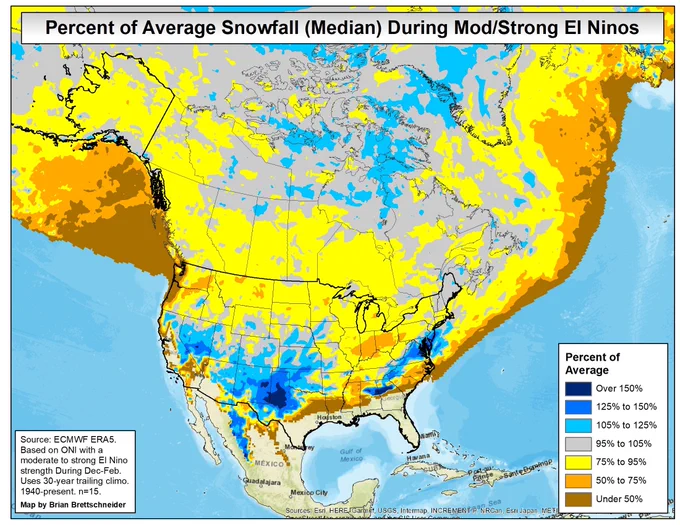
I know you're joking, but I believe it trained on selected years from the 40-year ERA5 reanalysis, which covered 1979 - 2018. A reanalysis blends model output with observations. The resolution of the training data set is 1 x 1 degrees, so relatively coarse.