Random Chaos
-
Posts
904 -
Joined
-
Last visited
Content Type
Profiles
Blogs
Forums
American Weather
Media Demo
Store
Gallery
Everything posted by Random Chaos
-
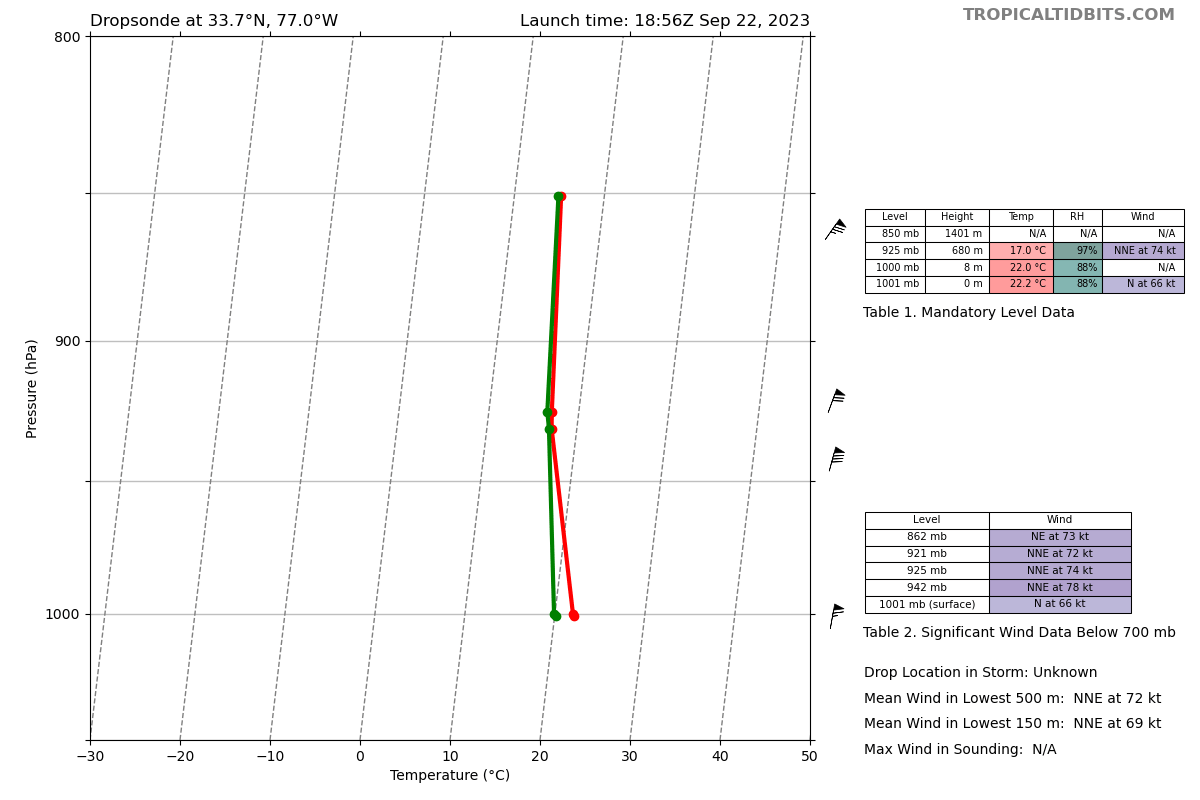
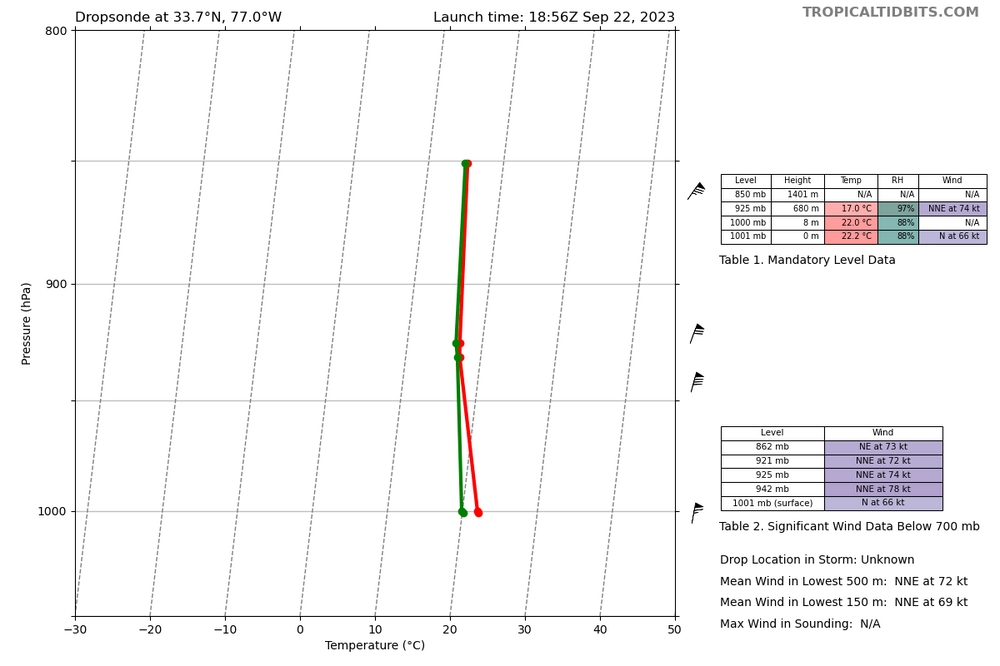
 No, 925mb on what I posted was 74kt. Surface at 1001mb was 66kt.
 -
And dropsonde with 66kt surface.
-
Dropsonde found 66kt at surface NW of center. Category 1 threshold is 64kt.

-
You might lose power. Better stock on ice chests instead.
-
I was looking at the shear map’s just yesterday morning expecting that. With the vorticity of a tropical cyclone when storms in its bands come ashore it’s common to get weak tornadoes.
-
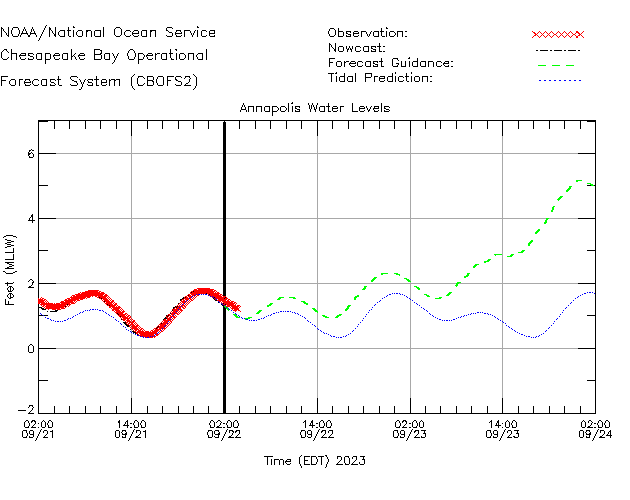
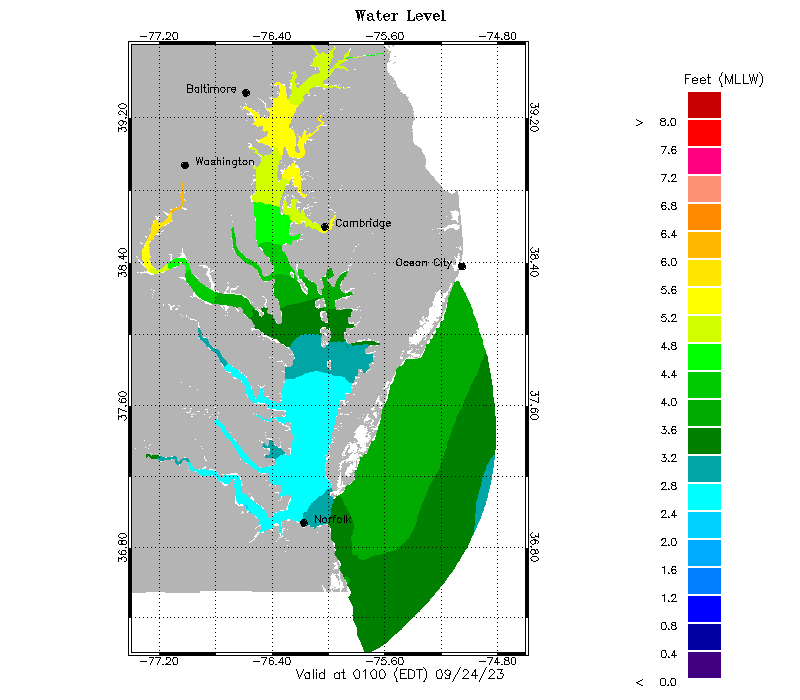
Extreme tides now forecast for Annapolis:
-
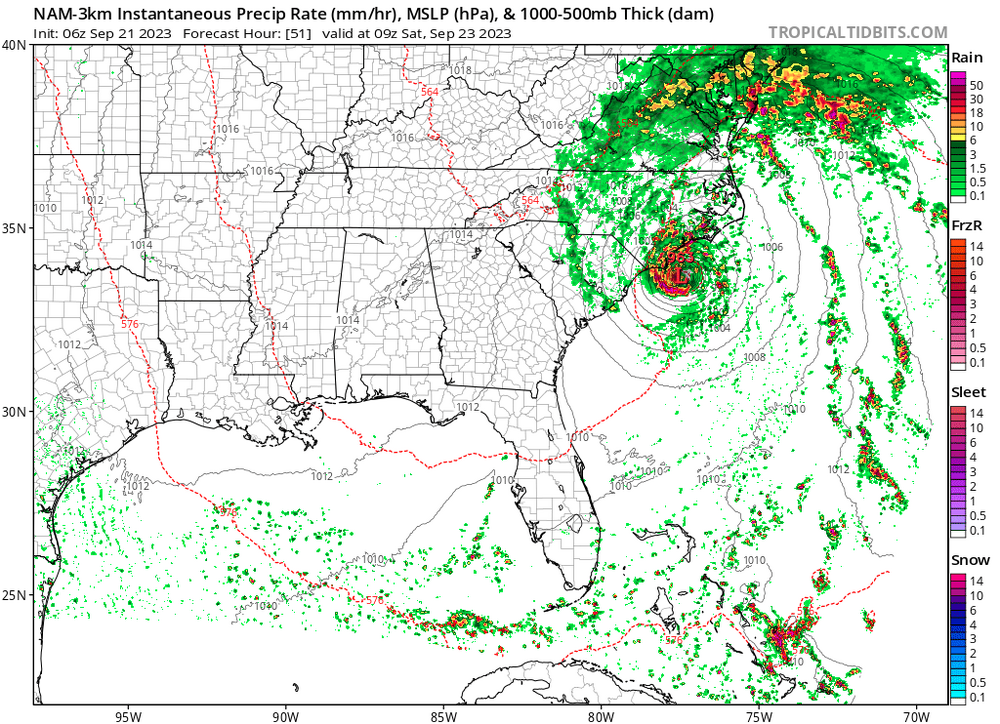
Based on the model output, heaviest winds near the bay are likely overnight Friday into Saturday AM, probably from around midnight to 10am. This is a band well ahead of the main storm which will still be down in North Carolina at that time. Midday Saturday we should have relaxed winds (still 20kt+) and less gusty between the leading band and the main storm before it picks up again Saturday evening as the main storm center approaches, though less windy than the leading band the previous night. Heaviest rain is harder to forecast due to substantial model divergence but seems to generally correspond to the heaviest winds.
-
Where’s the rain/snow line? in seriousness, don’t like 58mph gusts near me…
-
I plan to post data on how high the tide gets on the west side. Got a staff gauge on my pier zeroed to zero datum (can look up the offset from mean low water to that).
-
I'll believe it when we get snow.
-
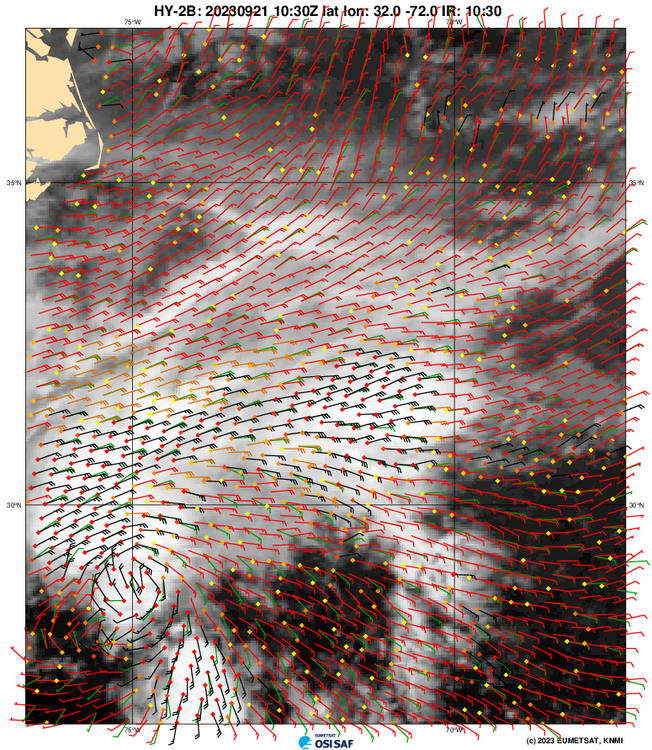
Waiting for CBOFS tide forecasts to get in range. Wind direction is going to be NE initially which will push water toward the western side of the Bay. This is NHC:
-
Was even faster - the 40% was in the 2-7 day period. It was only 10% in the 48hr period just 3 hours ago.
-
The ASCAT pass I posted in the other Tropical subforum thread shows a closed low as of 4 hours ago. So not surprised they are escalating quickly.
-
ASCAT pass from about 4 hours ago:
-
Oh NAM… I know it’s not good with tropical systems… but wow…963mb cyclone
-
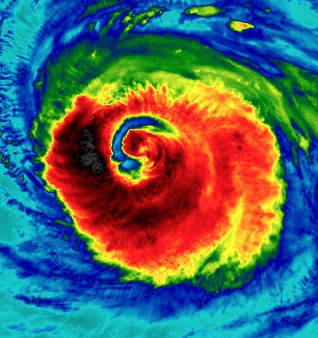
This is going to be one giant eye when it finishes clearing out the remnants of the old eye. Probably 12-ish hours left on that.
-
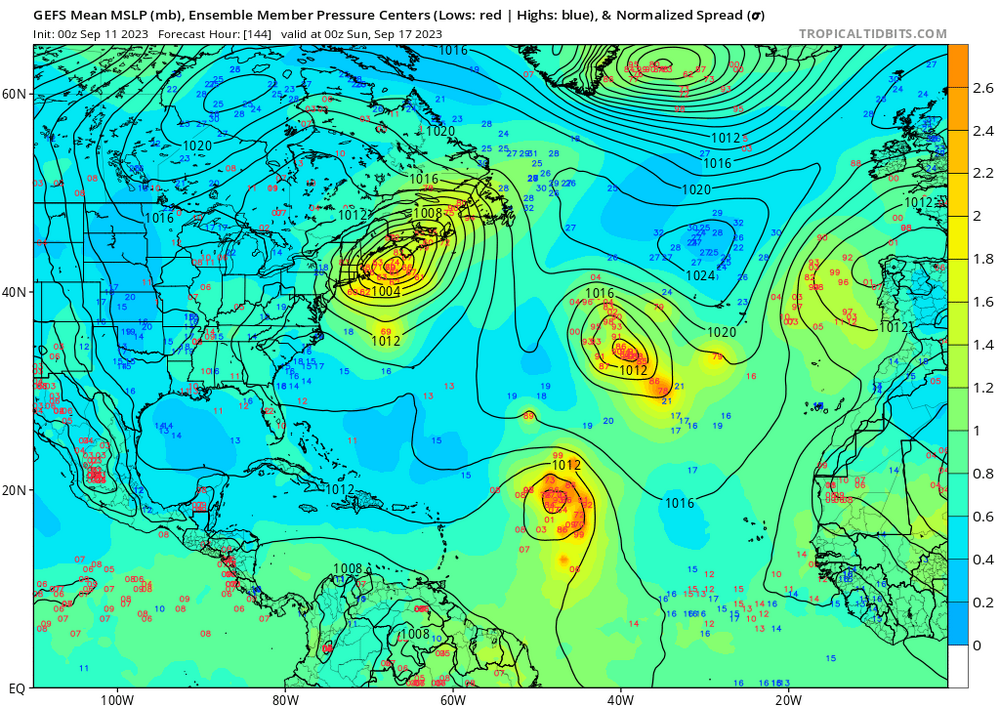
0Z GEFS has 100% of the members showing a landfall in either New England or adjacent Canada, with a fairly even distribution between Long Island through Newfoundland & PEI.
-
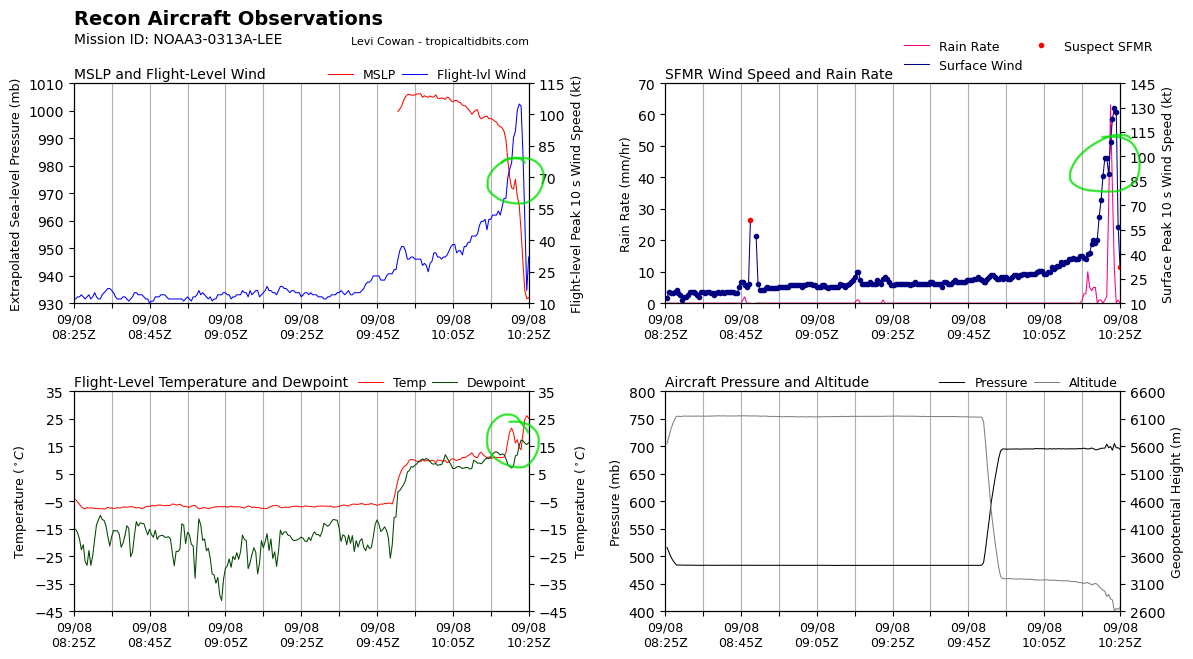
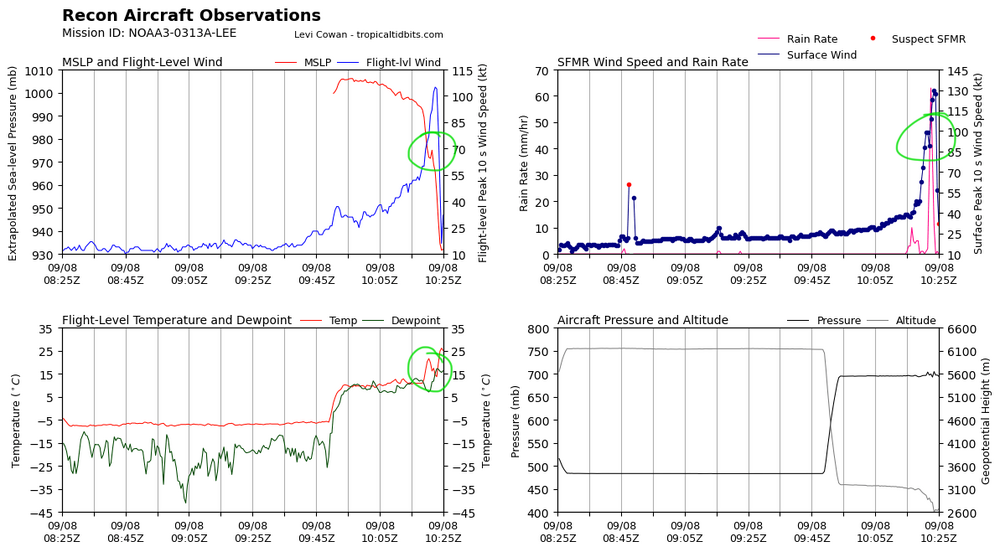
It is impressive it’s maintaining 959mb pressure with an open eyewall (per latest dropsonde and vortex report). But it feels like 87kt might be underestimated; 3 hours ago a dropsonde found 96kt surface winds and the latest dropsonde found 86kt surface winds with two 106kt unflagged SFMR readings. This system seems stronger than it has any right to be given the shear and satellite appearance. I also feel the standard flight level to surface wind adjustments haven’t matched what empirical data has shown with this storm the last two days; the surface winds are consistently stronger than they should be given observed flight level winds.
-
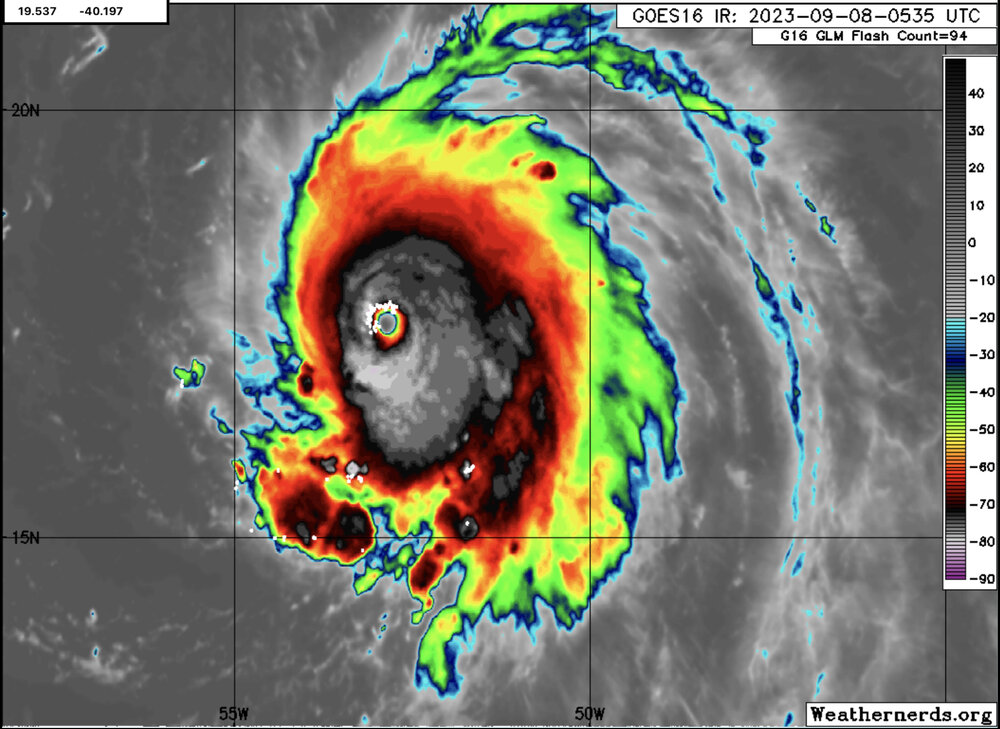
It’s amazing that even with shear now 24 hours in the core has been constantly emitting heavy lightning for the past 40+ hours. This storm seems primed to reintensify the moment the shear relaxes.
-
Indications of a double maxima on recon, but it’s subtle. Probably the start of an ERC and if so likely the cause of the degraded appearance on satellite this morning:
-
I hope that recon gets there soon. Eye has filled in and is occluded, but lightening is going insane (have a 80-150 strokes per 10 minutes the past 2 hours!). I think it might be an ERC but the latest microwave pass was too long ago (2.5 hours). I’m basing this on the eye becoming a pinhole just before vanishing plus IR looking like a second maximum cold ring is now appearing about 15-20nm radius. If so this might be the fastest nothing to ERC I’ve ever heard of (normally they take 12-24 hrs).
-
Interesting (not based on the most recent VDM):
-
We are continuing to see large quantities of lightning in the eyewall, been continuous for the past 9 hours with the number of strikes increasing in the past 1-2 hours. Seen several 90+ strikes per 10 minutes in the past hour. https://www.weathernerds.org/satellite/?initsatsrc=On&initsatname=GOES-E&initsattype=ir&initcscheme=ir1&initimdimx=1050&initimdimy=764&initrange=21.250:-58.250:12.750:-44.250&initloop=True&initnframes=20&initlightningge=On&initlightninggw=Off&initltngfed=Off&initltngtoe=Off&initinterstates=On&initwarnings=On&initlatlon=On&initascatb=Off&initascatc=Off&initascatambb=Off&initascatambc=Off&initsst=Off&initecens=Off&initgefs=Off
-
New VORTEX message. Couple notes: 28C eye temperature. 14nm circular eye, 1nm less than last recon 158kt SFMR ————— Product: Air Force Vortex Message (URNT12 KNHC)Transmitted: 8th day of the month at 5:26ZAgency: United States Air Force Aircraft: Lockheed WC-130J Hercules with reg. number AF97-5306 Storm Name: LeeStorm Number & Year: 13 in 2023 (flight in the North Atlantic basin)Mission Number: 2Observation Number: 28A. Time of Center Fix: 8th day of the month at 4:54:40ZB. Center Fix Coordinates: 17.40N 52.87W (View map) B. Center Fix Location: 538 statute miles (866 km) to the ENE (57°) from Bridgetown, Barbados.C. Minimum Height at Standard Level: 2,508m (8,228ft) at 700mbD. Minimum Sea Level Pressure: 928mb (27.41 inHg)E. Dropsonde Surface Wind at Center: From 330° at 20kts (From the NNW at 23mph)F. Eye Character: ClosedG. Eye Shape & Diameter: Circular with a diameter of 14 nautical miles (16 statute miles)H. Estimated (by SFMR or visually) Maximum Surface Wind Inbound: 124kts (142.7mph)I. Location & Time of the Estimated Maximum Surface Wind Inbound: 10 nautical miles (12 statute miles) to the SE (137°) of center fix at 4:51:30ZJ. Maximum Flight Level Wind Inbound: From 228° at 131kts (From the SW at 150.8mph)K. Location & Time of the Maximum Flight Level Wind Inbound: 11 nautical miles (13 statute miles) to the SE (138°) of center fix at 4:51:00ZL. Estimated (by SFMR or visually) Maximum Surface Wind Outbound: 158kts (181.8mph)M. Location & Time of the Estimated Maximum Surface Wind Outbound: 8 nautical miles to the NNW (334°) of center fix at 4:59:00ZN. Maximum Flight Level Wind Outbound: From 62° at 153kts (From the ENE at 176.1mph)O. Location & Time of the Maximum Flight Level Wind Outbound: 9 nautical miles to the NNW (330°) of center fix at 4:59:30ZP. Maximum Flight Level Temp & Pressure Altitude Outside Eye: 13°C (55°F) at a pressure alt. of 3,056m (10,026ft)Q. Maximum Flight Level Temp & Pressure Altitude Inside Eye: 28°C (82°F) at a pressure alt. of 3,038m (9,967ft)R. Dewpoint Temp (collected at same location as temp inside eye): -1°C (30°F)R. Sea Surface Temp (collected at same location as temp inside eye): Not AvailableS. Fix Determined By: Penetration, Radar, Wind, Pressure and TemperatureS. Fix Level: 700mbT. Navigational Fix Accuracy: 0.02 nautical milesT. Meteorological Accuracy: 1 nautical mileRemarks Section: Maximum Flight Level Wind: 153kts (~ 176.1mph) which was observed 9 nautical miles to the NNW (330°) from the flight level center at 4:59:30Z
-
045900 1732N 05255W 6936 02699 //// +109 //// 067132 144 158 027 01 045930 1733N 05257W 6969 02774 //// +079 //// 062148 153 153 055 01 153 and 158kt SFMR unflagged, NW quadrant.