All Activity
- Past hour
-

July 2025 Discussion-OBS - seasonable summer variability
Sundog replied to wdrag's topic in New York City Metro
Meanwhile what is this crap outside? I didn't expect this dreary mess out there today. And of course it's a Sunday. -
July 2025 Discussion-OBS - seasonable summer variability
Sundog replied to wdrag's topic in New York City Metro
Everyone's lows are up, it's a result of the higher average dewpoint. So maybe you used to get in the low to mid 60s and now you get in the mid to upper 60s. You just didn't cross the arbitrary threshold of "70" so it looks less dramatic on paper. No one is immune to the higher average lows since rural or urban the higher dewpoints ruin it for all of us. -

July 2025 Obs/Disco ... possible historic month for heat
BrianW replied to Typhoon Tip's topic in New England
Going to be many tropical like days in the woods...
-

July 2025 Obs/Disco ... possible historic month for heat
kdxken replied to Typhoon Tip's topic in New England
As would I. Certainly not going to be freezing cold. -
WPC once again ramping up rainfall totals.
-
Yeah I agree. A really amazing country with probably some of the happiest and most laid back people of any European Country. The flight attendant on my Air Swiss flight was fluent in like 6 languages.
-
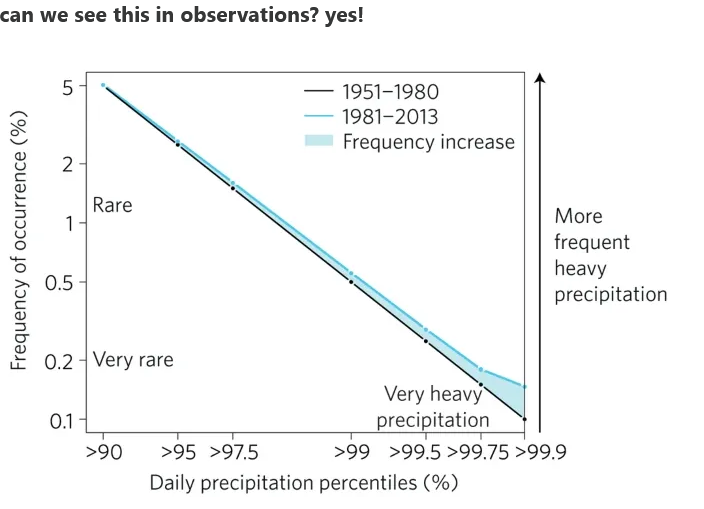
Climate science predicted decades ago that the increase in precipitation due to climate change would be focused in the heaviest events and that is exactly what we are seeing. Extreme rain events are increasing much faster than precipitation as a whole. Climate change doesn't cause any one single event; but it makes individual cases worse and extreme events much more likely. https://iacweb.ethz.ch/staff/fischer/download/etc/fischer_knutti_16.pdf https://www.theclimatebrink.com/p/update-on-texas-flooding
-

July 2025 Obs/Disco ... possible historic month for heat
dendrite replied to Typhoon Tip's topic in New England
The big ridging is moving out west. So like I said, we’ll threaten some mild downs at the end of that period if things hold. But I’d still lean a bit AN. -

July 2025 Discussion-OBS - seasonable summer variability
bluewave replied to wdrag's topic in New York City Metro
JFK is much closer to the top of the list on 70° lows with the much higher dewpoints. 70° Low Data for January 1, 2025 through July 12, 2025 Click column heading to sort ascending, click again to sort descending. LAGUARDIA AIRPORT WBAN 21 New York-LGA Area ThreadEx 21 NY CITY CENTRAL PARK WBAN 20 New York-Central Park Area ThreadEx 20 JFK INTERNATIONAL AIRPORT WBAN 17 New York-Kennedy Airport Area ThreadEx 17 FARMINGDALE REPUBLIC AP WBAN 14 ISLIP-LI MACARTHUR AP WBAN 14 Islip Area ThreadEx 14 70° Low Data for January 1, 2025 through July 12, 2025 Click column heading to sort ascending, click again to sort descending. NEWARK LIBERTY INTL AP WBAN 19 Newark Area ThreadEx 19 ATLANTIC CITY MARINA WBAN 18 HARRISON COOP 18 Atlantic City Marina Area ThreadEx 18 TETERBORO AIRPORT WBAN 17 MARGATE COOP 16 ATLANTIC CITY INTL AP WBAN 15 SOUTH JERSEY REGIONAL AIRPORT WBAN 15 Atlantic City Area ThreadEx 15 EB FORSYTHE NEW JERSEY RAWS 15 PENNSAUKEN 1N COOP 15 TETERBORO AIRPORT COOP 15 ESTELL MANOR COOP 14 -
July 2025 Obs/Disco ... possible historic month for heat
BrianW replied to Typhoon Tip's topic in New England
From Google AI. In the U.S., heat-related deaths have significantly increased in recent decades, with the number of deaths more than doubling from 1999 to 2023. In 2023 alone, over 2,300 deaths were attributed to heat, marking it as the deadliest year for heat-related fatalities. -
The day 1-7 qpf forecast looks almost exactly like it did for last week...... when I got a grand total of 0.20. Better luck this time!
-
July 2025 Obs/Disco ... possible historic month for heat
BrianW replied to Typhoon Tip's topic in New England
What a summer.. With strong Bermuda high in place, a S/SW flow will allow plenty of moisture to be sent our way. This combined with above normal high temperatures brings some potential for a heat wave, with heat index of 95-100 currently expected Wednesday and Thursday, and 100 to 105 for many spots on Thursday. LONG TERM /WEDNESDAY THROUGH SATURDAY/... ***Key Points*** *While still some uncertainty, there is the potential for a heat wave to continue Wednesday through Friday for many areas with max heat index values between 95 and 100 (2-day Heat Advisory Criteria) for Wednesday and Friday and 100 to 105 possible for Thursday (1-day Heat Advisory criteria). *Relatively active pattern with chances for several days of afternoon showers and thunderstorms. -

July 2025 Obs/Disco ... possible historic month for heat
Damage In Tolland replied to Typhoon Tip's topic in New England
All AN -
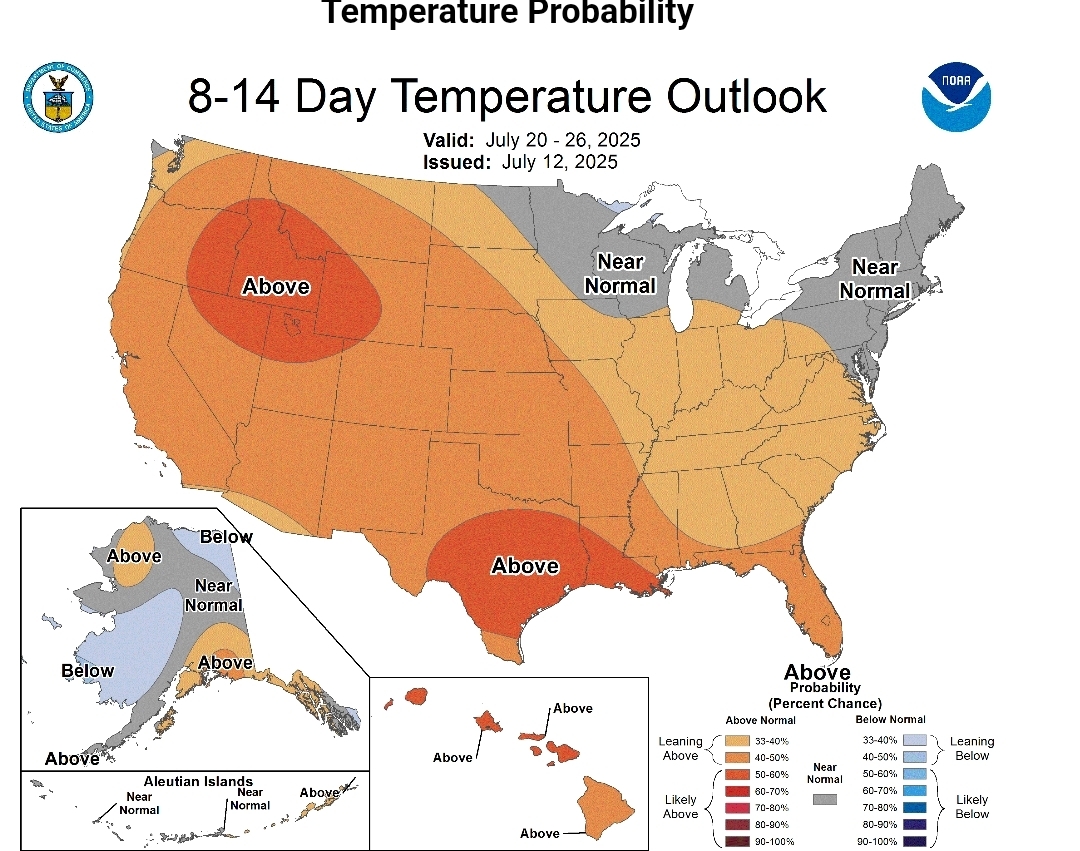
July 2025 Obs/Disco ... possible historic month for heat
kdxken replied to Typhoon Tip's topic in New England
Apparently the CPC doesn't see the torch.
- Today
-
July 2025 Obs/Disco ... possible historic month for heat
kdxken replied to Typhoon Tip's topic in New England
-
That was too before Walmart and telephone poles

-
July 2025 Obs/Disco ... possible historic month for heat
kdxken replied to Typhoon Tip's topic in New England
Probably a lot more that don't immediately come to mind too. Increased humidity likely leads to more mold, rotting of building materials and so on. -
July 2025 Obs/Disco ... possible historic month for heat
kdxken replied to Typhoon Tip's topic in New England
66° with a little misery mist. Yuck -
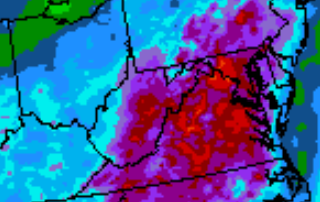
Central Texas is done for. Some places will get 12 inches of rain by 7pm tonight. It has been good knowin' y'all. Ground is saturated. That much rain is apocalyptic. If you can, get out of central Texas while you still can. Fly far away from the absolute devastation to come. Our time has run out. I am poor. I will perish here. No way out. None at all.
-
July 2025 Obs/Disco ... possible historic month for heat
dendrite replied to Typhoon Tip's topic in New England
64.9° I had to laugh at Watertown being almost 80° all night. West of the CRV is on fire. -
 Mental run mate
 -

July 2025 Obs/Disco ... possible historic month for heat
powderfreak replied to Typhoon Tip's topic in New England
Low of 70F… +15. BTV hasn’t been below 77F tonight. That’s a tough night if you don’t have A/C. Nocturnal storms and clouds, and away from the cooler maritime air mass up this way.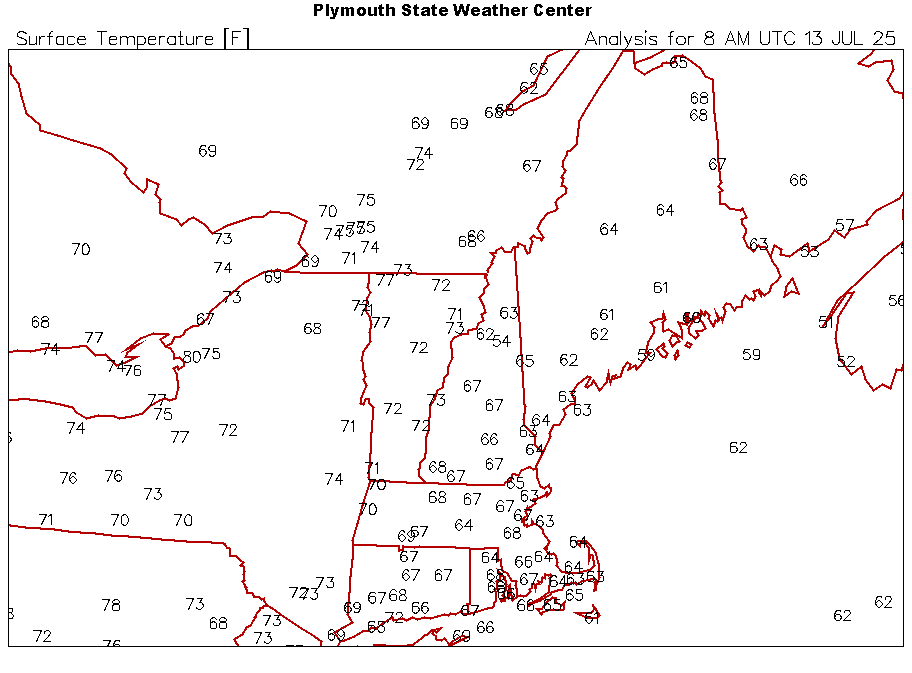
-

Gulf AOI Watch: The Season’s Not Sleeping Yet! (0/20)
tiger_deF replied to BarryStantonGBP's topic in Tropical Headquarters
I’m expecting the models to back on and off of development of this feature, especially given the background state, but this ICON run is an eye opener
-

July 2025 Discussion-OBS - seasonable summer variability
JerseyWx replied to wdrag's topic in New York City Metro
Our summers have always been hazy, hot and humid. That's just typical Jersey and New York climate. Yes I know that it has gotten worse, with dewpoints averaging higher than they used to, but it's not like we were ever arid like the high desert out west. -
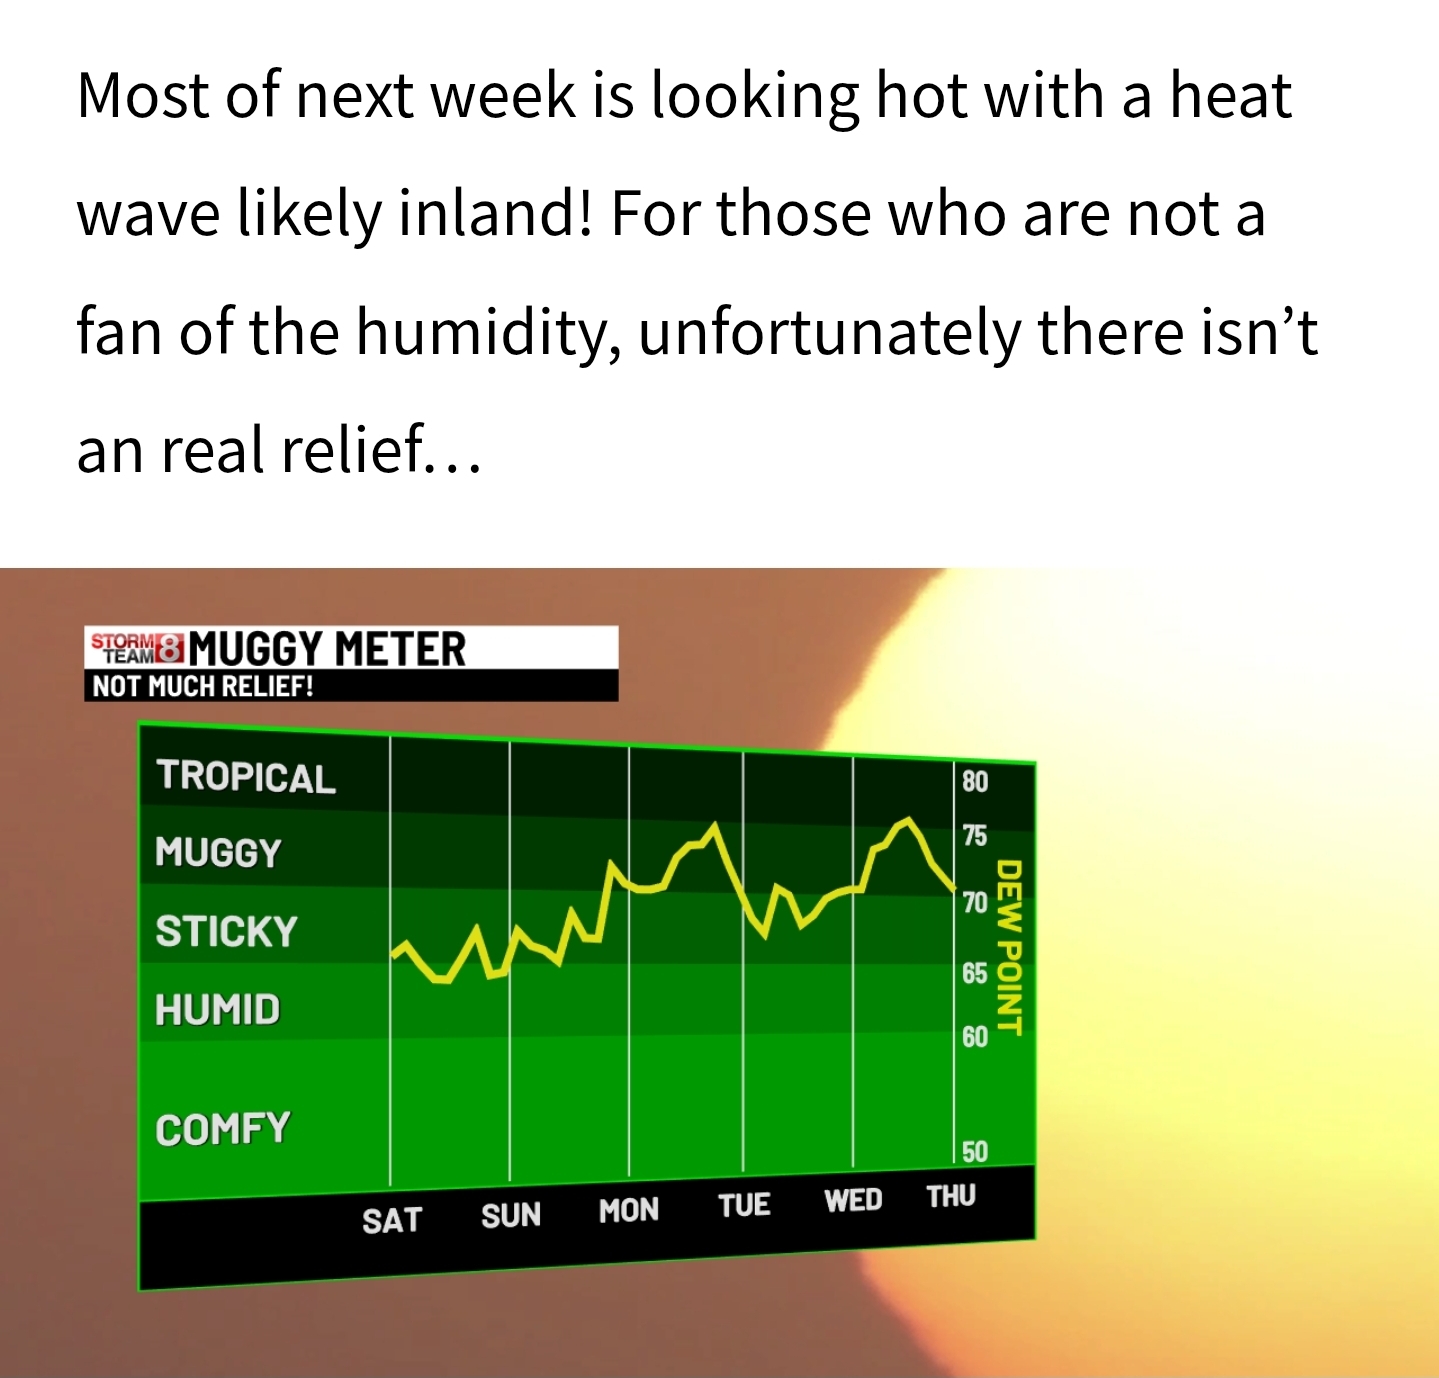
another day of dews 75-80F. Just unreal.


.thumb.jpg.6a4895b2a43f87359e4e7d04a6fa0d14.jpg)