All Activity
- Past hour
-

Augdewst 2026: Summer's Last Stand
CoastalWx replied to Prismshine Productions's topic in New England
Come my sheep, for I am thy shepherd. -
Like a Jungle out there.
-

Augdewst 2026: Summer's Last Stand
Prismshine Productions replied to Prismshine Productions's topic in New England
What a temperature difference... 110-116 in the Dakotas while we in the 50s/60s Sent from my SM-S176V using Tapatalk -
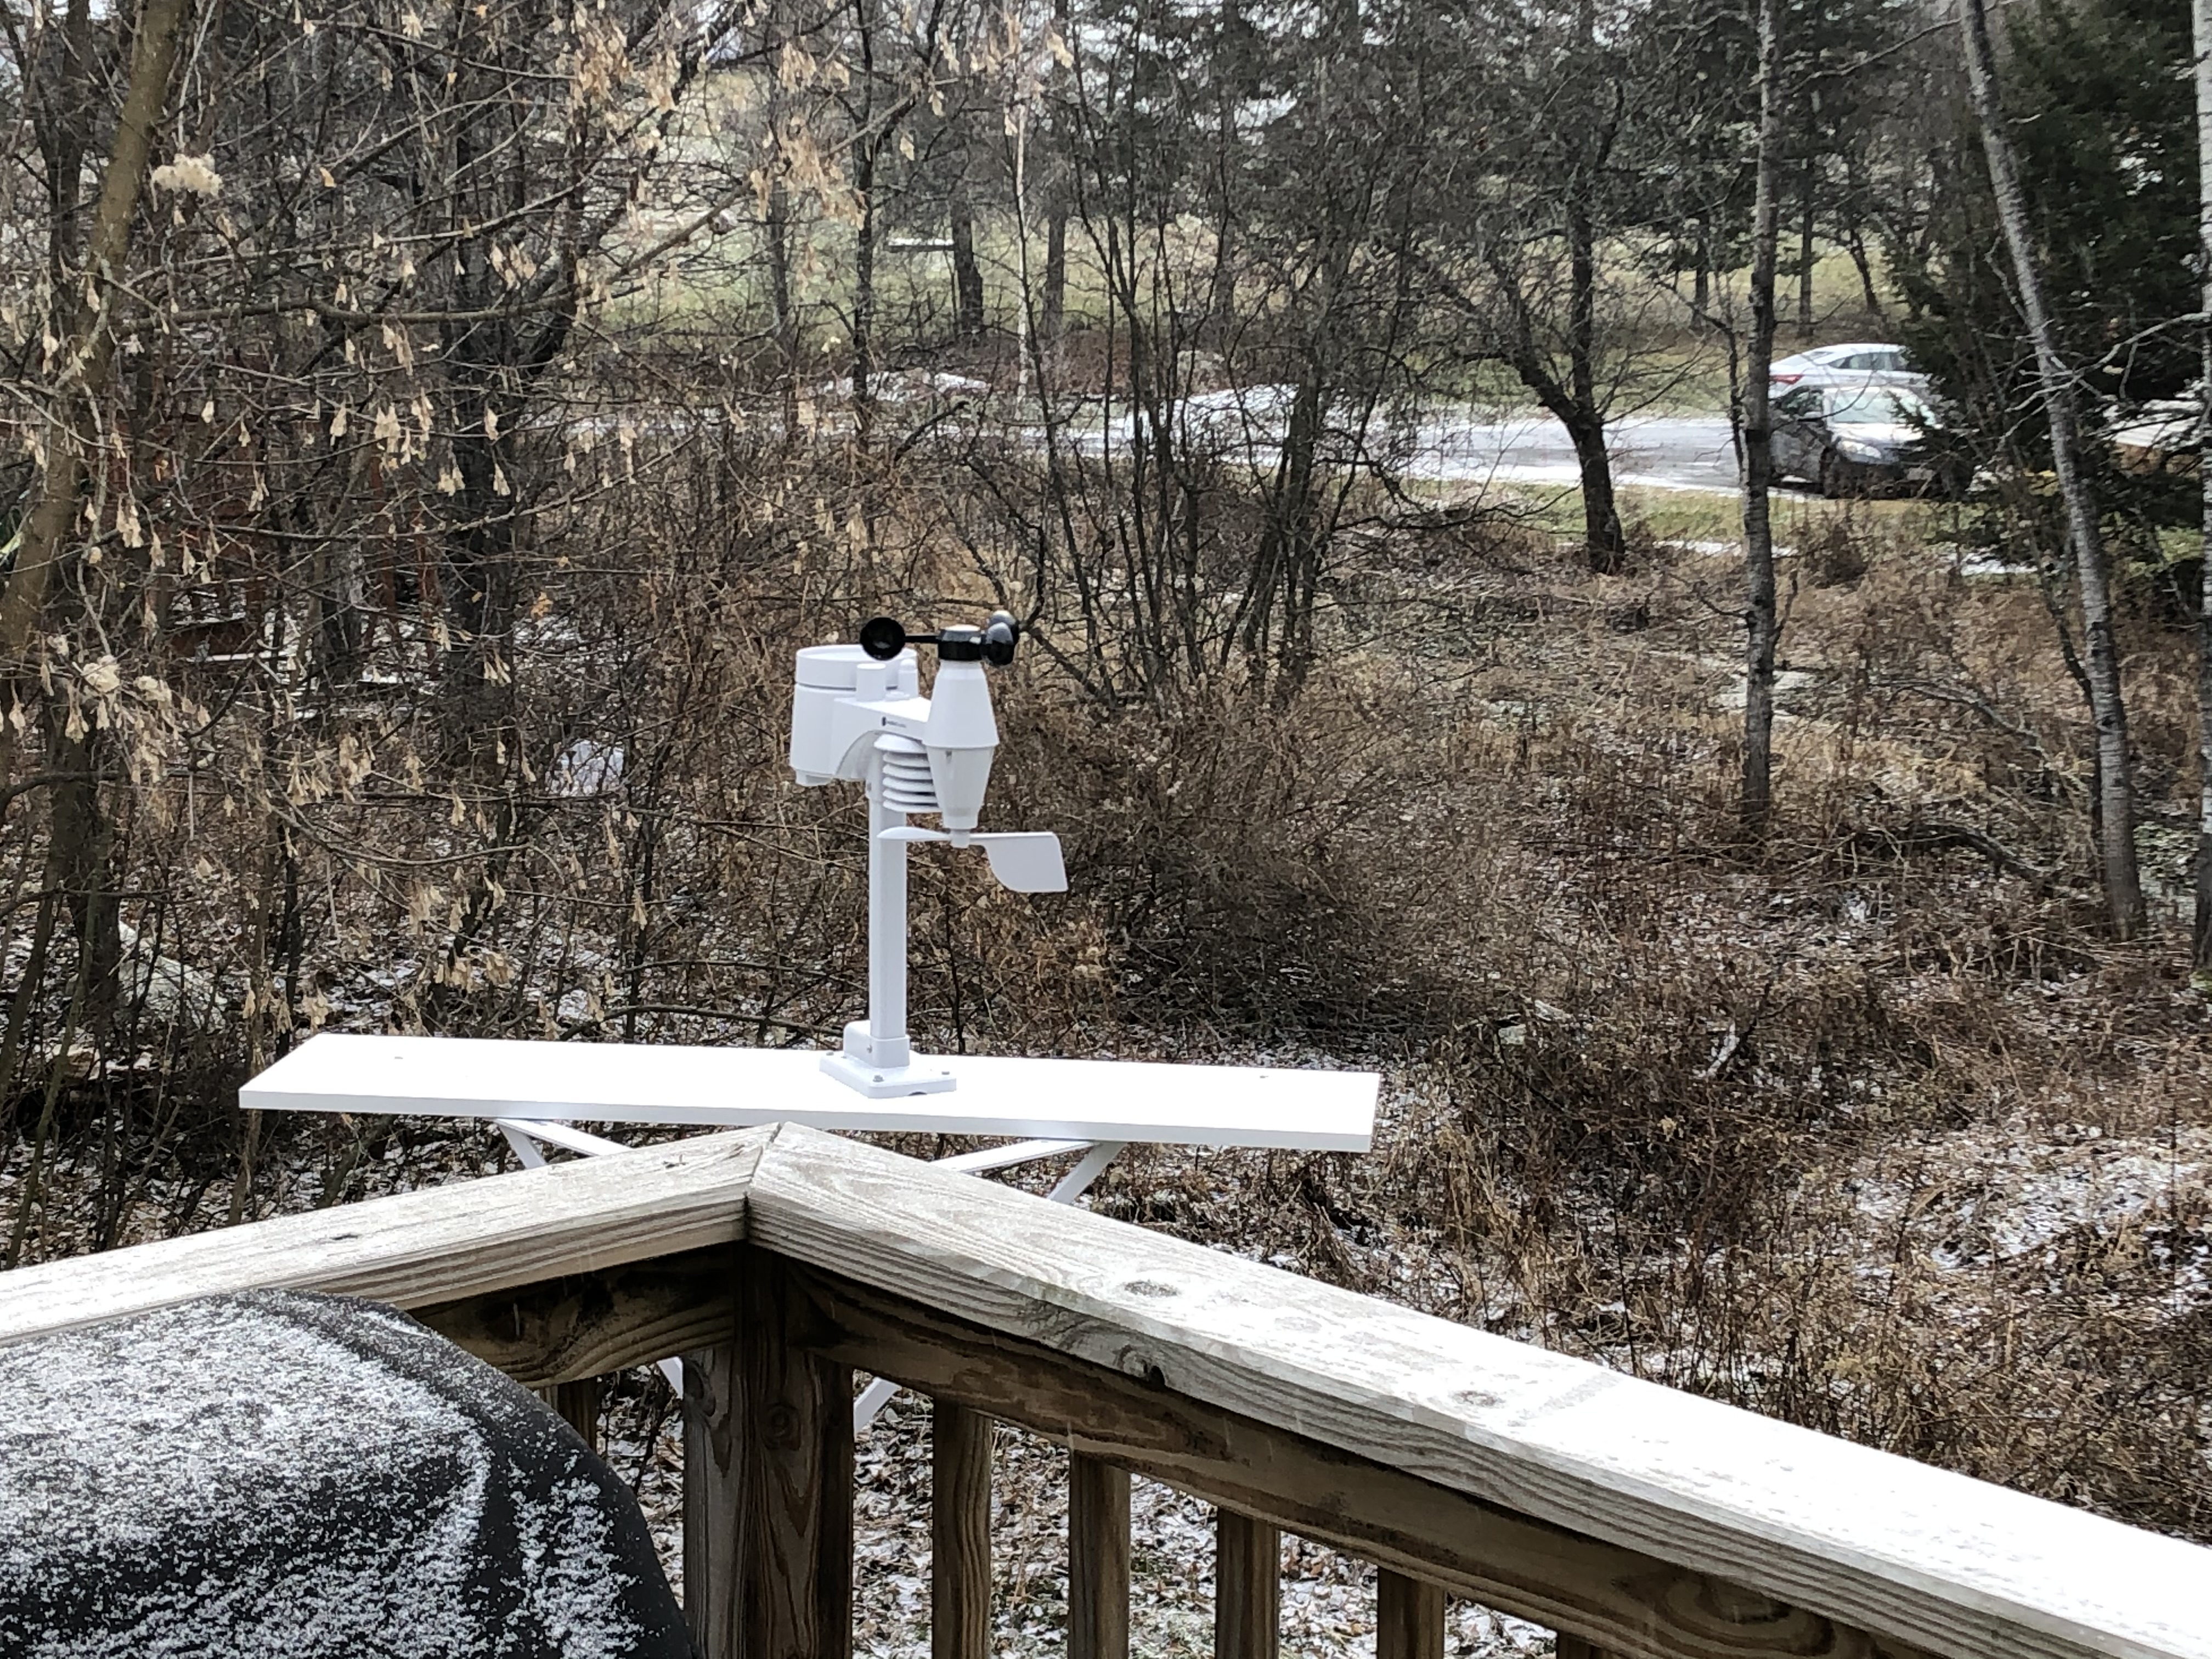
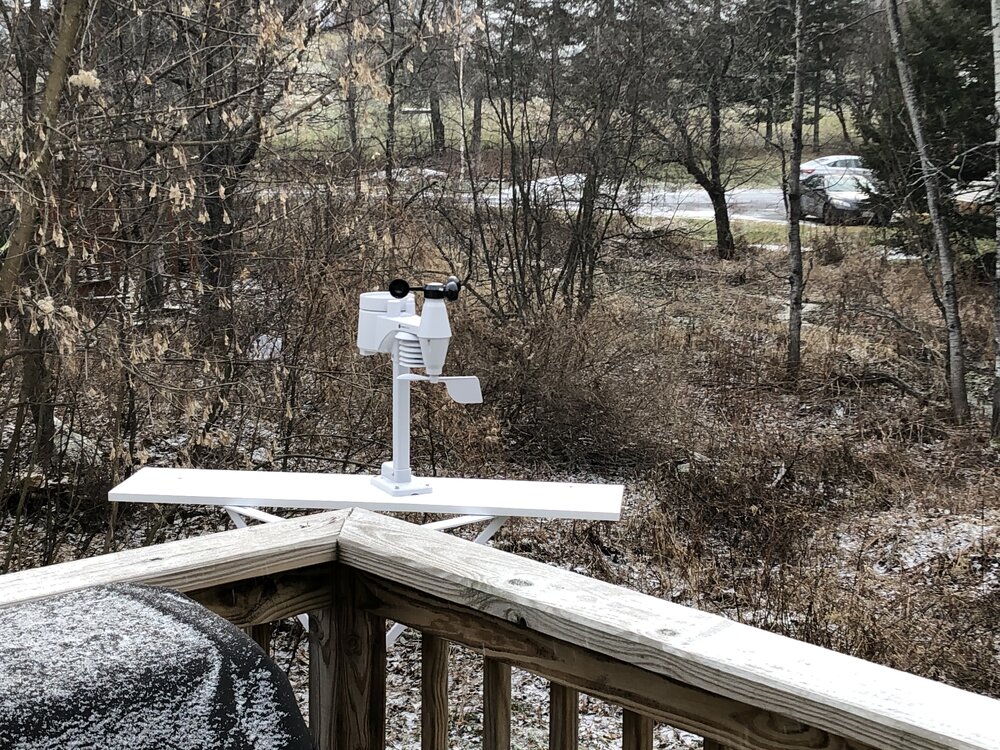
I’ve posted this before but I installed mine on the corner of our deck. The main issue was it being only 8’ from the roof. We are in the middle of enlarging the deck so it will be a couple of feet further out when it gets reinstalled. It’s about 8’-9’ above the ground.
-

Augdewst 2026: Summer's Last Stand
TauntonBlizzard2013 replied to Prismshine Productions's topic in New England
1.97”…. -
Tons of rain here, but no thunder as usual.
-

Augdewst 2026: Summer's Last Stand
Damage In Tolland replied to Prismshine Productions's topic in New England
And you beat any downpour here this summer with your near 3” this morning -

Augdewst 2026: Summer's Last Stand
dendrite replied to Prismshine Productions's topic in New England
I guess, but you beat my July total this morning alone. -
Augdewst 2026: Summer's Last Stand
WxWatcher007 replied to Prismshine Productions's topic in New England
This. I’m still not at an inch on the day. Nobody that truly loves weather wants to miss out on something interesting. Before the moral police strike, I’m not talking about houses being ripped from foundations lol. -
1.65 here so far.
-

2026-2027 Super El Nino
GaWx replied to Stormchaserchuck1's topic in Weather Forecasting and Discussion
I just saw -1.29 rather than -2.03 for NOAA July 2026 PDO here: https://www.ncei.noaa.gov/pub/data/cmb/ersst/v5/v6/index/ersst.v6.pdo.dat That’s almost exactly what the WCS dailies in July average at. -
Central PA Summer 2026 Discussion/Obs Thread
pawatch replied to Voyager's topic in Upstate New York/Pennsylvania
I hear what you’re saying on the near misses. I was having quite a few this season.

-
Augdewst 2026: Summer's Last Stand
Damage In Tolland replied to Prismshine Productions's topic in New England
Instead I’ll take one solid tstorm. That’s it -

Augdewst 2026: Summer's Last Stand
HoarfrostHubb replied to Prismshine Productions's topic in New England
If I could send you the past two rain events I have had, I would. -

E PA/NJ/DE Summer 2026 Obs/Discussion
The Iceman replied to PhiEaglesfan712's topic in Philadelphia Region
Round 3 beginning now, we might get over 5 inches total… -
Augdewst 2026: Summer's Last Stand
Damage In Tolland replied to Prismshine Productions's topic in New England
It’s all relative when everyone around you is getting 3-5” on the regular with tstorms . It’s been wet, just a very boring wet locally -
Another narrow and quick line of storms forming as cleearing is working through from the west - in WNJ
-
Slightly annoying as yesterday the moisture axis was 50 miles too far west and today it looks to be 50 miles too far east. We had a good July but not as spectacular as the Raleigh area and I'd like to keep the momentum going. NAM 3K suggests Tuesday and Wednesday may be better for me.
-
The areal coverage of +2-inch amounts is easily exceeding other events... I think Wiz's call yesterday was spot on...
-
Augdewst 2026: Summer's Last Stand
dendrite replied to Prismshine Productions's topic in New England
-
Taylor Ward to the Mariners, Red Sox talking to O's about Rutschman per ESPN.
-
Augdewst 2026: Summer's Last Stand
Damage In Tolland replied to Prismshine Productions's topic in New England
Same here. Had rains but never crushed. Not once -
1.2” yesterday and ground was squishy for first time in a long time
-

Augdewst 2026: Summer's Last Stand
WinterWolf replied to Prismshine Productions's topic in New England
Ya we’re gonna go 4” here easily. -
Augdewst 2026: Summer's Last Stand
WinterWolf replied to Prismshine Productions's topic in New England
Ya dam Don….I’d gladly give you some..we have enough.