All Activity
- Past hour
-
Those cold SSTs off the California coast and Baja are -PMM
-
Toasty day at Hershey
-
Crazy to think there are people who actually wanted this type of weather.
-
1PM Roundup ACY: 89 EWR: 87 New Brnswck: 87 BLM: 86 TEB: 86 LGA: 85a ISP: 84 NYC: 84 TTN: 84
-
https://x.com/WeatherNation/status/1936423864680275993
-
Yeah, mostly being driven by the record SSTs across the Western Pacific Basin. Still well above average SSTs off the West Coast Mexico and Central America. This boosted the recent record breaking early RI with Erick. Only a small area of cooler -PDO SSTs off the California Coast.
-
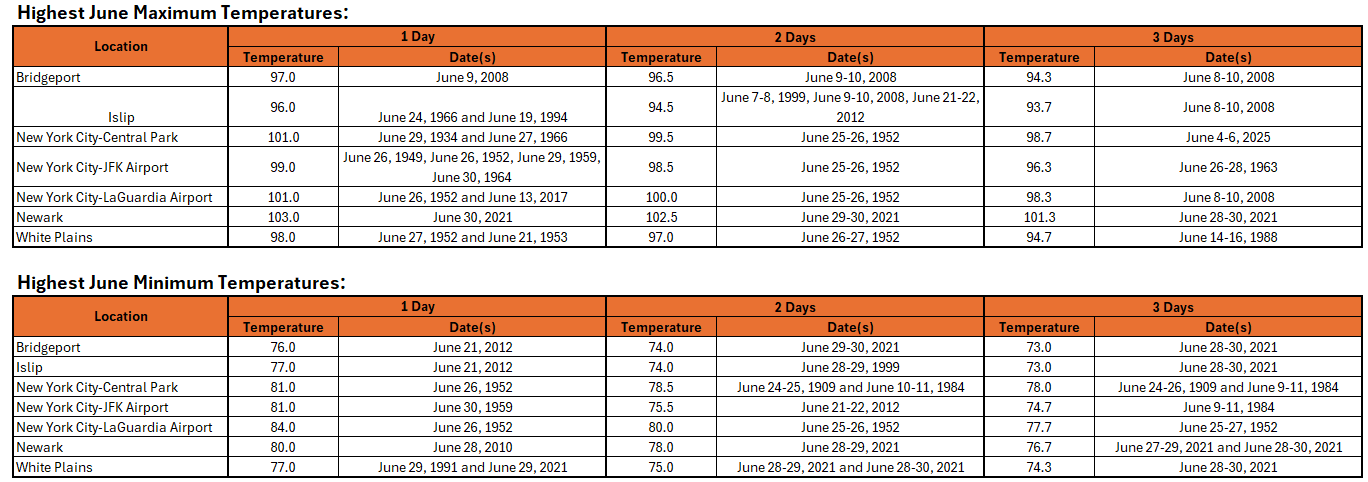
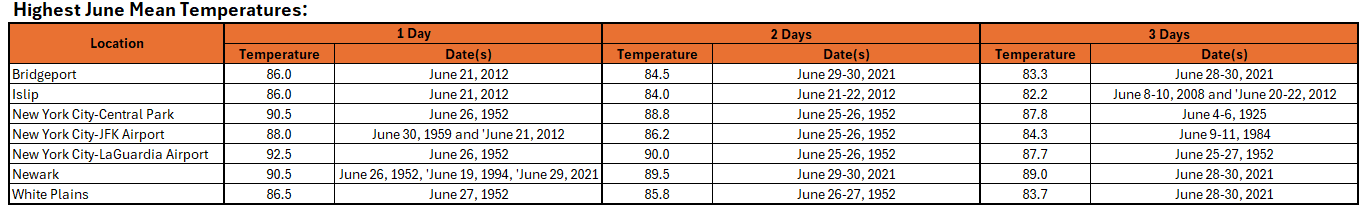
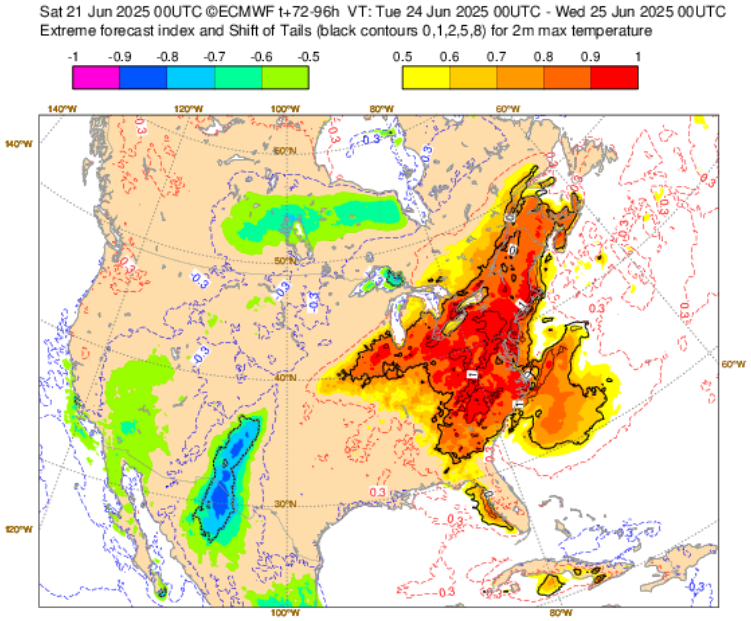
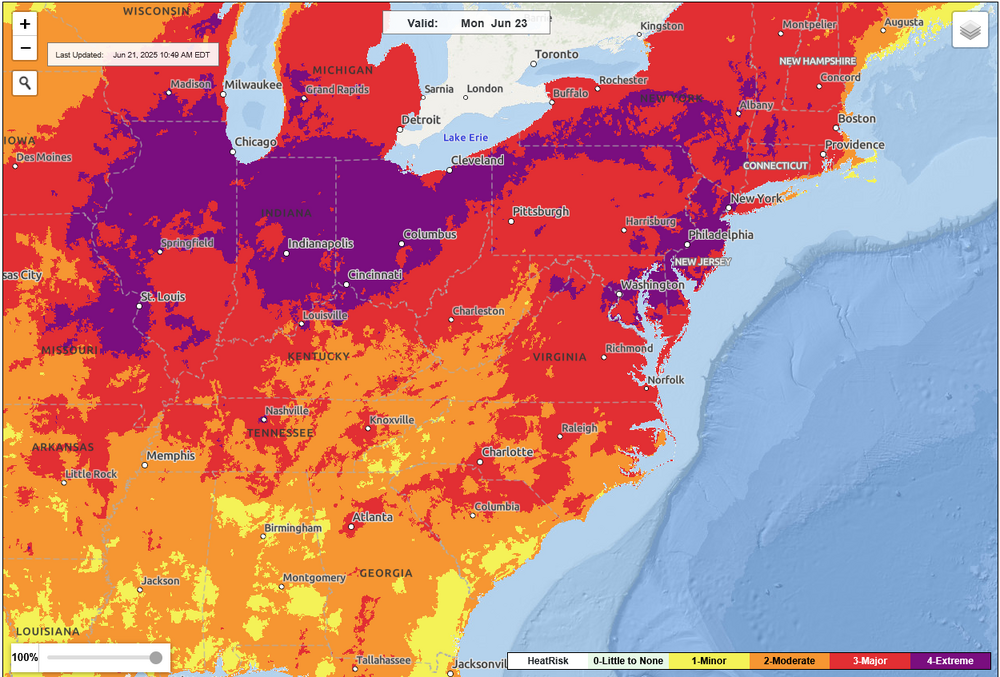
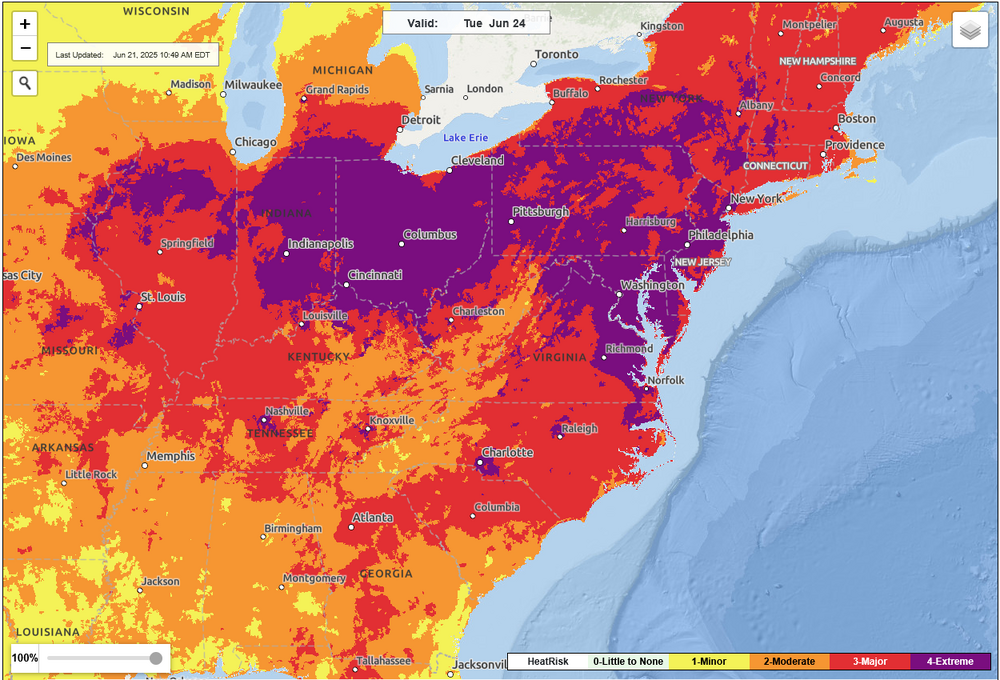
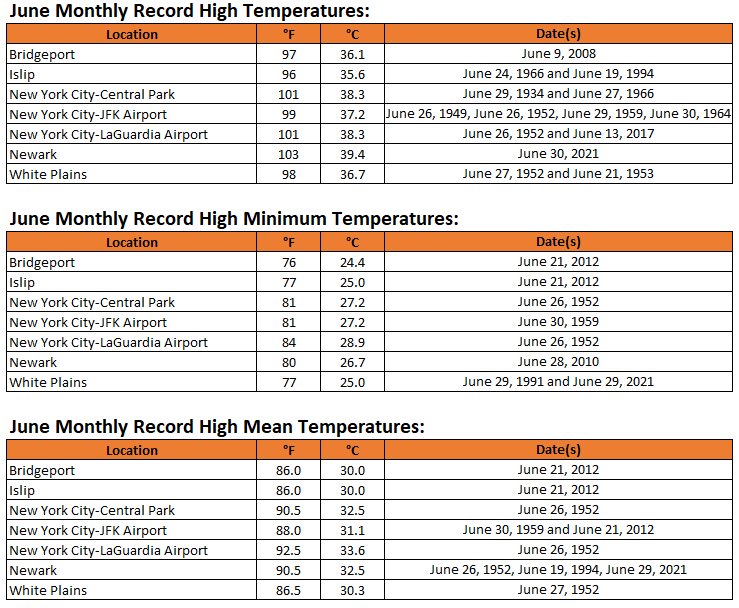
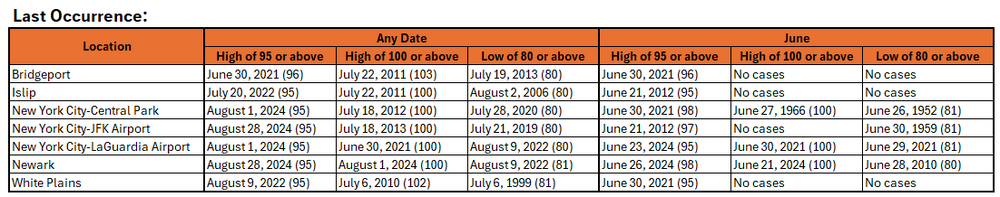
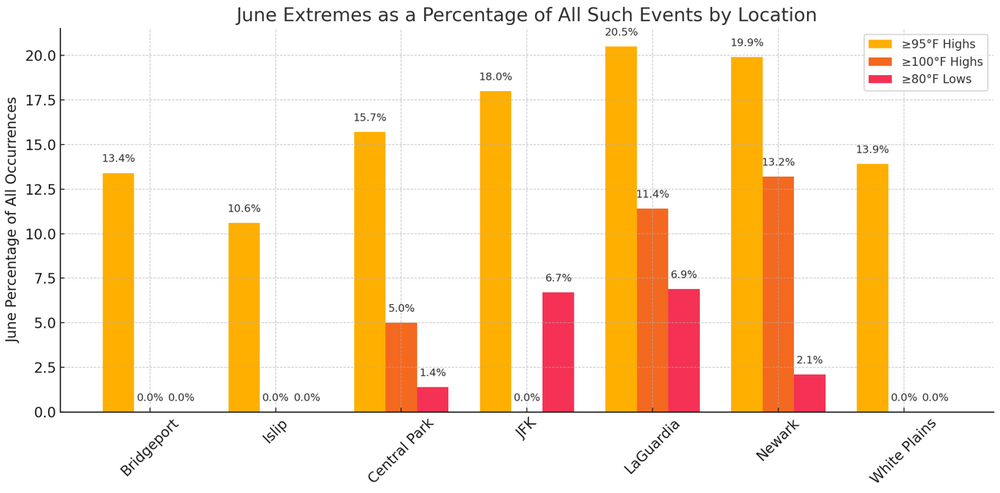
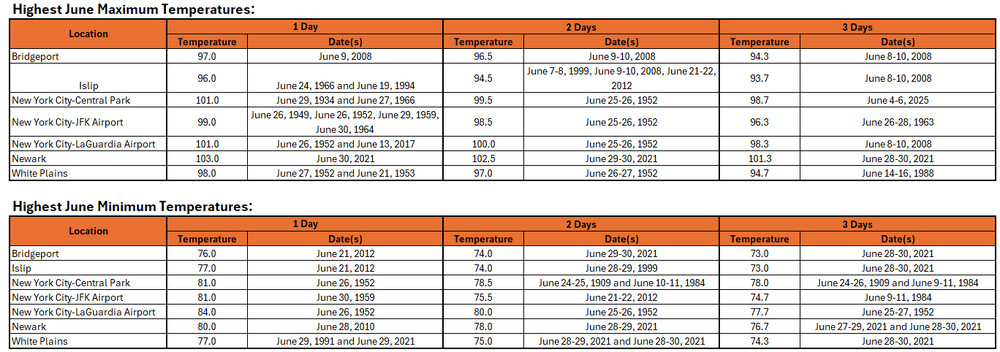
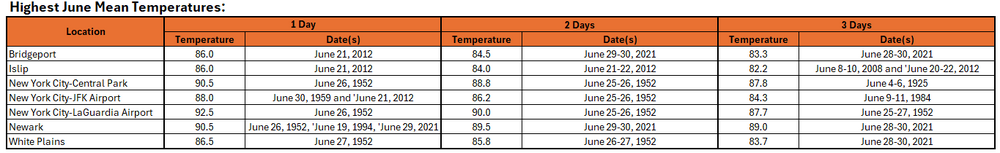
 A number of charts and tables for reference for what appears likely to be a notable and perhaps historic bout of June heat: EFI: June 23, 2025: EFI: June 24, 2025: NWS Heat Risk: June 23, 2025: NWS Heat Risk: June 24, 2025: June Monthly Records: June 1-Day, 2-Day, 3-Day Records: Select Additional Data: June Extremes:
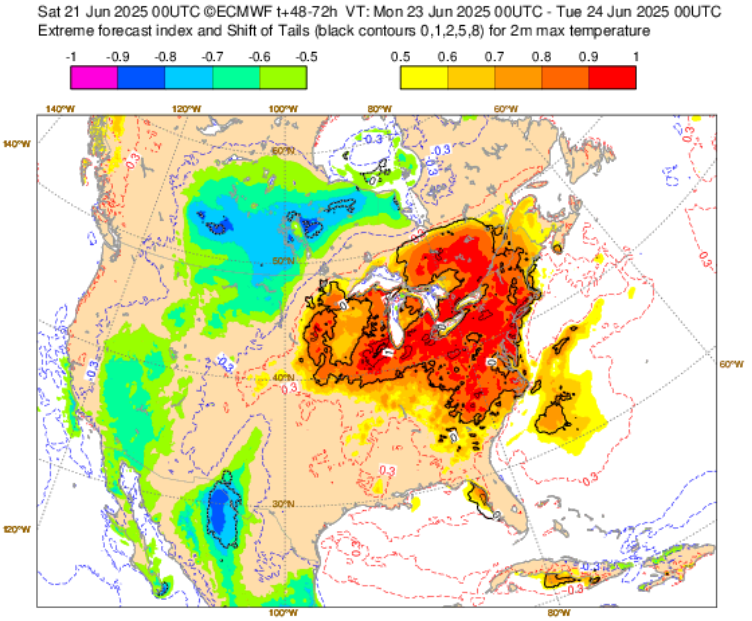
-
Anyways here's a summary of that one night I asked it to write and maybe explain the extreme acoustics I was exposed to. If anyone can point to any errors I would be grateful, as sometimes it can be tricky to pin point if not very knowledgeable In the evening hours of June 19th, 2025, Puerto Vallarta was situated in an exceptionally moist and unstable tropical environment. GOES-19 satellite imagery from Bands 13 (IR), 10 (mid-level water vapor), and Day/Night Cloud Microphysics RGB showed persistent deep convection offshore, with expansive moisture plumes extending across the Sierra Madre Occidental and into the Bay of Banderas. The atmosphere exhibited very high precipitable water values (greater than 2.5 inches), surface dewpoints in the mid to upper 70s F, and Convective Available Potential Energy (CAPE) exceeding 3000 J/kg - an ideal recipe for sustained convection and electrical activity. The area also featured an existing outflow boundary from earlier coastal storms lingering just offshore. Around local sunset (20:00-20:30), satellite and GLM data showed a dramatic intensification in lightning activity and new convective towers developing along a southward-moving cold pool outflow boundary from inland convection. This boundary, colliding with the pre-existing marine boundary along the coast, produced strong mesoscale lift. The differential heating between the land and the ocean (which had reached maximum contrast at nightfall) further enhanced low-level convergence. These combined effects triggered explosive vertical motion and renewed updraft cores, fostering rapid growth of cumulonimbus cells. Between 20:30 and 21:00 local time, observers reported lightning rates increasing from occasional flashes to nearly continuous discharges - as captured in GLM FED data and verified visually and audibly from the shoreline. The newly forced updrafts punched through already moist mid- and upper-levels, producing ice-rich supercooled regions ideal for charge separation. The result was highly electrified convective cells anchored along the outflow boundary intersection zone. Observers in high-rise buildings noted blinding continuous flashes and deafening cloud-to-ground strikes (positive CG dominated), likely linked to inverted charge layers due to elevated mixed-phase regions in tall tropical cumulonimbus. The perception of extraordinary thunder loudness and resonance was enhanced by both the proximity of tall cells within approximately 5-10 kilometers and the urban canyoning effect of reflecting sound between nearby high-rise structures. The saturated air and low-level inversion common in coastal nighttime profiles would further trap and amplify sound waves. In this instance, even heavy rainfall (recorded as torrential but inaudible for several minutes under thunder) was overshadowed by continuous shockwave-like thunderclaps - an auditory signature of multiple near-simultaneous positive CG discharges striking around and within Puerto Vallarta's coastal zone. The June 19th thunderstorm event in Puerto Vallarta exemplifies the dynamic interactions possible in tropical monsoon regimes when mesoscale boundaries, synoptic-scale moisture surges, and diurnal heating align. The explosive, continuous nature of lightning activity was not purely from the main convective complex offshore but from focused lifting at the outflow convergence zone in immediate proximity to the city. Satellite trends suggest this pattern could repeat in subsequent nights during peak monsoon phase. The event serves as an excellent case study of mesoscale convective boundary collision driving extreme nocturnal lightning outbreaks in tropical coastal environments. Sent from my SM-G970U1 using Tapatalk
-
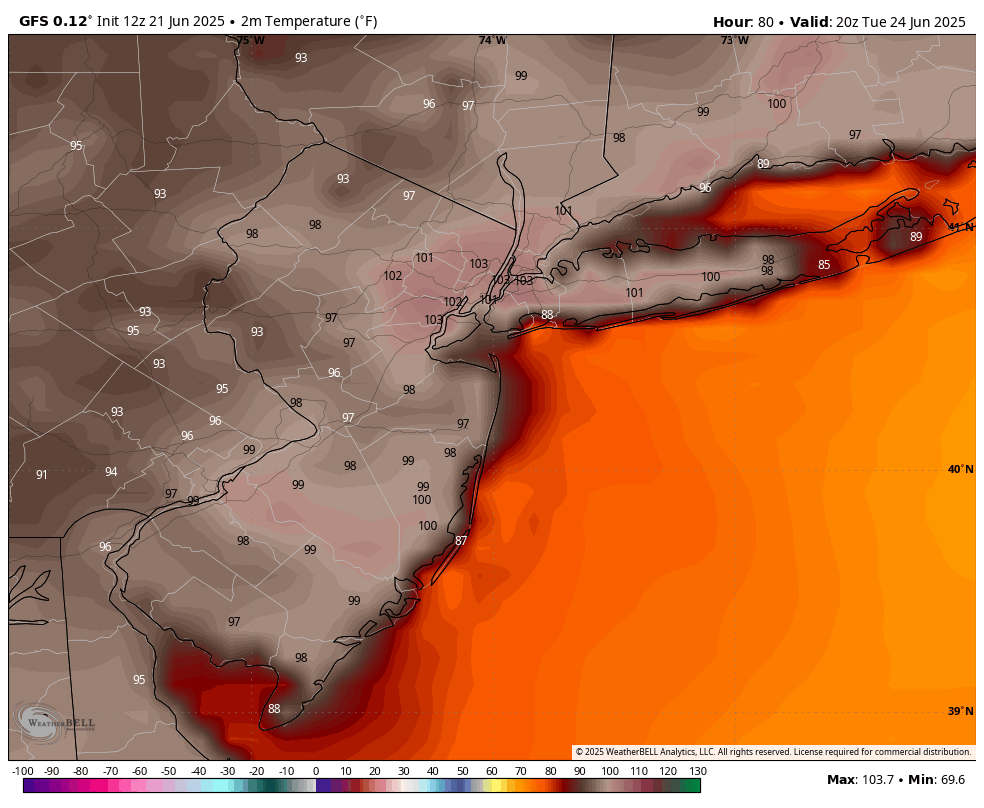
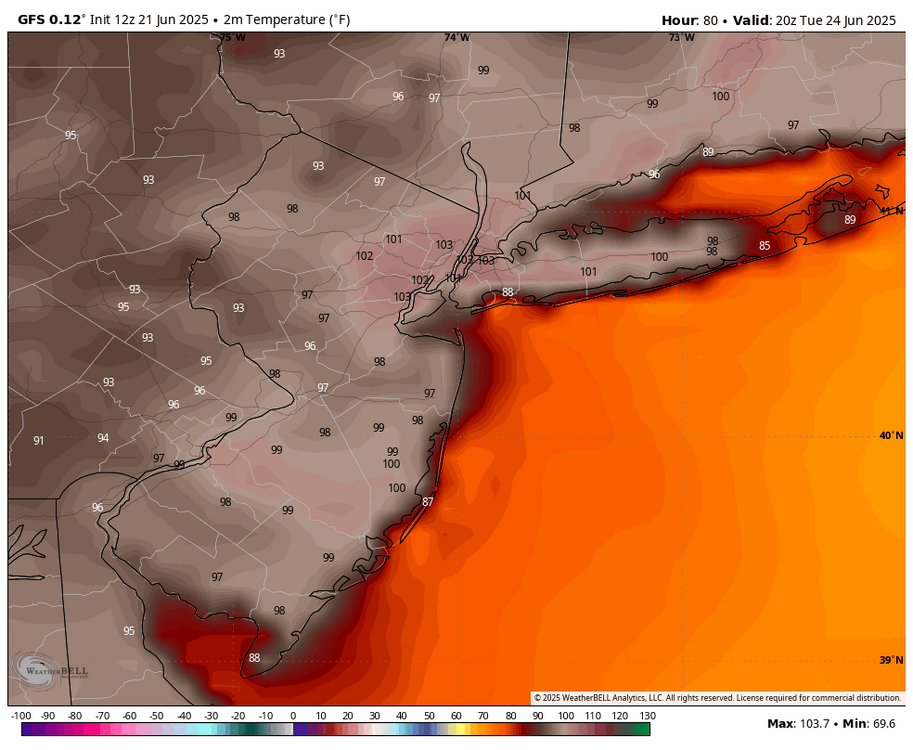
100 to ISP on the 12z GFS on Tuesday. Monday will have a sea breeze. Tuesday is the only real chance at 100
-
Yes the 12Z GFS and CMC are back to more reasonable temperatures as the week progresses. From Wednesday on upper 80s to lower 90s appears to be the rule with much cooler temperatures and showers/storms Wednesday night through Friday but let's remember how erratic the models are whereas the Euro has been consistently hot for most of the week and into next weekend. WX/PT
-
81 at noon
-
Just eyeballing the latest PAC SSTs, the PDO has gone severely negative again
-
I have to say that chat gpt impressed me mightily with how it handled, summarized, taught me, and predicted weather solely off of GOES satellite images. Although I don't fully comprehend all of the 20 different options available I think I have a pretty good understanding of about five. What they show how to read them and even how to forecast off of them somewhat. Amazingly, the 6 hour forecast it came up with based solely on the latest 12 image gif of each of the five was far superior to wunderground, AccuWeather, or the Mexican national weather service specifically for precipitation times, amounts, thunderstorm potential. I never would have thought about using GOES, if not for lack of radar, and I far underestimated all one could learn from them. Sent from my SM-G970U1 using Tapatalk
-
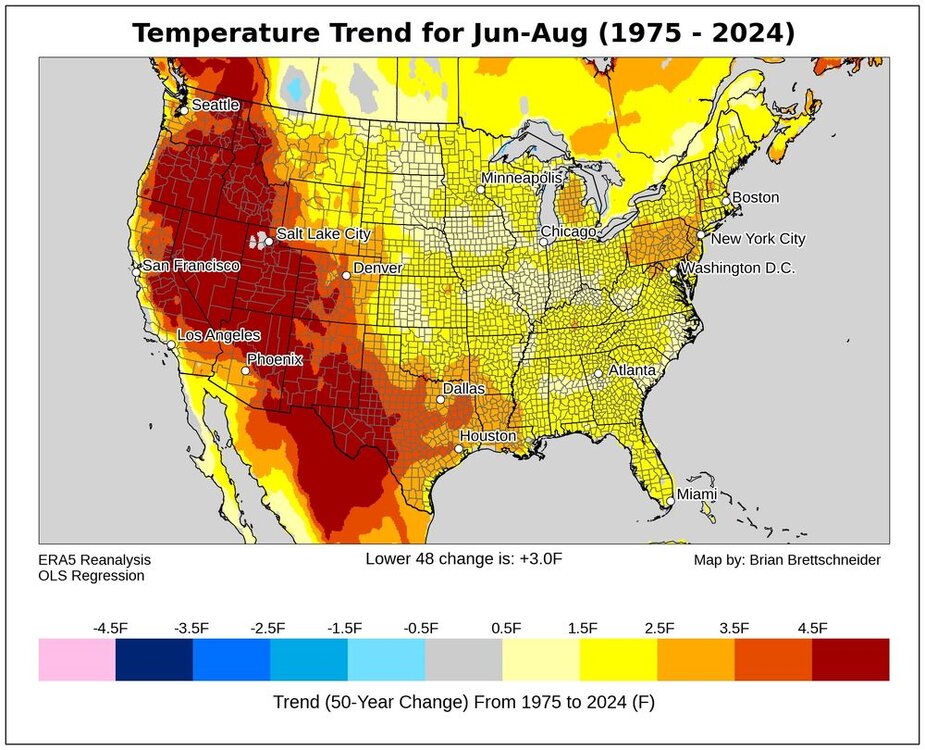
Yeah, areas west of the sea breeze front in interior SE NY, NJ and PA have seen the fastest summer warming in the East.
-
I couldn't stand that mass killing program that Bloomberg had going on during his administration, one of many things I couldn't stand about that billionaire reincarnation of Attila the Hun (his stature was just as small too.)
-
good to see some of our hotter summers on this list too, though the 2020s have exceeded them in Central PA. 9 2012 75.3 0 - 1944 75.3 0 10 2002 75.0 0 2010 76.4 0 - 1966 76.4 0 - 1949 76.4 0 4 1955 76.3 1
-

E PA/NJ/DE Summer 2025 Obs/Discussion
RedSky replied to Hurricane Agnes's topic in Philadelphia Region
They added tomorrow to the death torch. Love it. -
Yes, in the winter it's much more apparent, though summertime minima and increased rainfall and humidity are also strong indicators.
-
I knew it!!!! Sent from my SM-G970U1 using Tapatalk
-
wild, are those locations also getting an elevated number of 90 degree (hot) days? Typically in the Poconos we can count on heat during the day but it would always cool off at night so we didn't need air conditioning, we just opened our windows and the outside air would cool down my house at night. 2024 was different as it was hot during the day and at night.
-
No the bigger indication is how few 0-10 degree days we see. WX/PT
-
-
The really big extreme for warmth during the 2020s in PA has been Bradford and Reading. All the 2020s summers have landed in the top 10 warmest. With 2024 setting the record for warmest in both locations. So those locations are way too far inland to be influenced by the increased onshore flow here in recent summers. Time Series Summary for BRADFORD REGIONAL AIRPORT, PA Click column heading to sort ascending, click again to sort descending. 1 2024 68.2 0 2 2021 67.3 0 3 2022 67.0 0 - 2020 67.0 0 4 2016 66.5 0 5 2018 66.3 0 6 2012 66.1 1 7 2023 66.0 0 - 2005 66.0 0 - 1991 66.0 0 - 1975 66.0 0 8 1959 65.9 0 9 2011 65.8 0 - 1993 65.8 0 - 1987 65.8 0 10 2019 65.3 0 Time Series Summary for Reading Area, PA (ThreadEx) Click column heading to sort ascending, click again to sort descending. 1 2024 76.7 0 2 2020 76.6 0 3 2022 76.4 0 - 2010 76.4 0 - 1966 76.4 0 - 1949 76.4 0 4 1955 76.3 1 - 1943 76.3 0 5 2021 76.1 0 6 2016 76.0 0 7 2011 75.9 0 - 2005 75.9 0 - 1952 75.9 0 8 1959 75.6 0 - 1900 75.6 0 9 2012 75.3 0 - 1944 75.3 0 10 2002 75.0 0
-
-
 Little MCS moving into WPA/ SW WNY