All Activity
- Past hour
-
oh okay i see gotcha kdxken thanks
-
No need to be sorry. He's hard to decipher.
-

SE Area of Interest--10% two day, 20% five day odds
WxWatcher007 replied to WxWatcher007's topic in Tropical Headquarters
This might be one of the very worst forecasts I’ve ever attempted -
sorry for any of the confusion i got mixed up with what was said in here i saw damaged in tolland said daniel san and so i looked it up and saw it was in reference to the guy who was in the movie the karate kid so i said that because i thought he was talking about my profile picture
-
MJO phase (whether inside or outside the circle) 1975-2024 Jul-Sep on day of 67 CONUS hurricane hits 1: 7 (10%) 2: 17 (25%) 3: 7 (10%) 4: 7 (10%) 5: 10 (15%) 6: 6 (9%) 7: 2 (3%) 8: 11 (16%) ——————— MJO phase (whether inside or outside the circle) 1975-2024 Jul-Sep on day of 23 CONUS MAJOR hurricane hits 1: 3 (13%) 2: 9 (39%) 3: 2 (9%) 4: 2 (9%) 5: 2 (9%) 6: 2 (9%) 7: 0 (0%) 8: 3 (13%) Analysis: Whether considering all US H hits or just MH hits, phase 2 has easily had the most hits of any one phase. You may wonder (and I wondered at first, myself) if that’s because there were far more days in phase 2 than any other phase during Jul-Sep 1975-2924. Answer: 16.8% or 1 in 6. So, it had somewhat more than an avg share, which is 12.5%. But that’s not nearly enough to fully explain the high phase 2 #s. Conclusion: So, phase 2 really has had by a good margin the highest frequency of H and especially MH CONUS hits per days in that phase during Jul-Sep since 1975. Sources: I looked at the following sources and did the calculations: 1. MJO phase: http://www.bom.gov.au/clim_data/IDCKGEM000/rmm.74toRealtime.txt 2. H classification/hit dates: NHC archives 3. For Katrina and Ian, I counted only the day of the more intense hit to determine MJO phase. For Andrew, both hits were during phase 6.
-
No. Anywhere from Atlantic Canada to the Mexican Gulf coast should be on alert for this potential storm that hasn't even splashed down from Africa yet. No one location should be on any higher alert than another.
-
I’m on my second Vantage Vue. I didn’t realize they had come out with a new touchscreen model.
-
huh im not sure what you mean
-

SE Area of Interest--10% two day, 20% five day odds
BarryStantonGBP replied to WxWatcher007's topic in Tropical Headquarters
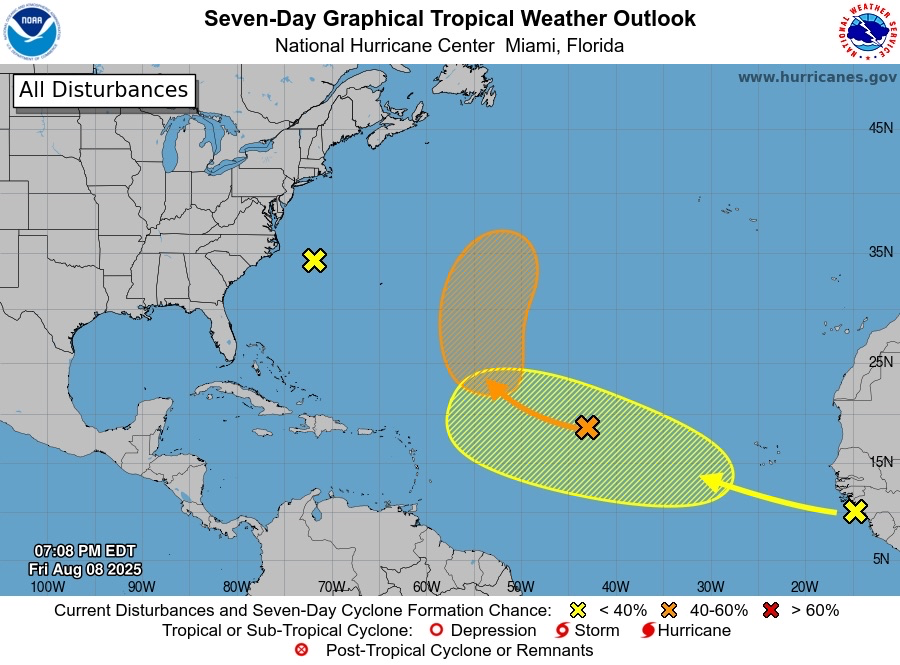
L 1. Western Atlantic: A large area of disorganized shower activity off the coast of North Carolina and the Mid-Atlantic States are associated with a non-tropical low pressure system. This system is expected to merge with a front and move over cool waters this weekend, and tropical or subtropical development is not expected. * Formation chance through 48 hours...low...near 0 percent. * Formation chance through 7 days...low...near 0 percent. -
WTAF?
-
GTFIHHHHHHHHHHH 3. Eastern Tropical Atlantic: A tropical wave located near the west coast of Africa is producing a large area of disorganized showers and thunderstorms. Some slow development of this system is possible next week while the system moves west-northwestward at 15 to 20 mph across the eastern and central tropical Atlantic. * Formation chance through 48 hours...low...near 0 percent. * Formation chance through 7 days...low...20 percent.
-
Yeah I'm definitely worried for some potentially significant flooding somewhere in S or SW WI. While it hasn't been as wet as most of IA over the last 30 days, it's still been wet enough to cause concerns even without some of the more extreme totals that models have put out. SW to NE is a bad direction for precip maxes in regards to the drainage network in this part of the state. And 6-10 inches of rain in a night would be very bad news for really any drainage around here.
-
the profile picture is of the anime series naruto shippuden with the character kakashi hatake a friend of mine got me into the anime series but had trouble keeping up with both of the subtitles and scenes but i have seen that movie karate kid movie series and its a great movie
-
Couple of nice looking storm cells out there tonight. One near Rose City, Michigan, south of Huron National Forest, and one northwest of London, Ontario.
-

Texas 2025 Discussion/Observations
DFWWeather replied to Stx_Thunder's topic in Central/Western States
I'd be curious to hear everyone's input on this, especially those that know what is going on with the weather models. For the last 5 to 8 years, I have been noticing a pronounced trend in the models high temp forecasts to be excessively too hot. This is particularly evident in the summer time high temps for DFW. The operational GFS is the worst, in fact so bad, I have to throw its numbers out beyond day 3 when forecasting. To be clear, I'm talking about the raw numbers of the model itself not the MOS numbers. The raw GFS numbers can be as much as 8 to 20 degrees hotter than what actually verifies. It consistently forecasts high temp values above 110°F, sometimes as high as 120°F plus. First off, the hottest temp ever recorded here is 113°F, and we have only been 110°F or warmer 14 times out of 125 years of records. So that is absurd! If I had to pick a model to forecast summertime temps for the DFW area, it seems the Canadian ensemble average is the closest to what actually verifies. The ECMWF was a close second until this summer. It has now skewed warmer. This summer all of the models tend to want to forecast temps into the 100s when there is no valid reason for that if one looks at the pattern and conditions. Our normal temp in the height of summer is 97°F. Current forecasts I have seen for DFW over the past several days have been 2 to 5 degrees too hot than what verifies. The NBM numbers are also being skewed too warm because of this. So what is happening? -
UHI isn't as big of a factor as you'd think it is. For example... RFD has is sitting at 18 days and ARR is sitting at 21 says. 3/4th of RFD is surrounding by open land and corn fields. ARR is in an entirely rural area, fully surrounded by corn fields. MSN is actually situated in a better location for UHI effects that either of them, but, does have the smaller lakes to the SW/S too contend with.
-

Occasional Thoughts on Climate Change
donsutherland1 replied to donsutherland1's topic in Climate Change
Apparently, it seems that there is a concerted effort underway to discredit Phoenix's monthly temperature record from yesterday. Apparently, the individual is unaware that Phoenix's ASOS was commissioned, which means it meets federal siting requirements. Therefore, there's no need to throw out its readings. Second, and more importantly, the heat was real as nearby data from East Mesa, Tempe ASU, Scottsdale, etc., show. That additional data reveals that Phoenix was not an isolated hot spot. The individual's statement is unserious and ill-informed.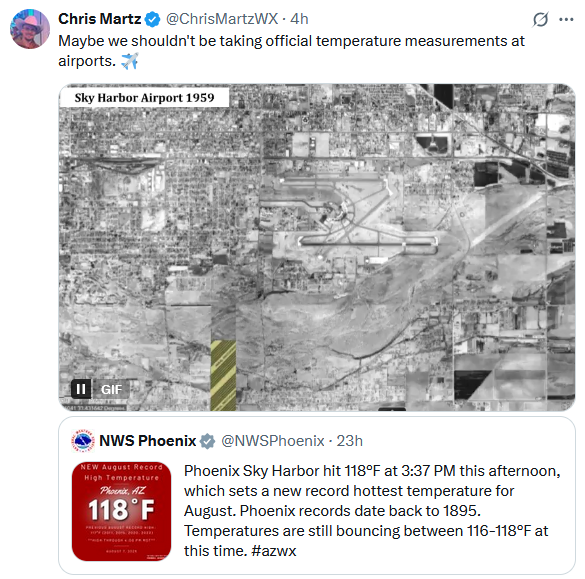
- Today
-
2025 Atlantic Hurricane Season
BarryStantonGBP replied to BarryStantonGBP's topic in Tropical Headquarters
-
Daniel San?
-
well apparently sharpie markers were not invented until 1964
-
I made a post in the other thread. Over the last 3 years, Detroit has seen a total of 26 days of 90+ while Chicago has seen 67. This year, Detroit has seen 10 to Chicago's 23.
-
You ordering a new Davis?
-

2025 Spring/Summer Mountain Thread
Met1985 replied to Maggie Valley Steve's topic in Southeastern States
Another fantastic day with sun and a high of 75 degrees.