All Activity
- Past hour
-
Socked in low clouds/fog this AM. Lake side is the best side.
-
this plus all the winds and ragweed have caused my allergies to return, undoubtedly this is the worst weather of the entire year =\
-
this plus the allergies from the high winds and ragweed is what has my throat burning (even without it on).
-
5 year intervals was the point. I know there have been other storms in between
-
PD2 was better than ANY of those storms besides January 1996 and January 2016.
-
Nor should anyone ... ... But, if this winter behaves incongruently more so than "average weirdness" ( haha ), which again... was suggested by climate model/predictions all along ( so is not unprecedented in that sense, the rise in 'unpredictability') ... it's fair to consider the classical methods are becoming less reliable. There's a risk in reading these cautions in absolute dictation. Becoming is not become. Like I said, none of this forestalls the advent of bomb winter. These teleconnectors are not 1::1 ... never have been. They can't be. There are too many contributing forces, creating a huge polynomial, each one more and then less- so scaling the equations for influence does not result a consistent contribution from their individual parts from year to year. Within that noise, there is tendency, however, during these the last 10 years ( rather consistently...) to be "more noisy" lol for lack of better phrase. I'm aware of situational bias. But I'm considering that there are reasons that support the ongoing disruption/observations therein.
-
 Caution Liberty, nycwinter may be on to something. As always …..
-
You forgot PD2, we had 26 inches of snow in that one. February 2006 was very minor compared to that (half the snow and 02-03 was one of our greatest winters ever and only wall to wall besides 95-96).
-
1.89" will do it for me. 3.58" for the month
-
What are the top 3 highest since 2007?
-
 so wild, I think some places reached 100 degrees in 1983 in July, August AND September??? Can you check to see which ones did that-- I'm sure some place in Queens did as JFK hit 100 in both July and August in 1983 and 98 in September (NYC hit 99).
 -
Gee ...any marine taint today ? https://weather.cod.edu/satrad/?parms=local-Rhode_Island-02-24-1-100-1&checked=map&colorbar=undefined
-
 The peak heat in 2010 was focused in July like we typically see. The most unusual heat in 1983 was the record heatwave coming so late on September 10th-11th. Could be related to the drought which developed that summer. That may be the last time that Queens reached 100° so late in the season. Monthly Data for July 2010 for Upton NY NWS CWA Click column heading to sort ascending, click again to sort descending. NY MINEOLA COOP 108 NY WANTAGH CEDAR CREEK COOP 107 NJ CANOE BROOK COOP 107 NJ RINGWOOD COOP 106 NJ HARRISON COOP 106 CT DANBURY COOP 104 NJ CRANFORD COOP 104 NY WEST POINT COOP 103 NJ TETERBORO AIRPORT COOP 103 NY SHIRLEY BROOKHAVEN AIRPORT WBAN 103 NJ NEWARK LIBERTY INTL AP WBAN 103 NY LAGUARDIA AIRPORT WBAN 103 NY NY CITY CENTRAL PARK WBAN 103 NJ TETERBORO AIRPORT WBAN 103 Data for September 10, 1983 through September 11, 1983 Click column heading to sort ascending, click again to sort descending. NJ PLAINFIELD COOP 100 NY NEW YORK LAUREL HILL COOP 100 NJ CRANFORD COOP 99 NJ NEWARK LIBERTY INTL AP WBAN 99 NY NY WESTERLEIGH STAT IS COOP 99 NY NY CITY CENTRAL PARK WBAN 99 NY WESTBURY COOP 99 NJ JERSEY CITY COOP 98 NJ CANOE BROOK COOP 98 NY NEW YORK AVE V BROOKLYN COOP 98 NJ ESSEX FELLS SERVICE BLDG COOP 98 NY DOBBS FERRY-ARDSLEY COOP 98 NY WEST POINT COOP 98 NY GARNERVILLE COOP 98 NY JFK INTERNATIONAL AIRPORT WBAN 98 NY VANDERBILT MUSEUM COOP 98 NY WESTCHESTER CO AP WBAN 98 CT NEW HAVEN COOP 98 Data for September 10, 1983 through September 11, 1983 Click column heading to sort ascending, click again to sort descending. PA PHILADELPHIA WBAN 102 NJ EWING 3 WNW COOP 101 MD CENTREVILLE COOP 100 MD CHESTERTOWN COOP 100 DE BRIDGEVILLE 1 NW COOP 100 DE NEWARK AG FARM COOP 100 DE MIDDLETOWN 3 E COOP 100 PA MARCUS HOOK COOP 100 NJ SHILOH COOP 100 DE WILMINGTON AIRPORT WBAN 100 PA DEVAULT 1 W COOP 100 PA READING 4 NNW COOP 100 NJ AUDUBON COOP 100 NJ LAMBERTVILLE COOP 100
 -
Thanks, Don, I strongly suspect these have become more rare with time just like full length winters like 1995-96 and 2002-03 have become much more rare. 1953 and 1983 really jump out from this list as having the highest frequency of such months.
-
beautiful deep blue skies today, nice change of pace after a summer of hazy/milky garbage free nelson
-
1983 does much better if you include September, that was a scorcher of a month!! My favorite summers would have been: 2011, 2010, 2002, 1999, 1983, 1980, 1966, 1955, 1953, 1949, 1948, 1944 Those would be my top 12.
-
 Here they are: Bridgeport: 1953 Islip: None New York City-Central Park: 1921, 1931, 1953, 1983, 1993 New York City-JFK Airport: 1983 New York City-LaGuardia Airport: 1953, 1983, 2010, 2018 Newark: 1914, 1931, 1944, 1953, 1973, 1983, 1989, 1991, 1993, 2010, 2018 White Plains: 1953
 -
That weather was much better than this weather, Chris, I already turned on my heat for the last two days and my allergies have returned.
-
I have a strong feeling you like your hoodies because you wouldn't look good in anything else lol.
-
It just occurred to me that going back to 96 we've managed big storms at 5 year intervals, with of course other big storms between. Can we keep it going? 95-96 January 96 00-01 December 2000 05-06 Feb 2006 10-11 Boxing day and Jan 2011 15-16 Jan 16 blizzard 20-21 Feb 21 snowstorm 25-26 ???
-
No way, this is the worst weather of the entire year, it's okay to get rain for 6 hours or so, but this is a crap 2 day pattern that has brought my allergies back. I have had the heat on for 2 days too, this wind makes it even worse.
-
 it feels like a late october day this morning chilly breezy perfect hoodie weather.
 -
 We had a nice 2 week stretch with sun. It looks like a nice 3 days Fri - Sun coming up and may see some breaks in the clouds today
 -
the worst weather of the entire year =\
-
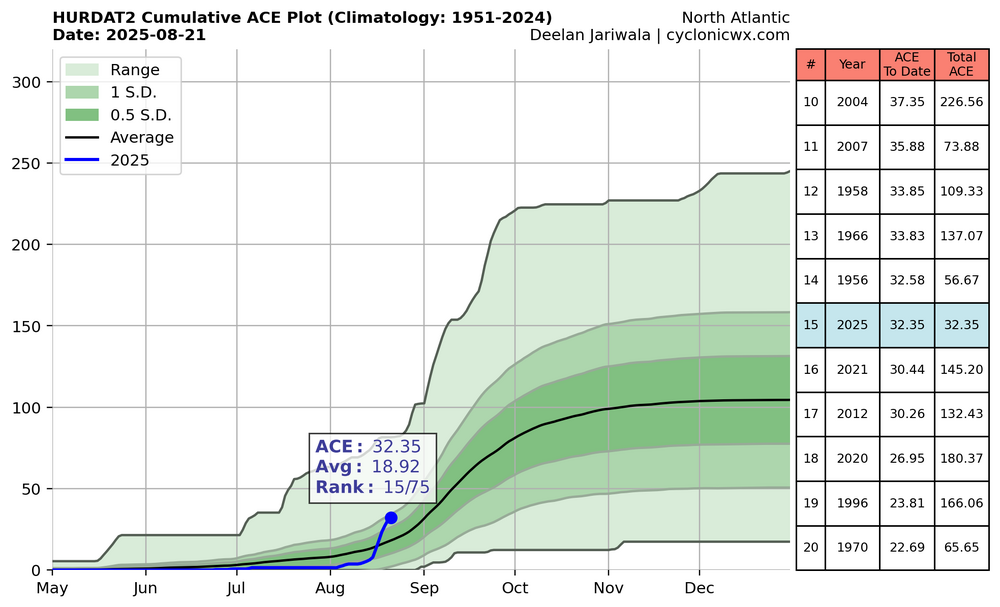
1. Erin will end up with ~33-4 ACE, which you didn’t forecast. Currently, 2024 has sharply risen to 15th of the last 75 years and it will rise several positions from there before Erin winds down, when total ACE should be ~36-38: 2. It does appear quiet ~8/24-9/7 on the ensembles/Euro Weeklies and there could easily be below normal ACE through that period. But even if so and allowing for ~5 added ACE by 9/7, ACE would still be near normal (in the 40s). 3. The Euro Weeklies have then been showing an increase in activity (likely MJO related), especially during 9/15-21: 9/8-14: 10-11 ACE 9/15-21: 13-15 ACE If these verify well, ACE would then be in the 60s. 4. The tendency in recent years, especially during cold ENSO has been for a more active late Sept through Nov. 2024 had its most active period late Sept-mid Oct. If that occurs again, 2025 would end up as another active season.