All Activity
- Past hour
-

Augdewst 2026: Summer's Last Stand
dendrite replied to Prismshine Productions's topic in New England
Holy shiat -
1.4 in an hour. This is getting ridiculous.
-

Augdewst 2026: Summer's Last Stand
vortex95 replied to Prismshine Productions's topic in New England
You do realize this is a tropical air mass. If you are looking for big tstms/svr, you should know better! -

Augdewst 2026: Summer's Last Stand
Prismshine Productions replied to Prismshine Productions's topic in New England
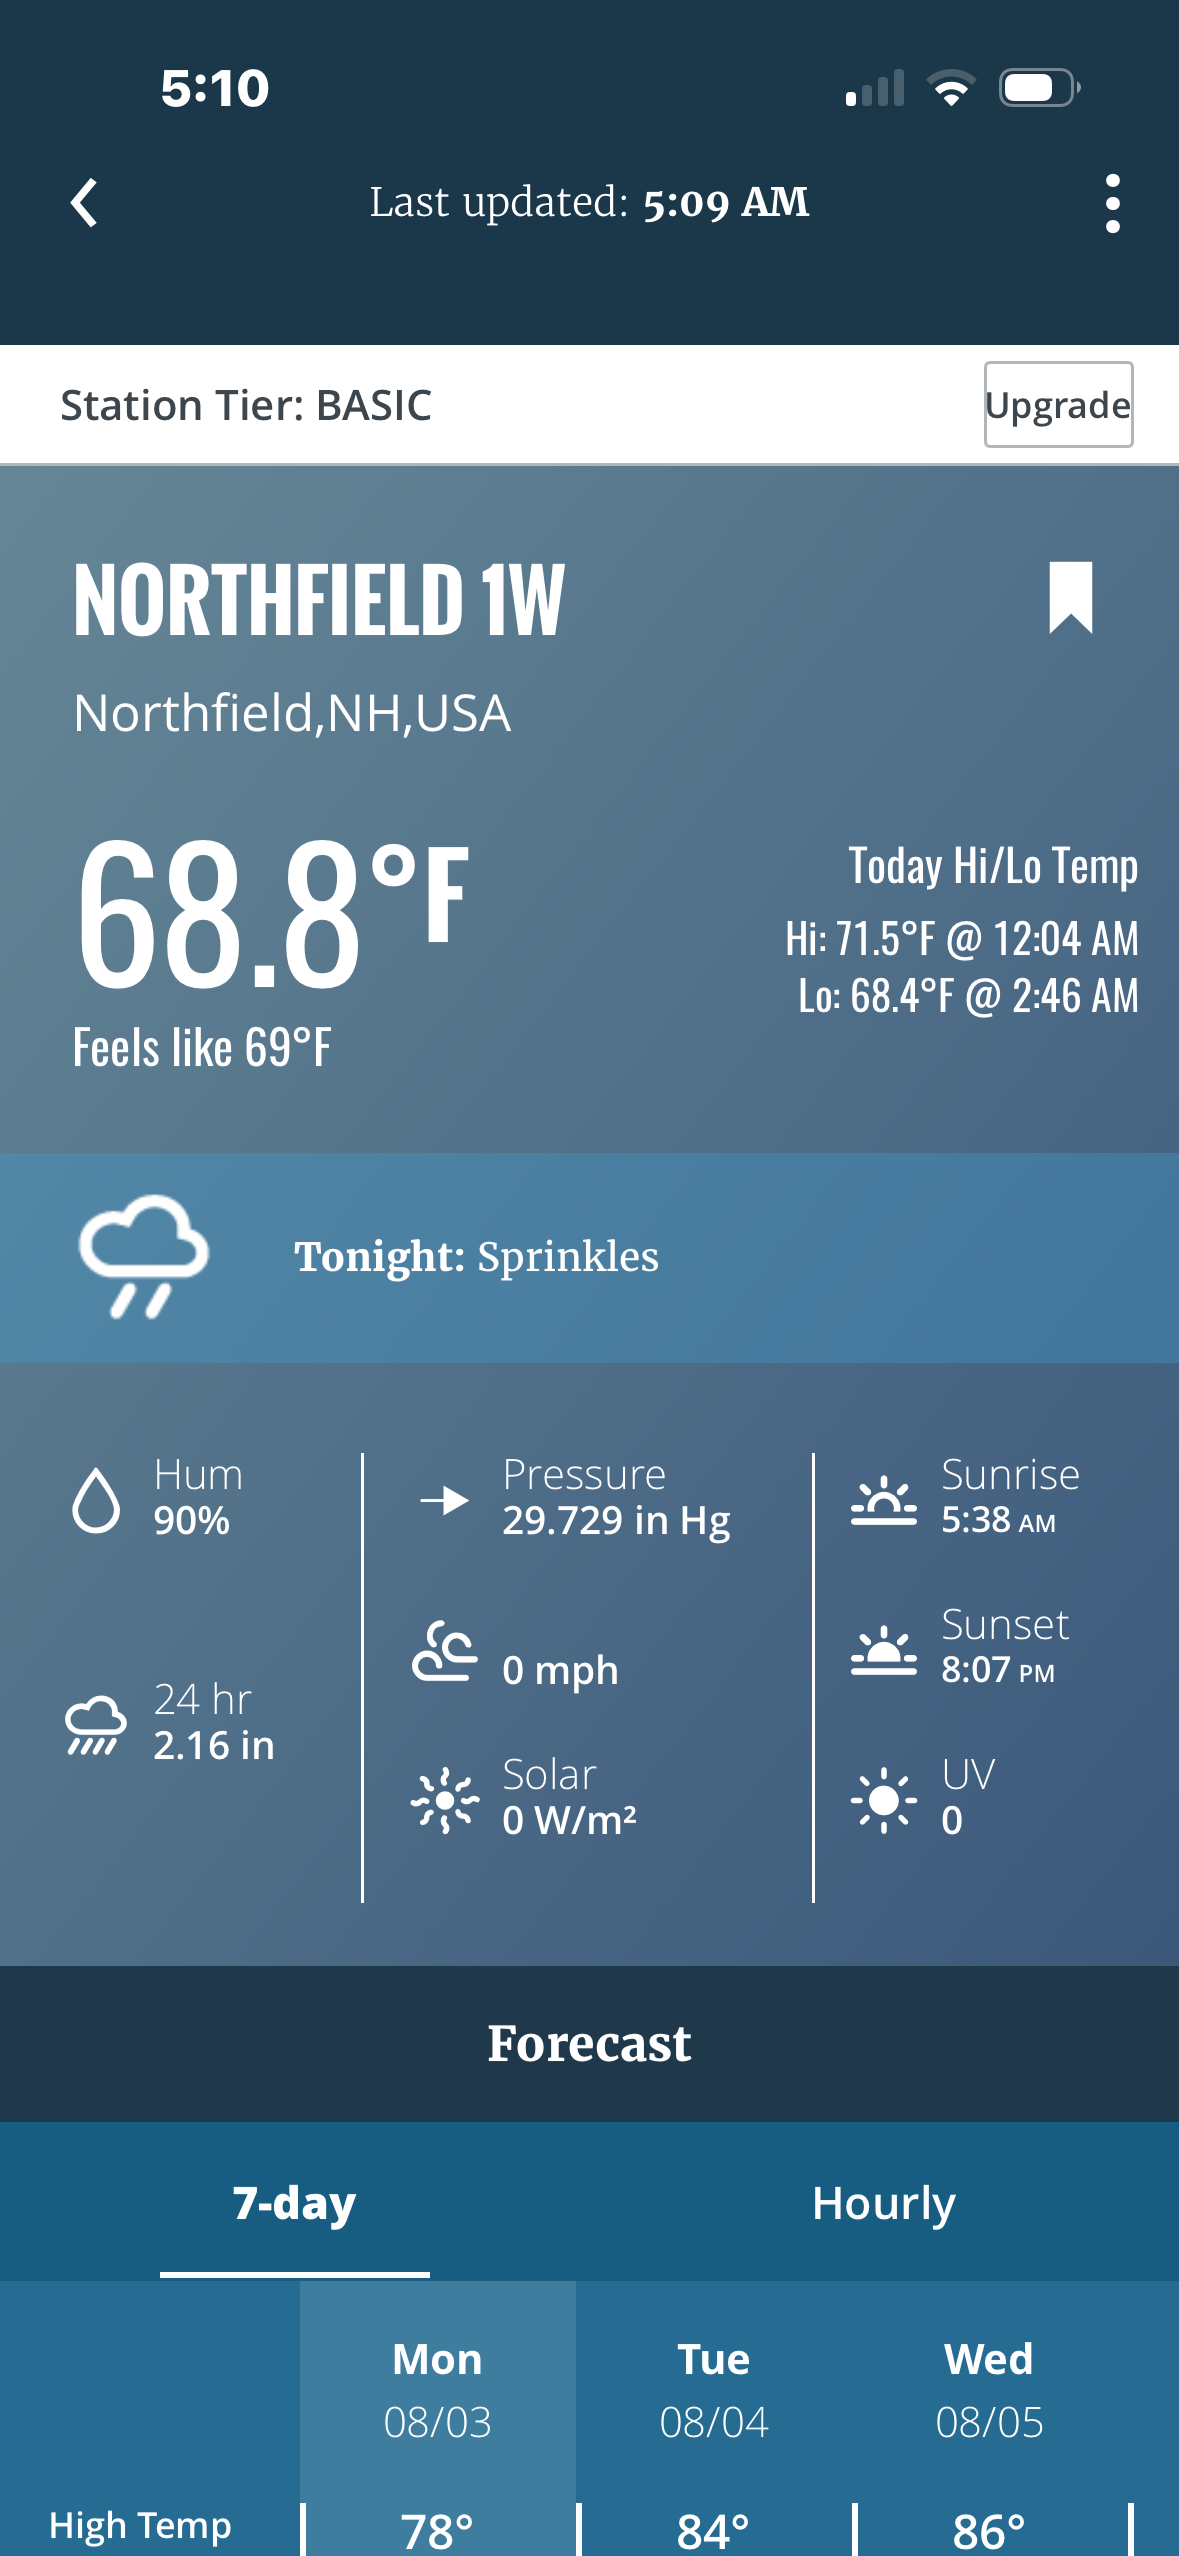
70/70/70 with 100% humidity. Fuck this shit bring on winter. (Also box fan broke while was at work yesterday so bleh) Sent from my SM-S176V using Tapatalk -

Augdewst 2026: Summer's Last Stand
CoastalWx replied to Prismshine Productions's topic in New England
Yeah nice gravy train west of Kevin to Dendy. But once again boring convection. Barely any. -

Augdewst 2026: Summer's Last Stand
Damage In Tolland replied to Prismshine Productions's topic in New England
Guess who whined their way to a Stein buster. Dendy!
-
Ripping.
-

Augdewst 2026: Summer's Last Stand
ineedsnow replied to Prismshine Productions's topic in New England
We flood!! -

2026-2027 Super El Nino
snowman19 replied to Stormchaserchuck1's topic in Weather Forecasting and Discussion
The east-based forcing is absolutely believable. Why? Because we have the 30C isotherm all the way east of the dateline now and it’s still moving further east, being pushed by the non stop WWBs and DWKWs. The models have it getting all the way to 140W. This has never happened before in weather record history and the convection is going to follow it In other news, the +IOD is getting stronger quickly, it’s now up to +0.63 from +0.44 last week. The models are also getting stronger with it this fall @LakePaste25 -
 best price for viagra 100mg: Viagra tablet online - Viagra online price
 -

E PA/NJ/DE Summer 2026 Obs/Discussion
Hurricane Agnes replied to PhiEaglesfan712's topic in Philadelphia Region
Now up to 1.06" after more heavy rain. Glad to see the FFW that was carved around to exclude NW Philly, was supplemented with a new one to include it as I know there are some low-lying areas bordering creeks, that do flood with these kinds of heavy rain bursts. Currently in a break from the rain, with temp 75 and dp 74. Steambath! -
Very S FL like morning, low 75F. So far it looks like Congrats areas 84 and west?
-
Key West spout 7/24 https://x.com/deZabedrosky/status/2081401272578531578 Note that in order to listen to the audio and full size a video on X, you have to login now. About as classic "true" waterspout as you can get. Thin tall tube, slow moving, no rain, LTG, or wall cloud present, just TCU. Notice that after the base vortex moves over the dock, it re-emerges more intense and focused. This happens sometimes for spouts when the first come ashore. The rapid increase in friction can strengthen the base temporarily .
-
Augdewst 2026: Summer's Last Stand
vortex95 replied to Prismshine Productions's topic in New England
Key West spout 7/24 https://x.com/deZabedrosky/status/2081401272578531578 That's @weatherwiz on the dock letting the the vortex come over him! Note that in order to listen to the audio and full size a video on X, you have to login now. About as classic "true" waterspout as you can get. Thin tall tube, slow moving, no rain, LTG, or wall cloud present, just TCU. Notice that after the base vortex moves over the dock, it re-emerges more intense and focused. This happens sometimes for spouts when the first come ashore. The rapid increase in friction can strengthen the base temporarily . - Today
-
It looks like it might be a rainy morning rush hour. There's a nice batch of rain developing to our south over VA.
-
cheapest viagra: Viagra tablet online - Buy generic 100mg Viagra online
-
Viagra without a doctor prescription Canada [url=http://medmennews.com/#]MedMenNews[/url] order viagra
-

2026-2027 Super El Nino
OSUmetstud replied to Stormchaserchuck1's topic in Weather Forecasting and Discussion
The TNI is the more typical way to look at it and with Nino 4 historically warm right now it's going to be hard to more east-based than 1997. -
E PA/NJ/DE Summer 2026 Obs/Discussion
Hurricane Agnes replied to PhiEaglesfan712's topic in Philadelphia Region
Getting gully washer the past 10 minutes with ,>2"/hr, went from 0.08" to 0.85" in the bucket here in NW Philly. Temp/dp both 76. -
Dolphin appears to be en route to a very large eye. Inner eyewall is quite thin on W side. Not sure if drier air has got entrained into the W quad of the system or it is artifact of the next ERC. Either way, a lot of time still for this TC to evolve further, and no reason to think it will not end up being a "donut!"
-
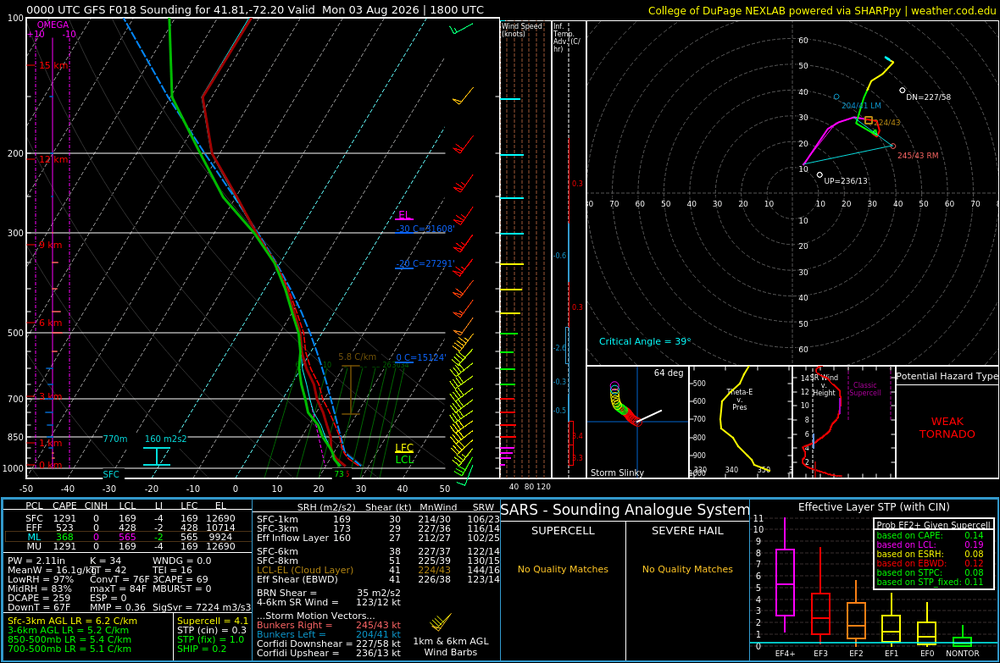
Augdewst 2026: Summer's Last Stand
vortex95 replied to Prismshine Productions's topic in New England
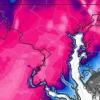
PT time for @weatherwiz b/c 2% spinner risk for CT now! I can see that. Even though winds are unidirectional sfc-aloft, they are quite strong at 925 and 850. 30-50 kt W to E from central CT to ern MA. Anything over 30 kt means spinner business. 30 -50 kt at 850 as well. Attached is GFS sounding for ern CT at 18z. 38 kt 0-6 km shear is enoughs for supercell and 30 kt 0-1 km shear is excellent for spinner potential. HRRR shows large areas of 0-3 km CAPE 100+ so there is your low-level stretching. Classic tropical tor set up where best winds, relatively speaking, are at low-levels.
-
1.1 in 2 downpours. Some of the heaviest rain so far this year.
-
1.1 already this morning.
-
Monsoon outside. Storms building and sliding sw to ne
-
sildenafil over the counter or Cheap generic Viagra online Buy generic 100mg Viagra online https://www.onlinefussballmanager.de/forward.php?tid=174752&url=medmennews.xyz Viagra Tablet price and https://mantiseye.com/community/vjklgudjfl Generic Viagra online [url=http://neurostar.com/en/redirect.php?url=http://medmennews.xyz/]Order Viagra 50 mg online[/url] buy Viagra over the counter or [url=http://www.freeworld.imotor.com/space.php?uid=206341]Viagra tablet online[/url] Viagra online price