All Activity
- Past hour
-
Schrodinger's cat to Satan's Grundle. You're quite the enlightened bartender.
-
That is a really good and interesting question. This touches on the topic of ENSO as well. As we've discussed before the ENSO region hasn't warmed in the last few decades despite the global average warming. As a result the general circulation patterns that had once typified the ENSO cycle are no longer playing out; at least no in the same way as they once did. This is because El Nino's appear attenuated and La Nina's amplified against the global backdrop. This is the primary motivation of new indices like the RONI.
-
.27 in bucket so far 2 day total of .83
-
Yup its been wash rinse repeat and this week looks like more of same
-
Euro continues to get warmer for next Monday and Tuesday. 40c is nuts
-

2025 Spring/Summer Mountain Thread
Buckethead replied to Maggie Valley Steve's topic in Southeastern States
The storms were impressive yesterday afternoon. I was mesmerized by the peus over the storm that developed near Black Mountain. Then I caught what I believe to be a crown flash! https://www.instagram.com/reel/DK7lkWixQHK/?igsh=MWwxMXRienFzbGpsOA== Sent from my SM-S908U using Tapatalk -
If it's going to be hot I want it to break records or get big storms out of it
-
Zero complaints on this weather. So comfortable.
-
Fairbanks was warmer than my place The NWS issued a heat advisory for this, close to 80 near the Arctic Circle
-
67F. Too chilly
-
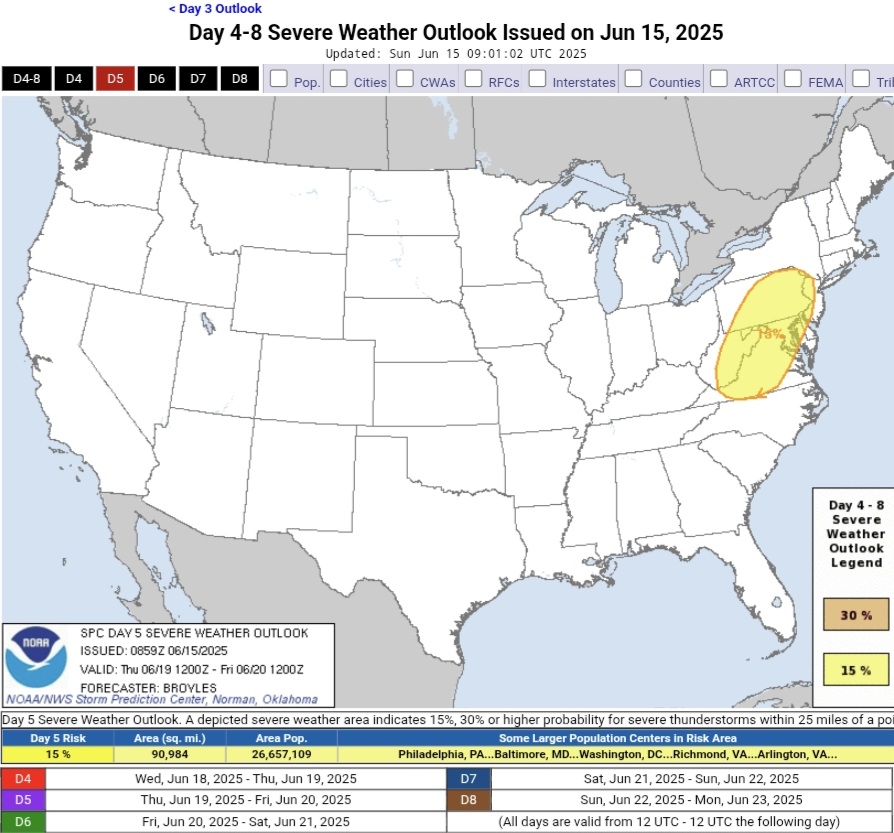
Day 5 Thursday The mid-level trough is forecast to move into the lower Great Lakes and upper Ohio Valley on Thursday, as the cold front advances into the central Appalachians. As the airmass ahead of the front destabilizes, scattered thunderstorms are expected to form along and ahead of the front. The models suggest that moderate deep-layer shear will be in place across much of the northeastern U.S., which will likely support organized storms. Damaging winds gusts will be the most likely severe threat.

- Today
-
wow 25 is a HUGE number of 95 degree days, 1993 is WAY ahead at Newark.... 1993 and 2010 being one and two matches my climate experience here. 1944 is absolutely amazing for that era with 20, it's good to see the Hall of Fame summers at the top!
-
to be fair 60s and 70s are not hot lol, 80+ I'd agree with you.
-
Newark 95 degree day season leaders Year Rank Days >= 95 °F 1993 1 25 2010 2 21 2022 3 20 1988 3 20 1944 3 20 2021 6 18 2012 7 17 2011 7 17 2002 7 17 1955 7 17 1949 11 16 2005 12 14 1953 12 14 2016 14 13 1999 14 13 1991 14 13 1987 14 13 1994 18 12 1983 18 12 1966 18 12 2018 21 11 1973 21 11 2024 23 10 2013 23 10 1995 23 10 1963 23 10 1952 23 10 1943 23 10 1911 23 10 1900 23 10 1989 31 9 1981 31 9 1959 31 9 1957 31 9 1948 31 9 2015 36 8
-

2025-2026 ENSO
Stormchaserchuck1 replied to 40/70 Benchmark's topic in Weather Forecasting and Discussion
I don't see anything that says 100 degrees. I see 1 day in the 90s, but maybe we'll get a few in the 90s. -
1955 at the top matches NYC's 16 that year Interesting that LGA used to be cooler than NYC (up to and including 1993 I think.) 2010 matches JFK (they both had 11 that year, the very best summer we ever had!)
-
LGA 95 degree days season leaders Year Rank Days >= 95 °F 1955 1 14 2020 2 13 1999 2 13 2012 4 11 2010 4 11 1991 4 11 1953 4 11 1995 8 10 2021 9 9 2005 9 9 2002 9 9 1988 9 9 1949 9 9 2018 14 8 2016 14 8 2013 14 8 2022 17 7 1994 17 7 1993 17 7 1983 17 7 1966 17 7 1952 17 7 1944 17 7 2024 24 6 2019 24 6 2011 24 6 2008 24 6 2006 24 6 2001 24 6
-

2025-2026 ENSO
PhiEaglesfan712 replied to 40/70 Benchmark's topic in Weather Forecasting and Discussion
Let's not re-write the weather. Yeah, the first half of April was a bit cool and rainy (but only slightly to the average): 2025-04-01 62 44 53.0 4.0 12 0 0.16 0.0 0 2025-04-02 57 38 47.5 -1.9 17 0 0.02 0.0 0 2025-04-03 76 48 62.0 12.2 3 0 0.04 0.0 0 2025-04-04 71 60 65.5 15.4 0 1 0.88 T 0 2025-04-05 62 49 55.5 5.0 9 0 0.02 0.0 0 2025-04-06 55 48 51.5 0.6 13 0 0.02 0.0 0 2025-04-07 51 41 46.0 -5.3 19 0 0.28 0.0 0 2025-04-08 48 38 43.0 -8.7 22 0 0.00 0.0 0 2025-04-09 50 33 41.5 -10.6 23 0 0.00 0.0 0 2025-04-10 54 42 48.0 -4.5 17 0 T 0.0 0 2025-04-11 48 42 45.0 -7.9 20 0 1.24 0.0 0 2025-04-12 45 38 41.5 -11.8 23 0 0.14 0.0 0 But as you can see, after the 12th, it turns very hot and dry (only 0.03 inches of rain after the Nor'easter): 2025-04-13 62 42 52.0 -1.6 13 0 0.00 0.0 0 2025-04-14 70 44 57.0 3.0 8 0 T 0.0 0 2025-04-15 69 48 58.5 4.1 6 0 T 0.0 0 2025-04-16 57 44 50.5 -4.3 14 0 0.00 0.0 0 2025-04-17 63 37 50.0 -5.2 15 0 0.00 0.0 0 2025-04-18 72 42 57.0 1.5 8 0 0.00 0.0 0 2025-04-19 80 63 71.5 15.6 0 7 0.00 0.0 0 2025-04-20 73 51 62.0 5.7 3 0 0.00 0.0 0 2025-04-21 66 50 58.0 1.4 7 0 T 0.0 0 2025-04-22 80 53 66.5 9.5 0 2 0.00 0.0 0 2025-04-23 77 54 65.5 8.2 0 1 0.00 0.0 0 2025-04-24 79 50 64.5 6.8 0 0 0.00 0.0 0 2025-04-25 79 51 65.0 7.0 0 0 T 0.0 0 2025-04-26 75 53 64.0 5.6 1 0 0.03 0.0 0 2025-04-27 72 50 61.0 2.3 4 0 0.00 0.0 0 2025-04-28 75 47 61.0 2.0 4 0 0.00 0.0 0 2025-04-29 83 50 66.5 7.1 0 2 0.00 0.0 0 2025-04-30 80 57 68.5 8.8 0 4 T 0.0 0 The cold pattern, outside of a few hiccups, ended just after the 2/20 snow event. From about the last week of February until mid-May was mostly warm. Only around mid-May did we turn cold. 2025-05-01 81 54 67.5 7.5 0 3 0.00 0.0 0 2025-05-02 86 59 72.5 12.2 0 8 0.00 0.0 0 2025-05-03 85 64 74.5 13.9 0 10 0.04 0.0 0 2025-05-04 73 63 68.0 7.1 0 3 0.12 0.0 0 2025-05-05 73 61 67.0 5.8 0 2 T 0.0 0 2025-05-06 81 61 71.0 9.5 0 6 0.03 0.0 0 2025-05-07 75 60 67.5 5.7 0 3 T 0.0 0 2025-05-08 81 59 70.0 7.9 0 5 T 0.0 0 2025-05-09 64 51 57.5 -4.8 7 0 0.18 0.0 0 2025-05-10 74 49 61.5 -1.1 3 0 0.00 0.0 0 2025-05-11 82 55 68.5 5.6 0 4 0.00 0.0 0 2025-05-12 83 55 69.0 5.8 0 4 0.00 0.0 0 2025-05-13 71 62 66.5 3.1 0 2 0.28 0.0 0 2025-05-14 66 59 62.5 -1.2 2 0 1.30 0.0 0 2025-05-15 77 63 70.0 6.0 0 5 0.03 0.0 0 2025-05-16 77 60 68.5 4.2 0 4 1.50 0.0 0 2025-05-17 86 62 74.0 9.4 0 9 T 0.0 0 2025-05-18 77 64 70.5 5.7 0 6 0.00 0.0 0 Pretty clearly you can see the pattern change from warm to cold: 2025-05-19 71 56 63.5 -1.6 1 0 0.00 0.0 0 2025-05-20 69 50 59.5 -5.9 5 0 0.00 0.0 0 2025-05-21 57 52 54.5 -11.2 10 0 0.45 0.0 0 2025-05-22 56 51 53.5 -12.5 11 0 0.56 0.0 0 2025-05-23 69 51 60.0 -6.3 5 0 T 0.0 0 2025-05-24 68 50 59.0 -7.5 6 0 T 0.0 0 2025-05-25 71 52 61.5 -5.3 3 0 0.00 0.0 0 2025-05-26 75 53 64.0 -3.1 1 0 0.00 0.0 0 2025-05-27 74 54 64.0 -3.4 1 0 0.01 0.0 0 2025-05-28 59 53 56.0 -11.7 9 0 0.77 0.0 0 2025-05-29 74 57 65.5 -2.6 0 1 0.01 0.0 0 2025-05-30 79 63 71.0 2.6 0 6 0.88 0.0 0 2025-05-31 75 55 65.0 -3.7 0 0 0.06 0.0 0 -
Yay some sanity has been restored !! 1993 at the top of the 100+ list lol. 1949 is a close second !!
-
Clouds look to linger through Tue afternoon. Wed looks to clear out and low- mid 80s. Thursday is the hot day this week but could see some storms later in the day.
-
Newark 100 degree day season leaders 1993 1 9 1949 2 8 2022 3 6 1953 3 6 1988 5 5 1966 5 5 2011 7 4 2010 7 4 1955 7 4 1944 7 4 2012 11 3 2006 11 3 2005 11 3 2001 11 3 1999 11 3 1911 11 3 2024 17 2 2021 17 2 2013 17 2 2002 17 2 1997 17 2 1994 17 2 1991 17 2 1980 17 2 1977 17 2 1954 17 2 1948 17 2 1943 17 2 1936 17 2 1919 17 2 1901 17 2 1898 17 2
-
wait, is that Forky haha?
-
99 would be a huge disappointment....
-
2006 doesn't even make the list for the hottest summers lol lol how are 1948 and 1949 at the bottom of the list, they were much hotter at NYC, JFK and EWR. This goes to my idea that LGA heated up with more car traffic, there was clearly much less traffic in the late 40s, so LGA was cooler than the other sites. 1993 isn't on this list at all, when EWR had 9, NYC had 3 and JFK had 2 days of 100+? LGA doesn't match my climate experience at all, EWR is a much closer match actually.
.thumb.jpg.6a4895b2a43f87359e4e7d04a6fa0d14.jpg)