All Activity
- Past hour
-
I mean you should see the 1mb split……wowzers!!
-
 pharmacies in canada that ship to the us: CanPointe - trusted canadian pharmacy
-

2026-2027 Record-breaking El Nino
GaWx replied to Stormchaserchuck1's topic in Weather Forecasting and Discussion
Mitch, I just realized I had a typo as I called the winds on those charts “anomalies”. I realize they’re not anomalies and are instead absolutes but for some reason I typed anomalies. Thus, I just corrected the original post. My original thoughts are unchanged. I think my erroneously originally referring to them as anomalies threw you off. So, the +5 and +4 are actual winds rather than being 5 and 4 above normal. Is that what threw you off? —————— Aside: Ignore the trolls. Apparently moderation is nonexistent here. -
 H2Otown_WX changed their profile photo
-

2026-2027 Record-breaking El Nino
forkyfork replied to Stormchaserchuck1's topic in Weather Forecasting and Discussion
look at that bounce back upward right when you don't want it -

2026-2027 Record-breaking El Nino
mitchnick replied to Stormchaserchuck1's topic in Weather Forecasting and Discussion
Lowest yet.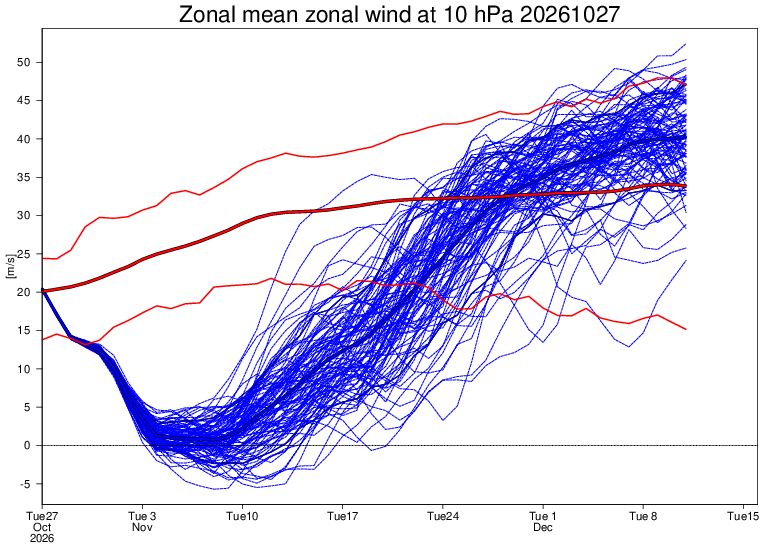
-
Been following the ENSO thread in the main forum all summer. Its kind of like a winter preview. Lots of good discussion, but have to sift through the usual troll garbage. Expectations definitely set for a warmer than avg winter, but with a juiced jet Im liking the chances of a real good storm or two. Last winter was perfect for us deep winter lovers, but all the snow was powder. I anticipate a few good paste jobs this year making for scenic pics. My first guess for Detroit is 30"-ish in total. After a banner snowcover year last winter, expect much more bare this winter unfortunately.
-
That is what's called a conspiracy theory. And as genuine of a person as Lamar is, he would not be the type to get up there and lie either even if told to...he said himself what the injury was. Really even with previous injuries he has always come out later and detailed what was going on. I get the feeling he likes to keep things private (even though the strategy isn't exactly helpful in public perception).
-
2026-2027 Record-breaking El Nino
GaWx replied to Stormchaserchuck1's topic in Weather Forecasting and Discussion
Mitch, Danny Devito says no and I agree with him. 1976 and 2009 had very weak winds but they didn’t go <0. I was looking at El Niño Novs that dipped to +5 or lower. 1968, 1976, and 2009 were the only three to do so per ERA data. A +5 dip is very weak. -

2026-2027 Record-breaking El Nino
michsnowfreak replied to Stormchaserchuck1's topic in Weather Forecasting and Discussion
He missed bad in '24-25 as well. Hes not "forecasting" like you, hes just playing his game. -
2026-2027 Record-breaking El Nino
mitchnick replied to Stormchaserchuck1's topic in Weather Forecasting and Discussion
Aren't the + signs supposed to be - signs? -

2026-2027 Record-breaking El Nino
bluewave replied to Stormchaserchuck1's topic in Weather Forecasting and Discussion
I only posted the highest peak departures during each of those months. Numerous surrounding stations were also over +10. So you are correct that it would probably take hours noting every station to reach +10 or more since 2015-2016. It’s anyone’s guess at this point exactly where the highest monthly departures will occur during the winter months this coming season. 2015-2016 was unique that it combined with the MJO 6 getting the greatest absolute temperatures and departures all the way to the East Coast. But the CONUS record for warmest December set in 2015 was already exceeded twice since then with two years coming very close. December 2021 and 2023 actually had more extensive warmth and greater coverage of the high departures than 2015. Most of the time the highest departures during super El Niño events occur from the Upper Plains into the interior Northeast. Top 5 Contiguous Warmest U.S. Average Temperature December December 2023 39.76°F 131 December 2021 39.34°F 130 December 2015 38.64°F 129 December 2024 38.16°F 128 December 2025 37.83°F 127 DEC…2015….NYC….+13.3 MAR…2016…MOT….+10.5 JAN…2017….BTV…..+11.0 FEB….2017….ORD….+10.3 FEB…..2018…ATL….+10.6 FEB….2019…MGM….+10.5 JAN….2020…YAM….+9.8 DEC….2021….DFW….+13.2 JAN….2023….DXR….+12.3 FEB….2023…..SSI…..+9.8 DEC….2023….INL…..+15.8 FEB…..2024….FAR…..+17.5 DEC….2024…..LND…..+11.3 DEC….2025….CPR…..+12.1 JAN….2026….RIW……+10.2 FEB…..2026….LND…..+11.3 MAR….2026….PHX…..+12.5 -
2026-2027 Record-breaking El Nino
mitchnick replied to Stormchaserchuck1's topic in Weather Forecasting and Discussion
How big is the bridge? Asking for a friend. -
So many 10mb maps on social media. You hate to see it.
-
2026-2027 Record-breaking El Nino
GaWx replied to Stormchaserchuck1's topic in Weather Forecasting and Discussion
The chart below has 10 mb/60N winds back to 1949. According to it, Nov 2026 is going to per ERA obliterate the old record (all of the way back to at least 1949) earliest SSWe whether it gets down to 0 (major SSW) or stays just above. The earliest SSW on record is 1952’s ~Nov 15th SSW. So, 2026 is headed to possibly beat 1952 by ~11 days! ———————— Looking at the above chart for only El Niño Novs, the only other three that got to +5 or lower per ERA5 in Nov were 1968 (-5 on Nov 27th), 1976 (+4 on ~Nov 15th), and 2009 (+5 on ~Nov 15th). These three had the lowest DJF AO of any winters since at least 1949-50. Thus, these very strong winter -AOs were quite possibly connected to a large extent to the very weak Nov SPV period. Thus, a case could be made for a better than average chance for a strong -AO averaged out in 2026-7 despite the lack of seasonal model support: 1968-9: AO -2.3 1976-7: AO -2.6 2009-10: AO -3.4 @Typhoon Tip *Edited for typo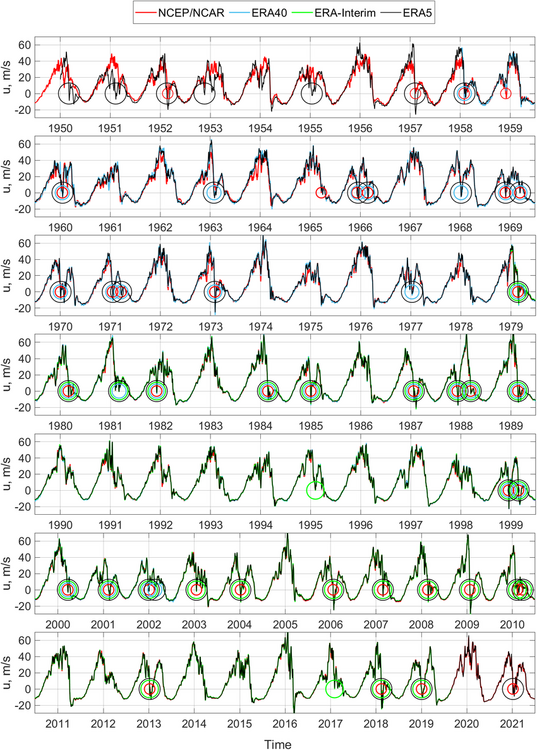
-
It should get a lot more active. NAO/AO will be dropping, PNA rising. Ensembles are getting a lot wetter.
-
2026-2027 Record-breaking El Nino
michsnowfreak replied to Stormchaserchuck1's topic in Weather Forecasting and Discussion
Its interesting that all he can do is quote posts from before the last flakes even fell LAST season.....8-9 MONTHS before winter arrives. Your quoted posts of his are from right when winter was on the doorstep last year. -

2026-2027 Record-breaking El Nino
snowman19 replied to Stormchaserchuck1's topic in Weather Forecasting and Discussion
I said it before and I’ll say it again. I think the PDO flips positive. Likely weak positive but positive none the less. On a side note, I also see a rapid recovery and restrengthening of the SPV after the dip next month. The background conditions are much too hostile to sustain a weak SPV As far as 2009-10 lol If anyone actually believes that, I have a bridge to sell them Edit: @mitchnick As big as the warm temperature departures are going to be this winter -

2026-2027 Record-breaking El Nino
jconsor replied to Stormchaserchuck1's topic in Weather Forecasting and Discussion
I don't think Dr. Judah Cohen is a kook. Some of his ideas are unconvential, sure. He always explains his reasoning in his blogs... he's not just pulling 2009-10 out of a hat. FYI His company's subseasonal model beat all other entrants in the ECMWF AI WeatherQuest competition in fall 2025 and winter 2025-26: https://news.mit.edu/2026/decoding-arctic-to-predict-winter-weather-0108 https://news.mit.edu/2026/researchers-improve-weather-forecasts-looking-two-six-weeks-out-1014 https://www.nature.com/articles/d41586-026-03077-0 -
2026-2027 Record-breaking El Nino
michsnowfreak replied to Stormchaserchuck1's topic in Weather Forecasting and Discussion
bluewave probably spent hours trying to locate one station for each month that had a +10 anomaly. There is a big difference between an isolated station versus an entire region ala Dec 2015. -
2026-2027 Record-breaking El Nino
michsnowfreak replied to Stormchaserchuck1's topic in Weather Forecasting and Discussion
Always so many factors. There are a handful of late 19th-early 20th century winters that featured incredible warmth in parts of the north/east U.S. I have no idea what the weather patterns/indicies were in place, but they featured extraordinary warmth, a few of which has never been exceeded in this region since then- 1881-82, 1889-90, 1931-32 (these are the 3 warmest at Detroit and many other nearby locals). Other warm winters included 1875-76, 1877-78, 1879-80, 1905-06, 1918-19. If you add some mathematical formula of X per decade of warming if we had the same identical pattern today, youd get an astronomical number the likes which we have never seen. So I don't think thats always the answer. This El Nino may be a bit warmer over the CONUS as a whole than under identical conditions a decade or two ago, but that still means nothing for individual areas. -

2026-2027 Record-breaking El Nino
FPizz replied to Stormchaserchuck1's topic in Weather Forecasting and Discussion
I see now. But, he a kook we all make fun of and have for years? We all know that, so why even post about it? It is like 2 or 3 people that mentioned something, when 5000 others say warmth. I just don't get it I guess. -
2026-2027 Record-breaking El Nino
jconsor replied to Stormchaserchuck1's topic in Weather Forecasting and Discussion
Dr. Judah Cohen did mention that he feels 2009-10 may be the best analog in the past 30 or so years: https://published.aer.com/aoblog/aoblog.html -
2026-2027 Record-breaking El Nino
FPizz replied to Stormchaserchuck1's topic in Weather Forecasting and Discussion
And you probably would follow the weenies that would post that -
2026-2027 Record-breaking El Nino
jconsor replied to Stormchaserchuck1's topic in Weather Forecasting and Discussion
Having a weak stratospheric PV in Nov is quite uncharacteristic of a strong El Nino: https://x.com/rjameswx/status/2115111708884869209 -
UMMMM, it all of a sudden became a high ankle sprain. It's complete BS, they're trying to cover for him because he has them by the balls. Right after it happened they said if it was a playoff game he could have went back in, all of a sudden 3 weeks later it's a high ankle sprain. I have a bridge to sell you.