All Activity
- Past hour
-
Agreed. Just have to see how it plays out…but at the moment there’s model support. That’s all that can be said currently .
-
You know you have reached weather nerd status when you notice high clouds rolling in and say to yourself, those must be from the hurricane, then look at a satellite pic to confirm. Hope we get some juice from this thing
-
I agree with the portion that points out the forward motion direction (NNE) aligning with the shear vector reducing its impact on the system. Sure, it may eliminate any chance of strengthening, but a massive drop in strength prior to landfall looks pretty unlikely at this point.
-
lol…first of all at these lead times, it’s not worth much either way. And, there are no hard a fast rules that work in every scenario. Those that have any knowledge about weather, know this. And at this time of the year…nobody is forecasting cold, even if there is troughing in the eastern U.S., so I don’t really get what you’re saying? Troughing to produce a system is all that is being discussed.
-
Happy Birthday Ant!!
-
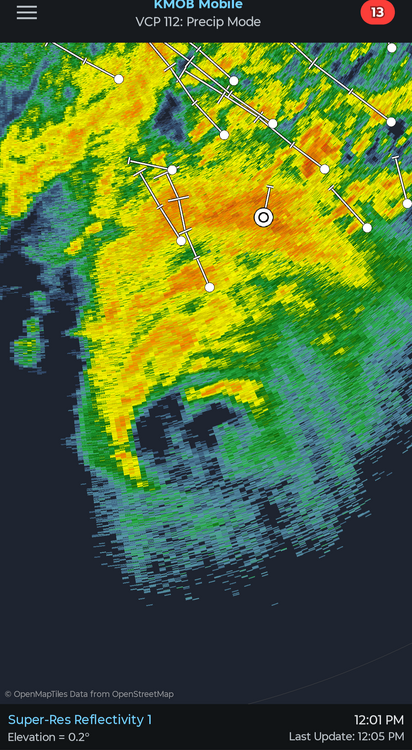
Damn just noticed that in the radar frames as you said it. Yeah, that will expand the wind field for sure.
-
Seemingly no pressure rose yet. First pass 957 extrap
-
 http://hydropressdirect.com/# international pharmacy
 -
I meant Imelda from 2019. You don't see 43" of rain from a TC in the CONUS every day, and Imelda is the second costliest TS on record ($5B), so impact was very high. Net societal impact matters-more for retirement overall.
-
Looks like it’s made a turn north
-
Thanks. Whereas for TCL they’ve got a TS warning, they didn’t ever predict TS conditions for ATL. Instead they have a high wind warning:
-
Yes the lack of TC activity has allows the waters to warm more. That is largely a function of El NIno. So suppression overall can lead to enhancements for individual TCs that do manage to develop.
-
(002).thumb.png.6e3d9d46bca5fe41aab7a74871dd8af8.png) Hello all. I have spent the last couple of months digging into one question and would welcome feedback and pushback. The question is not whether raw or adjusted data is more accurate. It is simpler than that... based on the data any of us can access, can we prove that NCEI's adjustments to our local temperature record are necessary, and sized correctly? What the adjustments do here Using every Chester County station, 1895 to 2025, the raw record warms about +0.05°F per decade, which is not statistically significant. NCEI's adjusted county series warms +0.25°F per decade. The gap between the two grows at about +0.2°F per decade and that gap is significant. Most of it comes from cooling the early decades, which NCEI runs 1.4 to 2.0°F below what the thermometers recorded. I also compared the three nearest long-record airports, all outside the county, against their own NCEI adjusted series: PHL (1941 to 2025): raw +0.44, adjusted +0.40. NCEI barely touches it. ABE (1948 to 2025): raw +0.31, adjusted +0.60. NCEI cools the early record by up to about 2.5°F, which roughly doubles Allentown's warming trend. RDG: NCEI only has an adjusted series from 2000 on, and it cuts Reading's trend from +1.36 to +0.77. Over the same 1948 to 2025 window, NCEI's adjustments add roughly +0.2 to +0.3°F per decade of warming both at Allentown (+0.29) and in Chester County (+0.17 against all county stations, +0.33 against our two longest continuous stations, West Chester 2NW and Phoenixville 1E). So Allentown and Chester County get about the same boost. PHL is the one that gets almost none. Against our most rural long-record stations, PHL warms roughly 0.2 to 0.3°F per decade faster since 1948. That looks like urban and airport growth that the adjusted PHL series keeps in, although the uncertainty range on it runs from about zero to +0.5. What we can prove Phoenixville shows a step of almost 2°F in 1987. Raw data has real artifacts in it. What we cannot prove We cannot show the adjustments are the right size, or that every one is needed. Coatesville 1SW is the clearest example. It had a documented move in January 1946 and NCEI lists a 1.4°F step for it, then lowers everything before 1946 to match. I compared Coatesville against every neighbor I could find with data on both sides of 1946... Phoenixville, Ephrata, Holtwood and Lancaster, all between 21 and 28 miles away. Each of those tracks Coatesville closely enough on its own to catch a step of about 0.4 to 0.7°F, roughly a third to a half of the size NCEI applies. Against those stations averaged together the step is only -0.25 to +0.07°F and not significant. So these neighbors were sensitive enough to see a step the size NCEI applies, and none of the ones without their own 1948 changes consistently show it. Phoenixville and Ephrata cooled right along with Coatesville. The only neighbors that show a bigger step are West Chester and Lancaster, and both of those had their own location changes in 1948. Coatesville also carries 12 NCEI breakpoints and only 4 are documented. West Chester carries 15 with 4 documented. NOAA's own station history for observation times conflicts with the reading-time schedules commonly assumed for these stations. To be fair, we also cannot show NCEI got it totally wrong. As NCEI compares against a much wider network of neighbors than we can see. So my conclusion: adjustments are necessary in principle, but from public data we can neither verify nor disprove their size here. What would close the gap NCEI's pairwise log for each station, showing which neighbors, which years and what weights were used for each break. I reached out to NCEI who told me this is not something they publish. The time-of-observation step on its own for each station, separate from the other adjustments. The original observer forms (B-91s) for the years where NOAA's records conflict or are blank. Dated site move and instrument change details, including the MMTS changes in the 1980s and ASOS at the airports in the 1990s. Overlapping readings at the old and new sites when a station moved. The Climate Reference Network only began in the 2000s, so it is too short to help with the early record. A re-run of NCEI's published code on the same inputs, to see whether we get the same breaks. Reading's adjusted series before 2000. Let me know if any questions or if you see anything that does not hold up!
Hello all. I have spent the last couple of months digging into one question and would welcome feedback and pushback. The question is not whether raw or adjusted data is more accurate. It is simpler than that... based on the data any of us can access, can we prove that NCEI's adjustments to our local temperature record are necessary, and sized correctly? What the adjustments do here Using every Chester County station, 1895 to 2025, the raw record warms about +0.05°F per decade, which is not statistically significant. NCEI's adjusted county series warms +0.25°F per decade. The gap between the two grows at about +0.2°F per decade and that gap is significant. Most of it comes from cooling the early decades, which NCEI runs 1.4 to 2.0°F below what the thermometers recorded. I also compared the three nearest long-record airports, all outside the county, against their own NCEI adjusted series: PHL (1941 to 2025): raw +0.44, adjusted +0.40. NCEI barely touches it. ABE (1948 to 2025): raw +0.31, adjusted +0.60. NCEI cools the early record by up to about 2.5°F, which roughly doubles Allentown's warming trend. RDG: NCEI only has an adjusted series from 2000 on, and it cuts Reading's trend from +1.36 to +0.77. Over the same 1948 to 2025 window, NCEI's adjustments add roughly +0.2 to +0.3°F per decade of warming both at Allentown (+0.29) and in Chester County (+0.17 against all county stations, +0.33 against our two longest continuous stations, West Chester 2NW and Phoenixville 1E). So Allentown and Chester County get about the same boost. PHL is the one that gets almost none. Against our most rural long-record stations, PHL warms roughly 0.2 to 0.3°F per decade faster since 1948. That looks like urban and airport growth that the adjusted PHL series keeps in, although the uncertainty range on it runs from about zero to +0.5. What we can prove Phoenixville shows a step of almost 2°F in 1987. Raw data has real artifacts in it. What we cannot prove We cannot show the adjustments are the right size, or that every one is needed. Coatesville 1SW is the clearest example. It had a documented move in January 1946 and NCEI lists a 1.4°F step for it, then lowers everything before 1946 to match. I compared Coatesville against every neighbor I could find with data on both sides of 1946... Phoenixville, Ephrata, Holtwood and Lancaster, all between 21 and 28 miles away. Each of those tracks Coatesville closely enough on its own to catch a step of about 0.4 to 0.7°F, roughly a third to a half of the size NCEI applies. Against those stations averaged together the step is only -0.25 to +0.07°F and not significant. So these neighbors were sensitive enough to see a step the size NCEI applies, and none of the ones without their own 1948 changes consistently show it. Phoenixville and Ephrata cooled right along with Coatesville. The only neighbors that show a bigger step are West Chester and Lancaster, and both of those had their own location changes in 1948. Coatesville also carries 12 NCEI breakpoints and only 4 are documented. West Chester carries 15 with 4 documented. NOAA's own station history for observation times conflicts with the reading-time schedules commonly assumed for these stations. To be fair, we also cannot show NCEI got it totally wrong. As NCEI compares against a much wider network of neighbors than we can see. So my conclusion: adjustments are necessary in principle, but from public data we can neither verify nor disprove their size here. What would close the gap NCEI's pairwise log for each station, showing which neighbors, which years and what weights were used for each break. I reached out to NCEI who told me this is not something they publish. The time-of-observation step on its own for each station, separate from the other adjustments. The original observer forms (B-91s) for the years where NOAA's records conflict or are blank. Dated site move and instrument change details, including the MMTS changes in the 1980s and ASOS at the airports in the 1990s. Overlapping readings at the old and new sites when a station moved. The Climate Reference Network only began in the 2000s, so it is too short to help with the early record. A re-run of NCEI's published code on the same inputs, to see whether we get the same breaks. Reading's adjusted series before 2000. Let me know if any questions or if you see anything that does not hold up! -
Typically yes, but the eye itself can be mess w/ multiple mesovorts rotating around in it! So finding a true wind center is not always easy.
-
Kinda looks like a double eyewall has appeared?
-
Too bad you couldn't have it tomorrow
-
Defintely My birthday is Sunday. 38 .
-
That's a good question. Sometimes the outflow from an EPAC TC does impact a TC in the Gulf. In this case, Simon's outflow is well-removed and discrete. The strong upper level trough is dominating the local synoptic environment around Isaias.
-
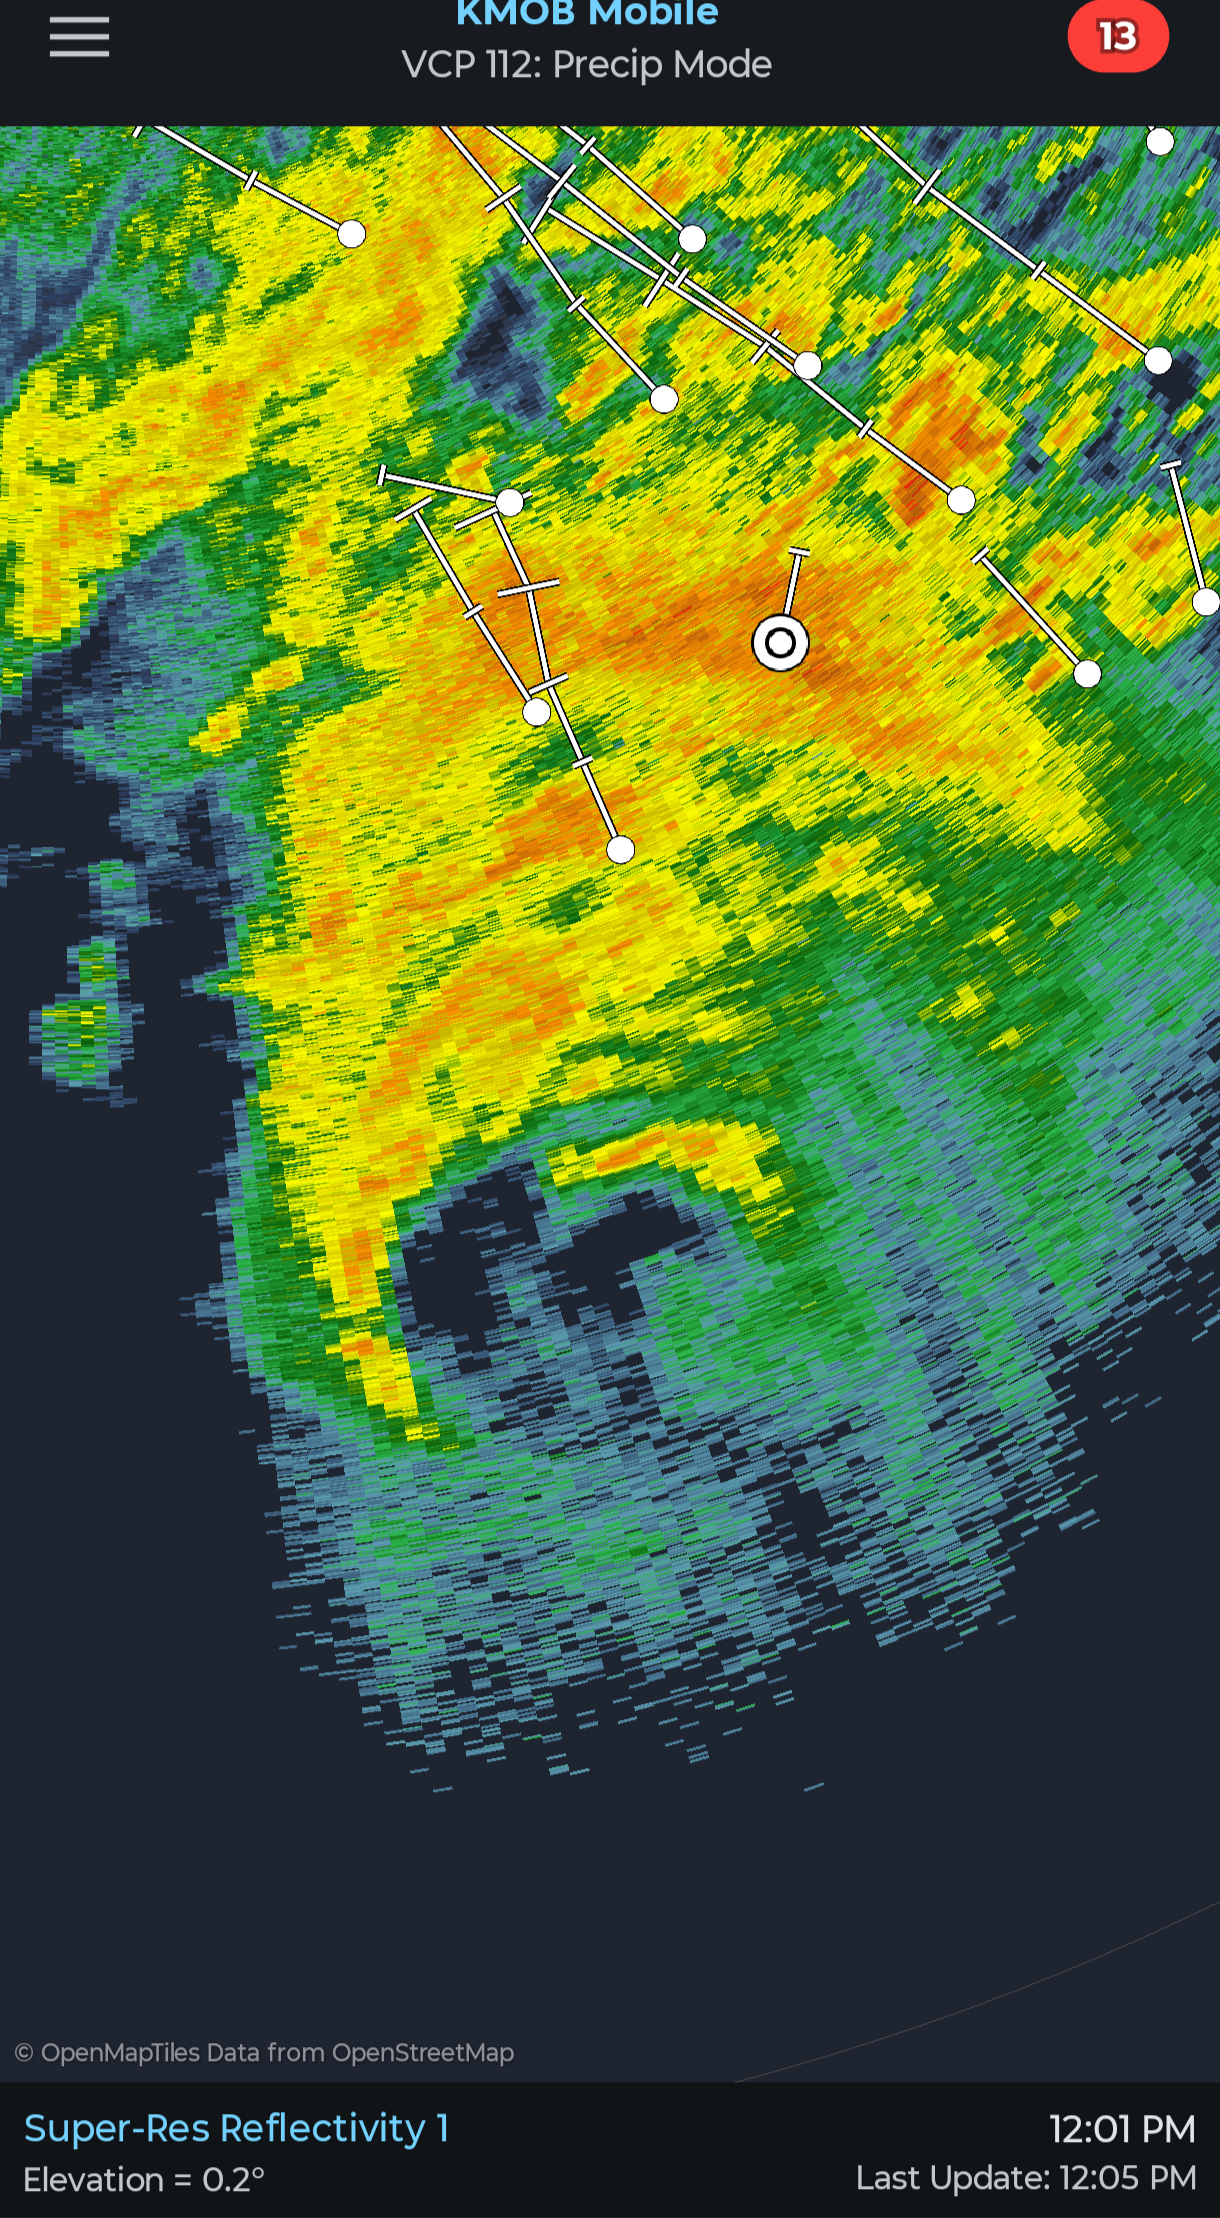
Radar has degraded so much in just the last hour. Thank goodness.
-
One thing I do like is stating "tropical storm conditions possible." Yet the actual forecast is for 15 to 25 mph *sustained* winds. That is well below the threshold. Last I checked, tropical conditions are sustained 39 mph or more. So there is hedging here is excessive IMHO. Gusts to TS force are not the same as sustained TS force. They are conflating things. I see this a lot. And really, how often does TCL and esp. ATL, get sustained winds of 39 mph or more? It is practically unheard of. So climo comes into play here. It would have to be an exceptional event for such winds, but Isaias as a hurricane and going ET are not by all forecasts. This is not like Helene from 2 years ago. Just b/c something has a non-zero chance of occurring does not mean you explicitly mention it in a forecast. Once again, hedging and inflating reasonable risk. Wording matters as to how ppl will react, and then you get into the issue of things being cancelled and shutdown *way* too much for a run-of-the-mill event. Also, Isaias will no longer be a TC by the time ATL gets sig impact, and perhaps even TCL. so their wording is incorrect. They should be saying "gale force winds", not tropical storm conditions. This is a slippery slope. Almost every winter storm on the E Coast has winds of TS strength, but you do not call them tropical storm winds! They should be headlining a wind advisory or high wind warning, not mentioning tropical in this case for TCL and ATL.
-
I’m going to be providing OBS from Wright FL for the storm. I will provide them periodically as long as conditions/infrastructure allow me too. I saw this highlighted on X a bit ago and it gave me some pause…. .
-
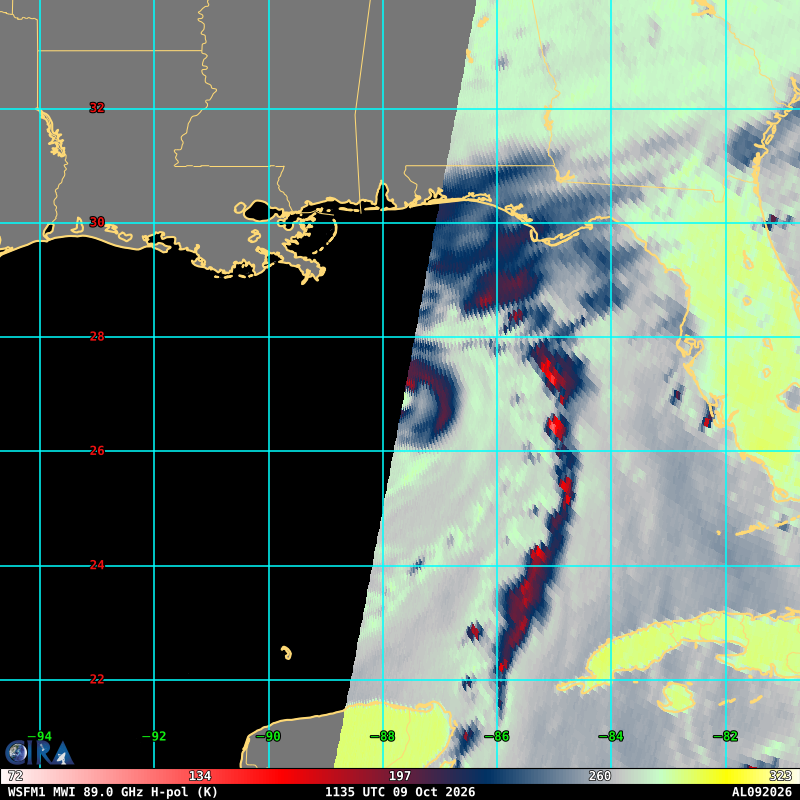
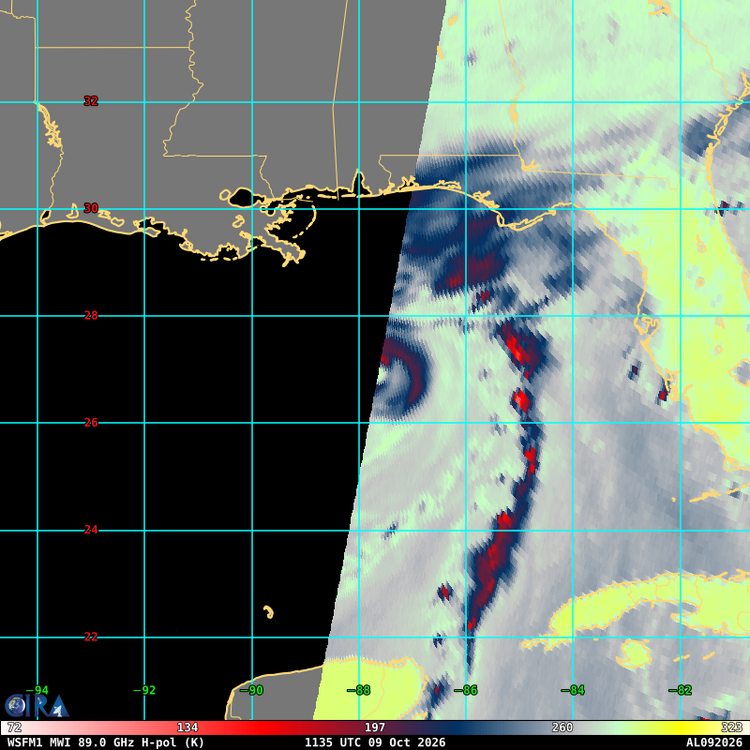
Latest satellite images shows the shear starting to affect the storm. Also the thunderstorms around the eyewall has collapsed.
-
Clouds now moving in
-
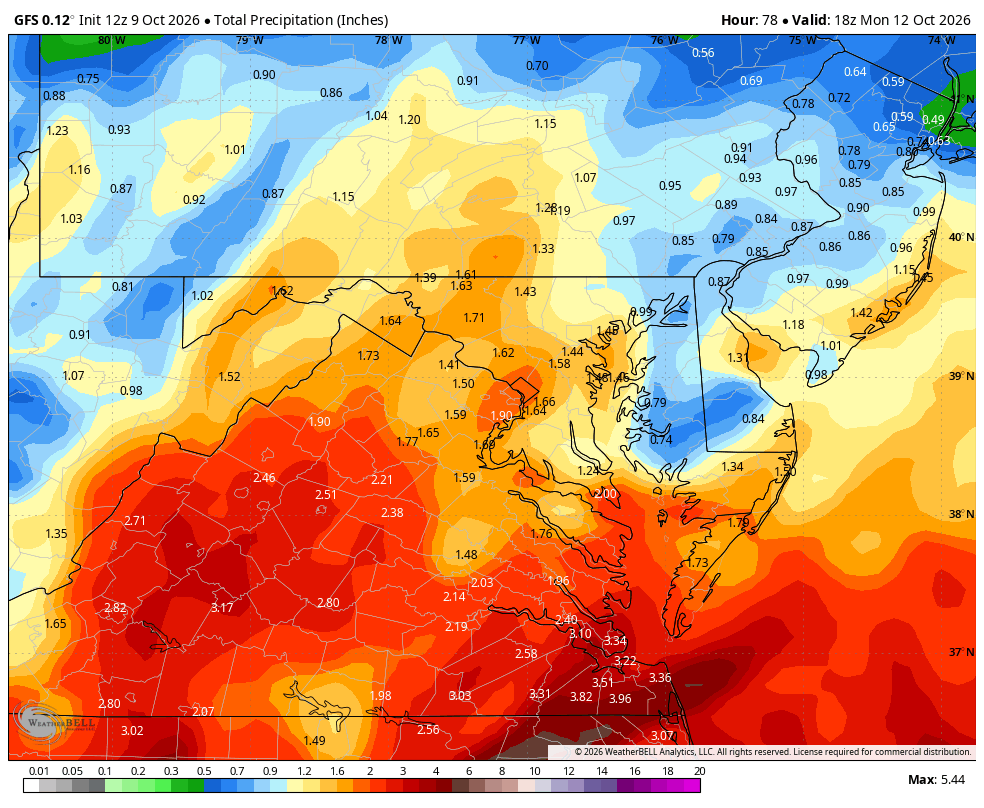
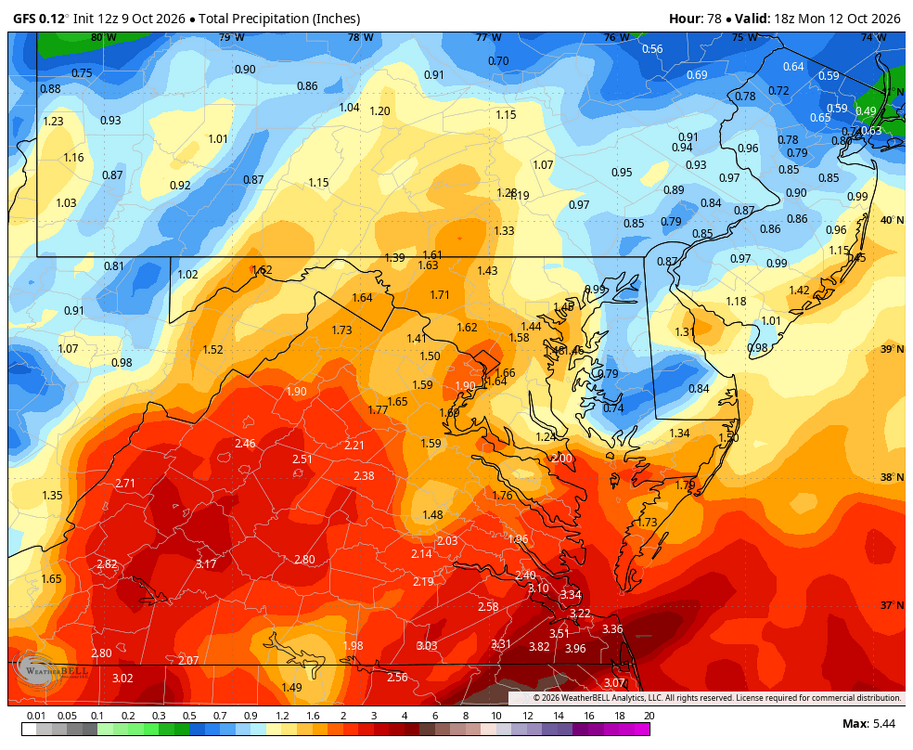
WB 12Z GFS
-
Thanks all. Tough cancelling it twice this fall, but it is what it is.