Typhoon Tip
-
Posts
44,541 -
Joined
-
Last visited
Content Type
Profiles
Blogs
Forums
American Weather
Media Demo
Store
Gallery
Everything posted by Typhoon Tip
-
It's all fun... but, we still have to be vigil of the notion that as that range gets closer in time, models are consummately having to tone it down wrt to these bigger looks.
-
Not to get into details this far out ... but, like others have probably surmised since you posted this ... that's sort of a 2007 Dec wall event there... Ends as freezing rain for an hour to glaze as a protective shield over a foot of pow-pow. I remember that happened in Dec... I think 2010 ? too - we had a forecast for 4-6" snow with a entry temp around 20 F ...and some +PP still lurking up N ... I'm goin' ...ah, ooh -hmm... yeeeeeeah... We had about 10" of 15:1 and when I was driving to work in 1/4 vis down a barren 495 wondering what in the f my company was thinking haulin' us in to work, the car's dash therm was 14! So it goes to pingers, then to silver rain that just looked super cooled - haha. It crusted maybe .15" glaze... But I remember when I got home that evening, shoveling out the walk, the snow under the glazing cap was still powder. Weird - That's how you define a SWFE ... warm air loses ...that's the ballgame
-
there's a few on that list ...
-
It does ... absolutely - so.. maybe it is its only predator for time - As the curvature tensor of space achieves perpendicularity time asymptotically LIM's to zero. And at that particular zero, it is not 0 in the numeral sense. It is zero as in an unfathomability absence. Hence why physicist say, for all intents and purposes whatever lurks there no longer exists in the natural universe - so nothing effectively does. That's really just ... elegantly disturbing "actually" - haha I have a hypothesis about time, space and gravity ... It's not a hypothesis, more like Science Fiction - but its that kind of plausible Sci -Fi. Not like "Star Wars" couched in as Science Fiction but isn't. That kind of cinema is beautiful art, but is pure fantasy. Anyway, imagine the firmament and everything of reality it contains combined, all of it, is really just a synergism produced by a Quantum Mechanical engine. Metaphor, the movie projector, vs the movie it conveys. The movie ( our frames of referencing ) cannot be used to describe the projector, absolutely. That is why General Theory of Relativity and the physics of Quantum Mechanics ...cannot be reconciled ( used to explain the other ). When the equations are intermingled and solved, you end up with no-no's like 1/ 0 = infinity at the point of singularities ...or at instant prior to the "Big Bang." These are extremes where the "frame" breaks down, and reality ceases to exist - just like the physicists intimate above. Well it does... because, that is like passing back through the lens of the Quantum Mechanical 'projector' into the machinery that produced the image .. where has nothing to do with why you love your soul mate ... or why your soul mates evades you. Much less, why one feels hunger or ambition, happy or sad... to why their are planets, stars, galaxies and super clusters of galaxies that when super computers attempt to three- dimensionally facsimilate, what they illustrate in imagery is startlingly indistinguishable from a very high resolution nuclear tomographical layouts of a brain's nuero-tapestry. Once your perception is inside the projector ... the image no longer exists there.
-
You know ... its true. For all our mutual commiseration about that great dearth decade of all time ( although I've heard the 1950s give it a run for the money ... ), that is one aspect about the 1980s that it did perform ... cryo bombs Man, there were some cold invasions that decade that would point tits in Hades ... When I was 10 ...I had a paper route in Kalamazoo Michigan. One Sunday morning, delivering the Gazette .. which of course was triple the weight, the air temperature was 0 F in a swirl of dense pixie pall and winds gusting to 35 mph. The sun dim orb losing to sound of soul being sucked outta one's f'n eyes it was brutal- ...I remember I was crying when I got home. On a nice day in June, the Sunday paper bag had to be set down ever five houses - it's a wonder kids didn't end up with Scoliosis luggin' that inhumane thing around. So imagine dragging that thing in that condition... omg! I think it was 1981 or something... '79 or '82 ... 1980 ... There was not a lot of big snows but we had some school delays for cold alone ... in an era where/when students did not ever get snow days for any reason, whether it snowed or not- Nowadays? ha - ...fuggin joke man with the pussification of kids and society.... Canceling school based upon forecasts ...granted, those have improved, but even so... 4-6" low grade winter storm warning - only cause the local forecast office isn't quite sure ... - and the tickers roll across the bottom of televisions and 'urgent' notifications force through to phone coverage and it's party tiiiiime! I think it's a culture of finding time off at least excuse imagined ... inside a cloak of safety requirements... but I'm a cynical bastard or fun w eeeeeee
-
I grew up with that era's cinema ... with all those icons of the silver screen strutting and fretting their turns and terms upon the stage ... now never heard forever more ... vanquished by predatory time. I'll tell ya, it's one of the weirdest paradoxes of nature, time's claim on all that resides beneath the firmament ... perhaps one day the firm' itself. For every prey, there is a predator ... and these tend to be in balance. For if either fails the whole system collapses ... Yin and yang I suppose. But time? Time seems to be the only metric in emergence of reality that truly does not require said balance - It only feeds..
-
egads ... invest in frozen futures i geuss
-
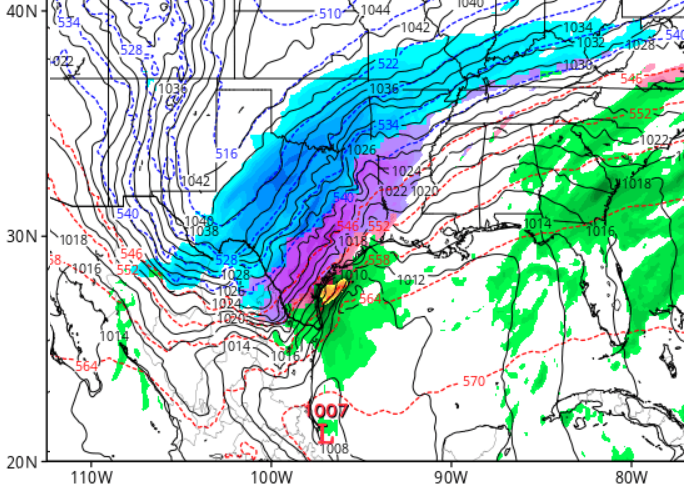
Does DuPage carry the 2-meter T's for this time ... ? Just curious cause the cold in that synopsis is - obviously .. - steeply sloped left in the sounding. I.e., it's probably colder than those contours/ .. perhaps neutral to the surface, in that advection region ..all the way down. I wonder if Brownsville could actually be flirting with 32 there ...
-
Didn't Will say he lived in Texas back then ?
-
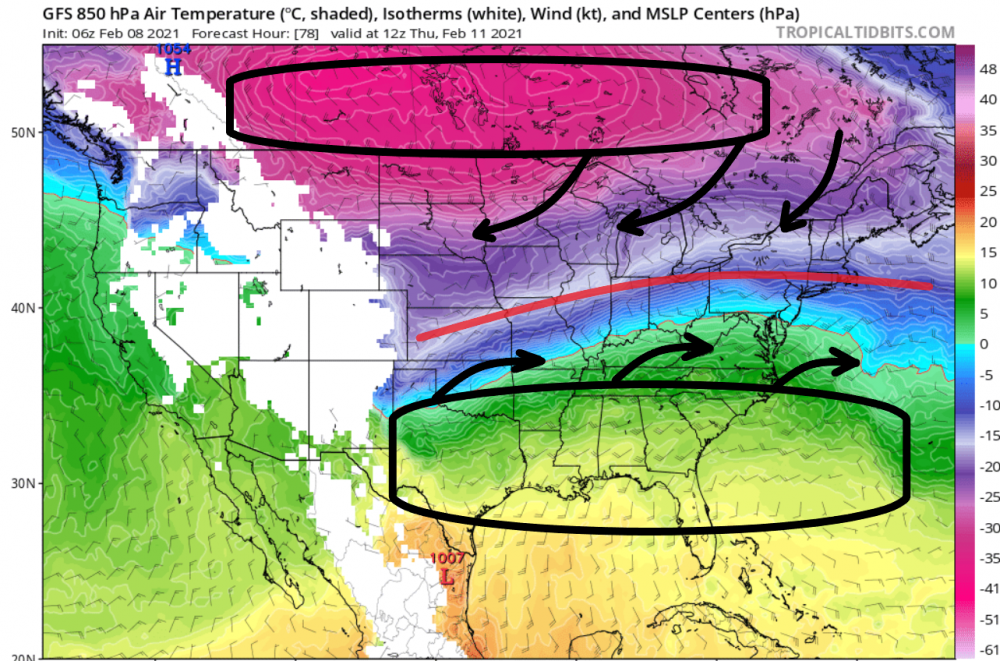
And "as is" - always a risk ... - the operational GFS takes that mess into an Eastern Lakes as bully-primary... but the layout of the PP up over Ontario/ antecedent air mass in New England would argue that is - ironically - a major glazer here after the perfunctory snow to start type of climo thing - I would also still caution modeling 'over assessment' as an on-going contamination to performance -related issue with all guidance. I don't trust big heavy sprawling systems in that post 120 hour frames to actually succeed because of the punishing failures to actually do so ...doesn't lend much confidence - to put it drolly..
-
Take a moment to appreciate glazing at Brownsville Texas ? This has been a recurrent signal in the GFS runs ... this is actually the most striking it has been depicted, 120 hours from now .. the next frame after this as some mix that far that - ...that's pretty rare
-
I dunno, I think it snowed guys. Good lord with this neurotic nitpicking - it's now worse in lieu of some other style of delivery? LOL at the inconsolability ... - it snowed! I know ...I know... it wasn't evocative of enough excitement The 16th/17th is interesting ... Firstly, in the interest of fairness, the converging teleconnector signal appears to be failing to produce a correction event. In my defense, I did suggest the end point may extend out a bit longer. I mean, it's not like there are temporal boundaries on atmospheric events ...and being that far out there, who knows - That said, the 16/17 time range materializes from entirely different pattern morphology so ...I think in honesty it stands apart (causally...) It does not appear really at all by then to be related to the rising PNA, relaxing west-limb -NAO stuff. - these intervals are not always realized.. I know why in this case - strongly suspect I do ... The GGEM ( not a good model to me but just to make the case...), nicely shows the western end of the SPV failing to come down and capture/connect with the physical wave propagation of the intermediate stream out there later in the mid range. The culprit really appears to be wave propagation speeds .. The x-coordinate wave translation speed in the S, is too progressive ( fast ) wrt to the y-coordinate of the N (SPV) ... Thus it is not given enough time to move through the subsume process - meaning the S stream is outpacing the N/ streams ability to do so... So, we pass through that vulnerable period with shearing problems is what it really all boils down to.. But letting that go... the ~ 16th event's wave space/ mechanics are pure Pacific. As of the 00z's initialization ... said wave space's best discernible position in space is actual over the Sea of Japan!! It's that far ...yes, more literally than figuratively .... around the other side of the planet. And, is also all situated in the middle latitudes as a relay off the Asian continent. That feature is embedded in a tremendous accelerating wind tube along the underside of a very strong WPO vortex as it goes through some flexing ... moving forward in the modeling... and it squirts some 72 hours later near the Date Line... From there..it careens on nearly a flat flow trajectory through California by 120 hours... and 24 to 48 hrs later... "might" if it even exists, throw party up our way... Some cons ( you should be laughing a little at this point ...) : Flat progressive predictability is a bit of an oxymoron ... red flag. All season long, extended range and even many mid range systems are tending to mute as they get near in time. Lastly but surely not all .. .the hemispheric fast flow doesn't really promote curved trajectories in general ...so that does not lend to this thing, either. The pro is this is climo bomb time. The N stream does appear to relax... so, it is - speculative - possible the flow "decompresses" along the mid latitude heights more so than the model ar presently showing ... and that would emerge a better environment for purer Pacific waves to not be mooshed by the elephants ass of the N...
-
Clockwork dependable ... 14th muted as its relaying in from the extended
-
phew... right - no worries than .. lol - dates? don't come at me with human convention - I only have time for the Cosmos... Seriously though, I am actually flirting with the notion that things could break harder toward warm and pretty early this year. But we'll enjoy this month while it lasts. Not sure what your level of background is in this shit, but ... La Nina springs tend to be warmer. Also, the fast flow? That's the compression of the hemispheric winter heights against the 3-6 dm expanded HC that is not me ...it is scientifically and peer review vetted - I'm trying futilely to get people's eyes to stop rolling about the tropical expansion stuff, I know.. Anyway, both the LN and the HC are constructive interference ... So, when the -AO business and blocking stuff wanes out to neutral exerters ...those other two are sort of left in carte blanche as proxy over the general circulation eddy ... Just supposition
-
I bet not big ... Without a phased solution ... these are likely to come into a coherency range as minoring out - I've mentioned this a bunch of times ... that models have all over amplified solutions D6 + as a standard M.O. It's like the moon rise - as it is nosing up over the eastern horizon .. optical bending of the light by the atmosphere makes it look like it's actually a count-down to a doom's day collision of worlds. But ... couple hours later its about the diameter of one's thumbnail as usual... Only in this metaphor the models bring systems into their horizon of distant view as big events - Anyway, ... I think it is a trade off... We miss phasing because the flow is too fast ... but that may tend events to be held to moderate in check ... Big events on the model horizons end up like the last with lollypop 10" ers ... while maintenance ones are like today or fropas. Hell, the system on the 8th was historic panic bomb on the Euro when it, too, was 8 days ... same shit - GFS' been doin' it too Course... two weeks from now it's spring - ... that ought chap some bums.. No but bombs can happen in fast flows ...just sayn' in general
-
Not that you asked... but the 14th appears slated to steal the show ... it's massive. And may sweep dynamics out post its governing mechanics moving on... It's got a multi teleconnector converging signal on the OV/NE regions ... and has for days and days, but there are limitations to structure. Models have been struggling with the momentum/fast hemisphere ... Their handling is detrimental to the delicate timing involved with harmonic wave interference. We've been seeing a lot of what look more like WAA blown-open lows as a result. Anyway, the 14th (GGEM for example ... or pick a recent GFS run - haven't seen the 12z just yet ) gets it done with a big busted ravioli too ...really more of a split open phase because of the stream bi- pass that resulting from too much fast flow. But it may sweep all dynamics out when it leaves ...and then the 17th may need a pattern change away from N-stream ( 14th ...) to more purer S / stream to get a another system done. There are some hints of a more of a ENSO jet punching E when the SPV's leave southern Canada ...hell, maybe that's an attempt -
-
This 'critter' is signaled to flash up in intensity as it exits - Am aware some higher res. short lead models vacate on that thinking some, but I'm not sure the non-hydrostatic nature of those physics are really seeing a synoptic ...albeit subtle WAA pulse potential from the integrated flow - those sort of models are better for meso shit. The problem also is that we are presently trying to saturate a 23 F / 15 F -type temp/ dp spread here between the Pike and Rt poop ... and since this has virtually no way/means to remove that slab of arctic density ... we're probably maximizing the WB effects and will have an event temp around 20 de-popsicle headache F, which means ... backyard ratios are probably > even 15:1 ... .3" ends up being close to 6" ...etc..etc.. stack height. I'm sure others have mentioned these event idiosyncrasies - ... but adding to all that, if it flares even a little like some of the QPF products indicate, this thing bootlegs to a warning - ...unfortunately, there is possibility that does not happen - yup. But, this strikes me as a limitation ( sort of ..) with the state of the art of the technology. It's an amazing spectrum of utilities compared to 30 years ago .. but despite any conceits, they still do not offer a line of sight that discretely - or discrete enough. So... it is what it is... and it's two systems back-to-back where they have to gotta kinda issue because they are handcuffed to notifying the public anyway
-
Me too ...sort of - things is, I don't base this on previous poor spring/warmth repeater years - ... easy to assume based upon recent persistence. Our return rate on "feeling" warm in spring is 1 in 10... actually, maybe 1 in 3... 2/3rds of the time you sail away to foreign soils and forget this god forsaken useless cold anal hole even exists... You guys may love your winters here - but you pay or it through early June sometimes with this BD up the butt climate ... You couldn't get a f'n Svalbard native to opt to come here in April - This "could" be a year where the rarer warm manifesting later in March. When? My thinking in summary is that the SSW/-AO happened earlier in the winter ( early Jan..) as opposed to other years in the data - when they occur in Feb...your bruised bums until July... But the earlier onset/gestation rate gives it a chance to extinguish .. prior to getting too deep into the transition season, such as years when they occurred and modulated the AO later on.. Those years you end up bum bruised until July - .. heh But, the La Nina springs tend to be warm. HC expansion is a constructive foot-print in the hemisphere.. Maybe ..just maybe the two synergize a warm spring and ... maybe a some big June and early July heat waves..
-
Too bad we can't get the Pacific to cooperate - I mean, ..yes the GEFs and to some lesser extent the EPS show rising PNA ... but it's not appearing - thus far - to be substantial and/or teleconnecting very well to raising heights over the western aspect of the continent. That's really needed ... or there'll be some wasted potential - even the EPS nicely dislodges that SPV but ... no western ridge, no S/ stream ejecta, it doesn't come down. We are still seeing some interesting coastal responses but that handling is settling for a field goal on 70 punt return because of a block in the back - By the way ( somewhat unrelated matter...) but, you can really feel the warmth of the sun's return. The perennial solar min, which begins Nov 8 at 45 N, ends today - so probably more like yesterday when it was snowing ( lol ) at 42 N ..etc.. - No, it's not exactly re-sequencing epidermal DNA into precancerous dark spots just yet, but it's definitely flipping the radiation script.
-
I posted some annotated visual, learning material over the last few days regarding the 11-15th .. 17th period of time if anyone's interested. The gist of which was: -- multi source teleconnector fields targeting the OV-West Atlantic for correction event(s). Those being a decay-rate -NAO ( west limb block/ rising...) and a rising PNA.. These intervals tend to occur in tandem with larger hemispheric footed events - not always... but usually so. -- circumstantially ... there is/are SPV circumvallate with embedded nodes set up and pearled out across S Canada, ...dangling perilously in wait. Just needs the following to phase, -- in motion; the west limb of the NAO block may begin to decay ..and when that happens, it tends to exert S - probably the hemisphere et all that is really in motion, but it gives that allusion. As that exertion sets up ... we just need a well timed, better western +PNAP ridge expression ...which having the rising PNA helps that ... The Euro got close on the 12z run yesterday ... but the 00z ... eyigh ... Now, the GFS tries... So Will's right - it's bouncin' around.. Handed off between guidance like a hot potato. The flow is both fast, and entering a modal field change ...which is like taking normal uncertainty then, adding both those two factors to it.
-
Yeah...I've been thinking this synopsis might over-achieve in getting that to happen, because the ambient frontogenicity ( thermal packing ...blah blah ) ...well, the front has steepness to it, so any draw up that slope is going to be efficient even if weak, in squeezing out growth
-
so ...what are we lookin' at Will ... advisory? low end warn' ?? ... my guess is right now we are on the borderline between "special weather statement" should cover, vs Advisory... pending the Euro... Didn't see the Euro QPF but the 00z was reasonably well cyclonically formed upon exist so - it's got that goin' for it.
-
Welp ... ended up with exactly 4" of 15:1 ...maybe 20:1 ...I dunno.. but it was stack happy fun yesterdy. Visibility not really much below 3/4 of mile here in Ayer ... which prolly belongs in the ob thread but who's reading anyway... With that I set at 45" on the season - ... Figure 3.3" tomorrow... Then, 2.9" on Thursday ... then 5.4" on Saturday ... at which time, there is a fomenting blizzard threatening to miss Oh too far SE ... to fill the persecution drug cycle prescription ... we will be right on my way toward an above normal snow year have succeeded during the worst winter ever experienced - truly amazing.
-
Y'allz ability to disconnect from rationalism and apparent understanding, and still allow a single guidance depiction evoke "dashing" of anything ... is really rather remarkable - lol...
-
Not sure what NAM biases are for this sort of synoptic evolution. In past diatribes ...I have futilely attempted to encourage folks simmer down, and to consume 72 hour NAM with an extra dose of incredulity, when it comes to fuzzy deep navy blue or even magenta snow-QPF off its west Atlantic/ .. near EC cyclogenesis and track guidance. It just did it on this list gig frankly - ... post after post after posts strung together explaining how 'it could actually score a coup this time.' Lol .. No but this is not a west Atlantic cyclo - babble low. Nor is it a relay through the outer short range/ .. mid range temporal seam. Last night I was intrigued - a little ..I say that in the relative sense - by this critter because it is riding along what I see as a rather enhanced baroclinic region associated with the mean polar boundary. Right now ( and modeled throughout the week ...) the vagaries of the winds et al have managed to draped some rather breath-taking cold, astride the Canadian side of the U.S. border... As these 'little critters' zip along ...they subsequently probe plumes of that air mass down; these then mix into and homogenize the air mass quite cold within the mean E. low level wind trading around the underside of the attending polar highs up there ( synoptically suggested in this abv annotation... ) As these ripplet jet maxes that seem innocuous ( and really are in lesser circumstances ) ... zip along, they have enough momentum discontinuity to trigger some restoring inflow lift. But, because it is flowing into a rather upright ( tendency..) of the elevated frontal slope (think of it like a cold wall as opposed gentler slope), that will maximize psuedo adiabatic instability popsicle headache. Particularly in the 850 to 700 mb sigma depth. It'll come down to where the SGZ heights situated in the passage ...but ( 1994 ) and other historical examples show that almost non-discerned jet accelerations along these sort of thermally compressed frontal interfaces like you see above - which sets up for tomorrow and also persists through next weekend if you believe the general handling... - have a way of delivering goodies. It all means these little guys may over-produce. Over-produce doesn't me 38.7" of snow... it means, there's a like ...I dunno, say 30% top side that's negotiable and probably not really able to be forecast - almost synergistic, via maximizing one or two kinematic process among of a stew of minor events that by weight ... sort of hide them. ( This whole song and dance may play out again later Thursday ... then again later Saturday - this sort of nickel repetition has been pretty persistently in the models, too. ) In summary: this doesn't say where this "maximizes" .. . it just elucidates the enhanced potential/ .. native instabilities that are in place and fertility for event success. I wasn't surprised when I saw some of the overnights start double .2" liq equiv to .4 or even .5" ... Whether this comes N or S along that axis - I yeah good luck... Probably the IBM cluster LOL