Typhoon Tip
-
Posts
44,869 -
Joined
-
Last visited
Content Type
Profiles
Blogs
Forums
American Weather
Media Demo
Store
Gallery
Everything posted by Typhoon Tip
-
2026-2027 Record-breaking El Nino
Typhoon Tip replied to Stormchaserchuck1's topic in Weather Forecasting and Discussion
So I'd be careful with the QBO in correlations. This actually happened first back in - I think ...- it was 2016, where the QBO abruptly and mysteriously halted ( in the relative sense... It even reversed for a time, mid cycle - something that had never been seen at that magnitude, if ever. It prompted me to check and sure enough, there's been publication as to the QBO as ( possibly ...) now also being affected by CC. Yes, even this is not unaffected. The study is “The disappearing quasi-biennial oscillation under sustained global warming,” by Fuhai Luo and colleagues, published in Nature Communications. Jan 29 earlier this year. It indeed describes the QBO as experiencing unusual disruptions in recent years. The idea here is that if it is doing this sort of "break down" ... that should enter the question as to how physically it is coupled with the total system - if so ... naturally and quite arithmetically the correlation goes with it. Just sayn' -
2026-2027 Record-breaking El Nino
Typhoon Tip replied to Stormchaserchuck1's topic in Weather Forecasting and Discussion
I don't disagree with your reasoning here and product issuance and so forth.. I would only add that the base-climate is very steep since 1997. That does sort of tilt matters from being straight up clearly attributable to ENSO. ...in terms of temperature departures down the SE ... Seasonality should also be considered - The SE could easily have fared warmer than 1997 in the absence of these warm ENSO autumns. I also have some reservation about attributes with ENSO prior to the gradient of the hemisphere drawing the El Nino into the fight. Having said that, if there's some primitive influence that's even subtle, yeah I mean there could be some synergy there that would not likely be very readily noticeable. -
2026-2027 Record-breaking El Nino
Typhoon Tip replied to Stormchaserchuck1's topic in Weather Forecasting and Discussion
You know notice I am not suggesting or saying at all, that it won't be advantageous to pattern orientation ( depending on what one wants - ) ? I'm not sure it makes a difference. That's why I said 'straw man' above. Not sure anyone's really arguing. I just don't like the untrue application/attribution thing, and I read/heard a bunch of it from 'social media celebrities' Either correlates to a favorable pattern. Think getting there via different wholesale means. I would "possssibly" argue that the bottom-->up variety is more conducive to NE Pacific heights ...but you can see how therein in drives almost no difference for the N/A continent. Contrasting, the -AO forcing from a SSW full cycle forcing has it's own variability. In 2006-2007, for example there was a very impressive SSW museum piece event, Yet, the incredible balmy historic warmth ongoing across the N/A mid latitudes actually persisted for 2 weeks longer - really - than it should have. The blocking and cold unloaded over in Russia/Siberia first, because the planetary wave # was destructively interfering the genesis of cold conveyor over on our side of the hemisphere. That changed of course...we end up with some winter in February that year... Point being, these correlators for bringing cold into mid latitudes are not single sourced, as well, can vary in and of themselves.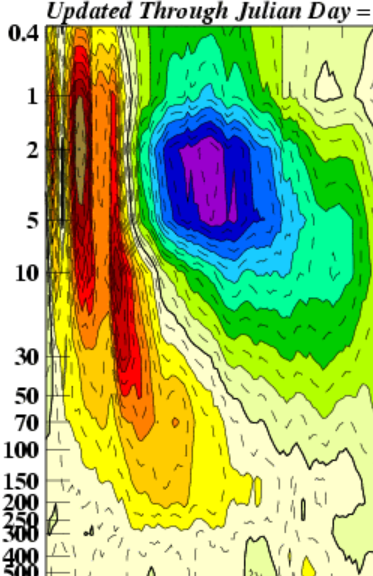
-
2026-2027 Record-breaking El Nino
Typhoon Tip replied to Stormchaserchuck1's topic in Weather Forecasting and Discussion
I realize you're just talking/rhetoric here but ... there's a non-zero order probability that when the +ENSO is finally "pattern forcing" ...what emerges is shock-and-awe. Or not ... just sayn' -
2026-2027 Record-breaking El Nino
Typhoon Tip replied to Stormchaserchuck1's topic in Weather Forecasting and Discussion
yeah I'm not attempting to 'take credit' don't give a shit. It's probably obvious to most anyway ... it was a question that popped into head back in summer actually ha. when it was 89 F -
2026-2027 Record-breaking El Nino
Typhoon Tip replied to Stormchaserchuck1's topic in Weather Forecasting and Discussion
There is no SSW modeled from what I'm seeing anyway ... Just pointing that out for the straw man if no one's betting. General readers: This exact same aspect took place over the last three consecutive latter autumns - the tropopausal heights over the N arc of the oceanic-atmospheric coupled "thermal bulge", lifted in altitude and introduced a warm anomaly between 50 and 150 hPa altitudes. This then terminates higher into the PV near the top 10 ... 5 hPa levels registering/forcing a faux split, because there is residual warmth that does get that high. But, that is bottom --> up phenomenon. SSWs are intrusions that begin above 30 hPa, and often pulse for a week before the main plume arrives -first- at the very high altitude. Then, given time, it descends in altitude... usually taking ~ 2 weeks to make that journey... As it lowers, it stabilizes the AO domain - this rises eights in the 500 to 200 hPa levels, a.k.a. blocking Now... there's definitely some lop over in physical characteristic and behaviors. It's not an all or not ... Some warm intrusions may then in turn downward propagate after the fact. Or, the bottom --> up could be in tandem with the other, making it suggestive in both direction, and difficult to parse out attribution. By and large, a text book SSW looks like this though, which I've annotated... Notable -AO correlation toward the end of January (~20 days past the onset of the total event) was extreme, and carried over into February that year.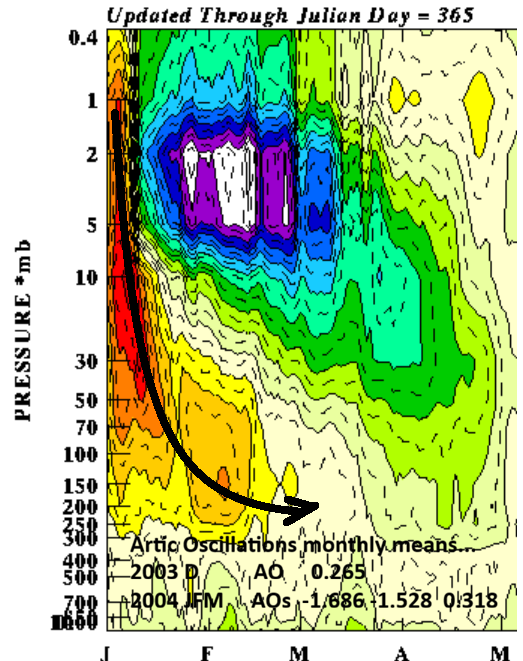
-
2026-2027 Record-breaking El Nino
Typhoon Tip replied to Stormchaserchuck1's topic in Weather Forecasting and Discussion
One aspect I've been coveting that has me deeply concerned for the state of public mental health/America Forum winter zealotry ( eh hm), is a notion that I haven't heard any one or source mention. Speculatively: the STJ may end up N of the climatological normal latitudes - as a mean ... For the general reader ... try to be nuanced aware and open idiosyncratic minded about how nature actually works for a minute here. We're talking about integrating behaviors, an integral that will end up containing examples both subtle and gross. It may not be overly obvious at all times... Sometimes yes, other times no. But in that integrated mean, could suggest a "lean" on the polar side of canonical. Events tend to go left (say). Warm penetration events a bit more robust than mid range model means - I suspect AI sources, which don't bear any compunctions ( haha ) would be unabashed. Something like that is already tantalizingly suggestive in the current Euro-AI version matter of fact... As an aside, something I'm noticing about AI so far in it's techno-infancy ... it seems to be on the amplified lean of all possibilities when looking at specifics. If whatever aspect is driving the -PDO continues, I still personally believe that needs to persist. That "tension" may be our best hope for that population of d-drippers, lest the manic state drives them to voting self-destructively for the wrong people. haha. No but (CC base +historic positive ENSO)/2) doesn't otherwise intuitively feel hopeful if operating on the hemisphere alone. -
2026-2027 Record-breaking El Nino
Typhoon Tip replied to Stormchaserchuck1's topic in Weather Forecasting and Discussion
Fwiprobablynotworth ... this ACME road-runner show quality graphic over at CPC seems to suggest there's a secondary +anomaly node ( if not primary...) situated around the 3.4 ... interestingly trying to connect to the marine heat wave going on around San Diego ... The nearby coastal cooling astride El Salvador - I suspect - is an artifact of the enhanced TC trafficking over the last 1.5 months running up just W of that area and imposing offshore SS stressing ..speculation.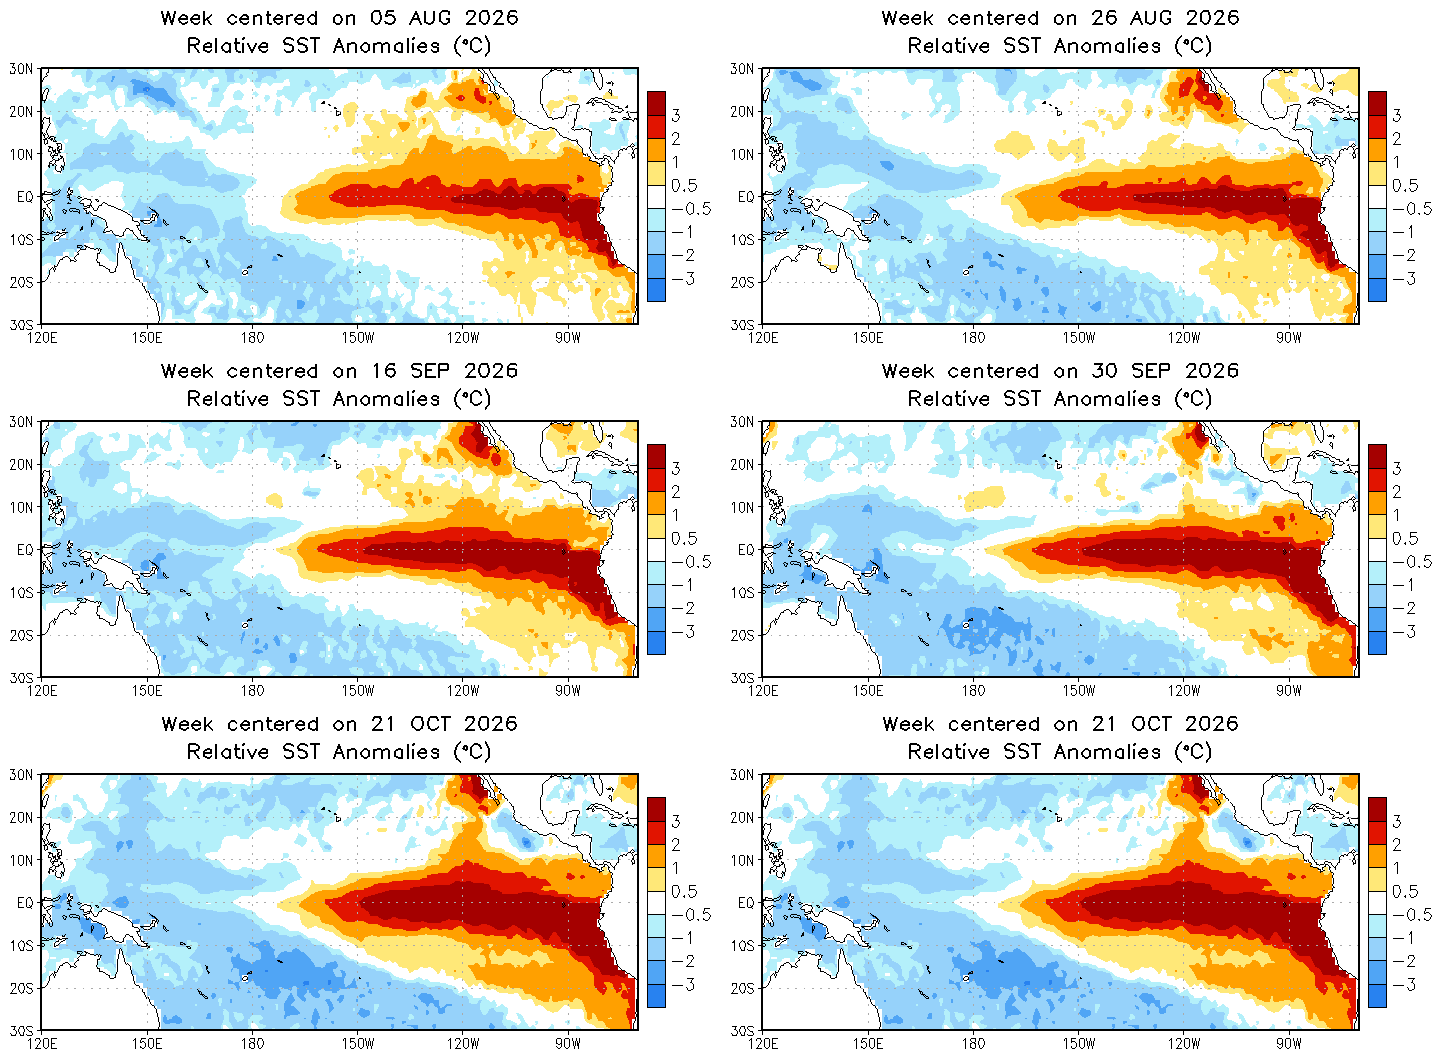
-
watch us segue from this into a 46/33 mist winter hosting three historic all-time bombs at different times ...all cutters ... wah wah waaaa
-
Yesterday boasted the grandest diurnal change I've seen 'round deez parts... 44 to 46 F swing was common within 10 miles of my location, both home stations and tweener NWS sites. [EDIT, 38-43 ...helps when you're not looking at WC columns. still impressive] Today may exceed that differential where has this cold drain phenomenon occurred.
-
It's remarkable ... the autumn of the great unbalanced RAD proficiency continues. It's 48 at ORH ap, 28 here... Granted that's 800' of difference but 20F is about as extreme a still morning difference/RAD result as I've ever seen.
-
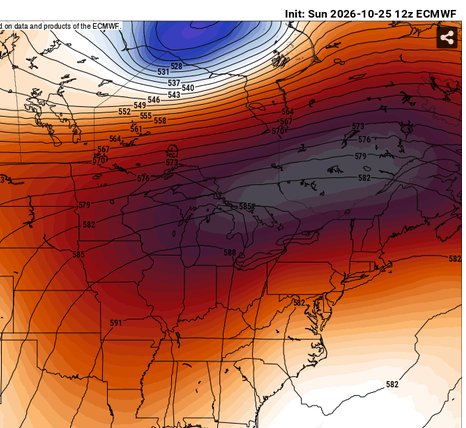
Ha! well I'm not part of that fake stuff. Temperature is temperature... I'm more focusing in on the unusual nature in which we're getting a sensible autumn out of a deep summer sky - to put it somewhat poetically. This morning the hgts are/were 582 dm ... 27 at the surface. It's been happening a lot since late summer, too. Maybe not that extreme but it's been unbalanced on the whole. If that's coincident with some discussion point than it's unintended.
-
Too early/prerequisite challenged ... but indian summer like. The trick will be, 'does the anticyclone get under our latitude?' Since mid to late August actually, these powerhouse high pressure nodes have been moving either bodily overhead of E thru Ontario, placing us persistently in a highly uncoupled lower troposphere relative to mid level soundings. We've been getting frost if not freezes under 576 dm heights - anomalous combination of metrics. Very much so... We've had hyper proficient RAD events as of late, which is an interesting met phenomenon probably under the nose of most people's awareness. It feels like we're getting a normal autumn progression - though with modest positive biases, but it's kind of been lying? so to speak. 27 F under while this; is just another example in many
-
We just went through this last year, and the year before in the late autumn early winter. Just wanna make it clear, these early PV irregularities are are not related to SSW events.
-
2026-2027 Record-breaking El Nino
Typhoon Tip replied to Stormchaserchuck1's topic in Weather Forecasting and Discussion
Not speaking for anyone in particular but ... I 'sense' the posts are implicitly dancing around an ominous look/portents for winter. -
I'm sensing an increasing privatization of general weather mappage is becoming more and more problematic to general usership. Pay-up or no forecast graphics for you. The NWS doesn't really provide graphics worth a shit ... I mean, we don't need or really ask for all the bells and whistles, either. Hell, I'd take 2-meter temp progs in black and white numerology, and the old black and white difax charts. Give me those and telecon and I'd smoke the industry The FOUS/NAM is going away ... I don't know of any source that provides raw modeled grid/altitude numbers. They may be out there but the web these days is too cryptic and hard to find anything. Us "meteorologists" prefer grids some times. These strings of numbers like this random ex for the mid atlantic, TTPTTR1R2R3 VVVLI PSDDFF HHT1T3T5 DFW//969272 03902 121110 65151409 06089979167 06500 121803 64161408 12020936119 -0602 113411 60151207 18000925106 -3605 183119 50110704 24000906705 -4806 193116 47090600 30000622206 -4114 223213 52100603 36000501320 -2316 193009 59120806 create a mental picture that to the educated is often way more correct than some X'er pimped out chart, or PIVOTAL this or Weatherbell that... anyway. But society can't seem to function at all without passing their next breath through the filter of capitalistic ambition and money aspirations... Please, bring humanity a corrective comet! It's like the only working "comet" we have, is CC, but it's only making it worse because storms and event ferocity are now a fad, so graphical enterprises are getting greed wet dreams. Combining that with the collapse of government .. it's all creating an exclusionary kind of access. I think it's a matter of time before PIVOTAL, and Tropical Tiddly winks or Golden Gate ... start asking for cash for any of it. I can't wait until I bring my storm generator on line and turn on the lightning bolt targeting system. ha
-
2026-2027 Record-breaking El Nino
Typhoon Tip replied to Stormchaserchuck1's topic in Weather Forecasting and Discussion
no one's asked me buuut, personally, confidence in any seasonal modeling is lower than even the usual eye-rolling when the model being use has "climate" baked into it's title and/or physical make-up. -
Ah... well, if he's gotten it accepted by whatever peer reviewal process is required for operational/official usage than it is what it is... but who knows - Personally I have a handful indexes that are Johnisms haha
-
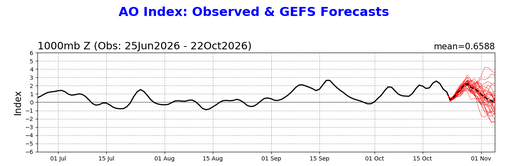
"Snow Advance Index" ...interesting... never heard of that particular index. Is that his? - guess I'll look it up If it exists it'll be interesting to know what goes into it. Like is it 2ndarily based upon the AO ... +AO is the cold index state in the Arctic domain... whereas the negative phase is actually warm at high latitudes. I've long suspected this season may observe an aggressive recovery take place at some point along the way... perhaps both land snow and sea ice for that matter ... The AO has been demonstratively positive really since the end of summer. Meanwhile, the ongoing prognostics from CPC keep correcting outlooks positive so ...it appears to be a really basal/systemic aspect and not just a ephemeral mode tendency... Having said all that... I think there's been papered work published in recency that upended the Siberian snow cover assumption - perhaps not entirely but lowers confidence in using that metric as a predictor. I'll have to see if that's true still. It was originally studied that cold/cryospheric genesis, aids in colder lower troposphere, which then lowers heights - and that raises hgt at mid levels due to restoring in the total column. That
-
2026-2027 Record-breaking El Nino
Typhoon Tip replied to Stormchaserchuck1's topic in Weather Forecasting and Discussion
my opinion is that the +IOD and the +ENSO are all a part of the same super structure, exposed by observing the totality of the Walker construct. - whether aware or not... when evaluating either we are just in a quadrature (tranche) of that whole structure. The DVM tendencies over the eastern limb ( ^ ) of the +IOD mode is actually the western limb of the DVM associated with the Pacific Walker circulation. and so forth... The reason I see that distinction as important is because ... particularly in this incredibly wholesale immense +ENSO planetary state, there's likely to be less ability for permutations in the IOD domain to really mean anything because that region is subsumed by the whole/thus indicative of that larger magnitude. I don't think it is adding or "boosting" in this case...? Given to the above totality, it's already integrated already added in/accounting for in other words. But it does offer an intriguing idea after the fact ... that integration may create secondary feedbacks (synergistic amplitudes in either positive or negative direction). -
.. there's historic data that suggests warm ENSO autumns frame cyclonic tendency in that region along and off the middle Atlantic. This year really hitting that with panache. There really wasn't much of an input in terms of arriving S/W mechanics into that region leading into that thing. There was only weak sauce arrival prior to the one at the end of September, either ... that made major media outlets millions on pimped out headlines... My hypothesis is that it is the CAG climo repositioning up and off the eastern seaboard - 'CAG' referring to the Central American Gyre... It's a general region of cyclonic tendencies that formulates in late summers and throughout autumns, situated as the naming suggests... around the western Caribbean/adjacent. Anyway, this is a source of 'home grown' TCs in the October climatology for west Atlantic Basin activity. Fronts or frontal echoes decaying through the Gulf can also formulate 'book end' spins but ... overlapping general vorticity potential in the area is an overall culture jelly. The CAG is there because of overall large scale Coriolis balancing underneath autumn high pressure settling through the TX. My hunch is that the large hemispheric circulation mode/manifold, indirectly related to the warm ENSO, favors this more off the EC than down there in typology. We have a high pressure seemingly eternally lodged and incapable of settling S of us - see current sfc analysis' - which has been there for days. When it breaks down... no worries. Another dying cool boundary wafts silently trough, and reinvigorates the high pressure all over again... and this is causing a standard weakness over/off the M/A just like the CAG machinery. interesting...
-
2026-2027 Record-breaking El Nino
Typhoon Tip replied to Stormchaserchuck1's topic in Weather Forecasting and Discussion
agreed... I mean probably - Here's the thing ( though ) ENSO may not be effective in the hemispheric pattern modulation until the seasonal gradient steepens enough to trigger that forcing. I've explained this in the past ...whether necessary to do so or not ( hey, that's how I roll! ), that it's not enough merely having these teleconnectors on the map. They need to be effective, more importantly ...how to know when/if that is the case. The way they become effecting is through gradient. That is the metric that decides. It goes back to fundamental physics. IF A > B, A --> B That's how all nature works. Period. If that one fundamental universal aspect were not always the case in the cosmological perpetuity and infinity there would be no restoring force anywhere, and everything would stop. A must be greater than B, in order for that action of A on B to take place. So why that is important here. The amount of A had to be significant (enough) bigger than B (gradient) before the "-->" starts happening. Synergy explodes out of "-->" This, to the clever reader, is why RONI is both very necessary and works. Because B is climate change and it is a +D(B) factor. So.. the A growth has to grow even more to trigger the same "-->" Can't be explained any easier... This ENSO is certainly a warm pig, but .. the world is a bigger warm hog right now. So, as eye-popping as this El Nino is, it is not entirely clear that it is operating/forcing on the system yet due to this over all arithmetic. And so if it is not yet doing so, there is no synergy. The synergy would be later on when seasonal/hemispheric gradient gets sufficient and ubiquitous. -
2026-2027 Record-breaking El Nino
Typhoon Tip replied to Stormchaserchuck1's topic in Weather Forecasting and Discussion
yup ... ... There's a synergistic potential there, too - adding a third, the -PDO hangover ... whereby three dominate modes, working together, produce more impact than scalar sum of their input. What makes that trickier than the typical unknown quotient of synergistic result, is that one of these modes is new, and "newing" - in other words, a changing input. It really takes the unknowable synergy, and makes it extra double top secret unknowable. Ha It's tough tho... Folks need to philosophically understand that "more impact" does not mean more scalar amplitude. It can... but impact in the context of ENSO pertains to 'how much does it force the system' - and by that, deviates it from a non-ENSO base. A base that now is D(CC) ... see where this is going? I mean it doesn't mean higher wind gusts and deeper floods, nor satisfying one's snow lusts .. A valid interpretation of these can simply mean more pervasive ...lasting longer ..etc. If NYC go 120" of snow this winter and never snowed more than 8" in a single dose, that would/could likely be a synergistic improvement on just having an El Nino, or CC working alone with a -PDO hangover. 8" is actually manageable. Or... it could mean two consecutive yard-stick bombs totaling a National Guard deployment, sure. Part of the problem for those setting up expectations off El Nino dividends, or subtractions, either way, is that El Nino is not a weather forecast. ...obviously there are those of us that are aware of that but you'd be surprised... heh -
Incredible temperature variance due to cold drainage this particular morning... Cold drain and uneven distribution by dawn isn't in and of itself very unusual, but varying 20 F over short distances, is. It is occurring among a lot of the non-standard NWS sites in the interior. ORH was 43 for a low, now 52... Same in Sterling and N. FIT ... yet, it's 31F at the Oxbow site along Rt 2... Interesting Some of these chillier sites are likely to see a 20 to 25 F bounce this morning.
-
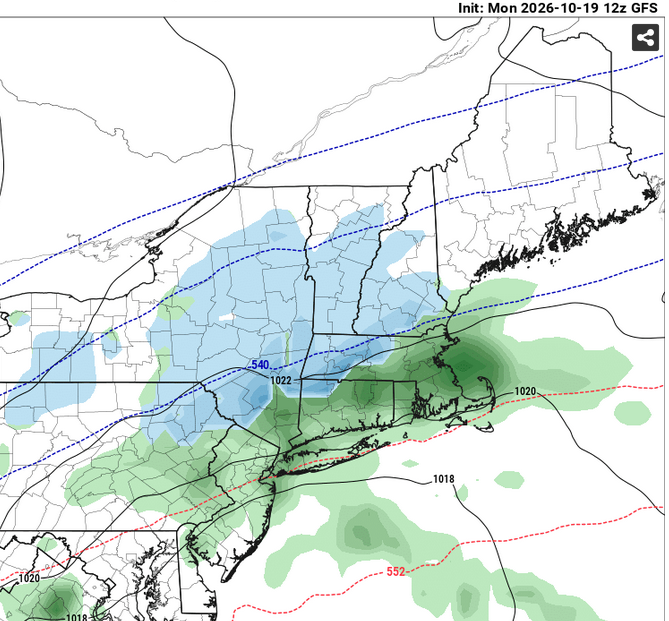
There it is ... the new climate normal for snow in October