

Typhoon Tip
-
Posts
44,568 -
Joined
-
Last visited
Content Type
Profiles
Blogs
Forums
American Weather
Media Demo
Store
Gallery
Everything posted by Typhoon Tip
-
I have a time sensy hypothesis that would expire upon reception of the this immediate ensuing Euro run - ...I'm wondering if tries to bulge up a bit of an eastern CONUS ridge D 7 -10 ...latter.
-
Fwiw - rad also gives the impression they are ~ 30 mi too far N along that N periphery of their 'pink' cloud annotation but we'll see
-
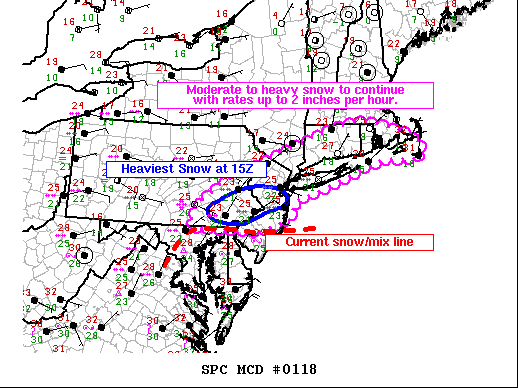
This thing is a sheared out mess... The WAA/isentropic aspect is being displaced many hours down stream to the point of being ripped away ... opening up a gap between it ( the deep blue p-type rad wall pressently DCA to NJ...) ...and a cyclogen latter response that is more more evidenced as being "starved" ...because the antecedent is stealing away seaward with the dynamics. SO, in total...this is a system that straight up clearly got butt f*ed by the fast flow... This is proving as in motion paragon, why compression does not favor deep lows. Nice learning op... It's all relative - if the in situ mechanics were overwhelming ...you may get closer to a fast moving bomb, but the stretching ...ultimately leading to shearing forces are always there...and it's up to the in situ mechanics to either able to hold it together...or burst up and shred like this bootleg 30 hour ordeal ends up becoming of it -
-
Storms have ended up west of guidance... but not necessarily stronger. The problem with track - less so amplitude - coverage by the models has been the "needle threading" aspect -
-
Been elucidating ( or trying to...) that point for a couple of months now frankly: the recurring theme to diminish amplitude relaying outer range aspects ... inside of ~ 5 ..6 day leads. It's been variable amounts of damping ... but always has - never the other direction ( interesting). Sometimes partial, sometimes to the point where once inside 48 hours ... a given original D8 .. 9, reasonably consistent, thus suggestively trackable presence in the flow ... may not even be detectable. The immediate objective response to that is pretty obvious - 'who thinks a day 8 or day 9 feature would verify' But ..neh, - this is worse than that. I'm not sure if that is very normal or abnormal for the recent last 10 or so year of modeling. It's something I have noticed as an excessive frustration this particular year, though. I dunno...maybe something about the hemisphere super-structure/ambience that exposes something they are 'fixing' into the models - maybe to force an over assessment of everything. ...Maybe it is liability protectionism to add 30% vitality to the features out in time. They get their forecast community to over-warn the public early, such than when the inevitable correcting toward harmlessness will need to take place,... there's no way a festering immorality of litigates can hit pay dirt for their own lack of virtuosity and ethics ... I like that - but it's not likely true. Uh...I mean the 'protectionism' - we are a festering immorality of course... It's an important question though, because it seems there's been an increased frequency of model "upgrades" in that time. It used to [ at least seem ...] like these needed 5 years to upgrade any one of these modeling systems. Christ. Millions of lines of modularized code that is/are conditionally called based upon various physically packaged result sets or grid inputs ...some of which is/are still theoretical ... Now? What, they're able to do that yearly? ...yeah I think cynically about stuff. I mean the scientific process perhaps is glossing as modern breakdown ... being less meticulous in modernity ... impatient. I dunno - digressive commentary here, but it "feels" like we live in a rushed intent, vetting is eroded by ambition. It's not discretely obvious but as a lean? Attitude to 'get it out there,' based on some .. perhaps competition, or perhaps even celebrity ambition ... Private industry is competitive with the NCEP... or the like. So, these institutions may even just be pressured; need to be rushing things to keep up and they can't - catch-22. Why? The Gov can't by circumstance really be agile like private tech... etc..etc... What suffers? more so the 'institutional dependability.' That circuitry leading to a lax systemic error prone product suite... it's probably not exactly right. Ha... But, there is a modicum of uneasiness about these modeling products when you see something like a damping aspect that is 100% dependable, regardless of all circumstances leading, too. You know, if a car always drifts left or right regardless of the terrain of the road, that's usually a sign one needs to check their alignment - I don't recall a single modeled impactful event from that range ...successfully maturing to less than ~ day 5 without being morphed weaker ... It's surreptitiously diminished, too. You don't know how in the hell you ended up with the piece of shit you're looking at. You just sort of realize, 'man, this thing's a piece of shit - how did I get here'.
-
It’s amazing how he does that
-
I didn’t until recently. I wanted to track its accuracy and figured I’d give it the season. so far it’s not impressive with details while seeming reasonably good at general system awareness in space if that makes any sense
-
It’s possible the guidance was in limbo about which aspect to focus on which was diminishing both ?
-
I can certainly understand the logic but that sort idea seems more so for after the 10th of March by our climo ?
-
I mean ...it's not like the general theme is very promising - As a base-line probability every season can go pretty much until April 15 N of NYC - That's the 'probability' canvas by wealth of idiot son for being born N of NYC. From that one subtracts or adds: seasonal trend teleconnectors, air and sea (and this is a 2500 page novel ) 'intangibles' - that undeniable weirdness lol But none of which, subjective or objectively ... suggests this goes to April 15 this time. In fact, March 15 would be unlikely/ lucky - So, some years one can elevate expectations based on those signals... this is not one of those
-
Low likelihood for positive returns but ... the NORLUN-like feature shows up again for latter Friday into Saturday on this 12z GFS cycle as well
-
Nope ...same drill ... It'll come in damping to the same bullshit -
-
Yeah... agreed winter death- math for dummies and deniers: A The AO/PNA/NAO at CPC are warm signaled by March ( am aware that half the AO members attempt to sag back negative, but that at the end of week two but that is utterly undependable). B The antecedent hemispheric footprint La Nina comes with warm spring climo C The HC wants to expand southern heights at all times ...built in at planetary scope ( A + B + C ) / 3 = ? While all that is occurred/ing/set to transpire ... any given model run that shows a general synoptic distinction that is cold and snowy ... must by lucid problem solving skills be construed as incongruous .. Anomalies nested in anomalies happen from time to time.. .. Like, one may observer 6 months in a positive temperature raging hard-on, but it gets really cold for two weeks inside... That two weeks is a negative anomaly, relative to the longer term warmth - ... So, sure, we could "bowling" ball in March.. .But money down? bet at own risk... Problem is? Knee jerk reactions - taken to extreme and absolutes... Some comes in here and sensibly and rationally gives reason to veraciously conclude along a warm correction vector, and we get this steady stream of 'cancel winter' waving. I think folks should almost expect a balmy expansion away from winter at some point next month... arriving at any time really after the next couple weeks. Whether that times for first, 2nd or 3rd week... whatever. I mean I'm already seeing attempts in the numerical guidance. The latitudes beneath roughly 37 deg across ever E of Denver on the 00z Euro... from D4 on, ...that is spring in the south folks. Like this ICON ...These types of thickness plumes are bubbling out of the south at times now - it's not that this may verify unto itself...it is increasing in frequency in modeling ...a manifestation of all the above, and the fact that winter can't f'ing last for ever - get over it.
-
What does that mean exactly ha ...seriously curious there, what constitutes canceling of winter, in a discrete, comprehensively intelligible definition. I think most would agree that it is cooler now that it will be in July. That is acceptance that it is, in fact, winter.
-
I frustrated this snark in the other thread, but, I'm done with this model performance cold season - This consummate dampening of amplitude bringing anything, no matter what model either, into near ranges - that fact cannot be more punishing ( and stupid to ignore ) at this point. 22nd is not happening until that can be resolved... otherwise, whatever does, is a pallid reality
-
no
-
I think some portion of that, both at the individual and group psycho-babbledy level, has to do with "drama-conditioning" ... similar to Will's "spoiled rotten..." observation a while ago. It's a conditioning with two constraints: The first is intra seasonal persuasion ... like, getting these snow bombs on December 15 ( ~) both years, ...sets up the "fair objective perspective of J.Q. Public" for keeping it real the rest of the way never The 2nd is a bigger problem with western industrial societies. You know.. ( seein' as you asked have nothing better to do ...lol ) it reminds me of that episode in "Star Trek: The Next Generation," called "The Game." Basically... ( man, that show's sci fi writers really did nail this! ), the plot featured an invasive gaming device that delivered a ultra-powerful addictive pulse of euphoria, through the eyes, of whomever donned a gaming device. It pulsed some neuro- sensitive signal into the eyes...that immediate lit the brain up into an ecstatic "braingasming state" that was an order of magnitude more addictive than heroine, and also ...left the person almost infinitely obsequious to absurd suggestion if it meant getting back to the next pulse... etc...etc.. the latter being the intent of the aliens. This culture of ours...it's a soft, yet eerily smacks as similar with this "pandemic" of e-psychotropic addiction - it's a real thing folks. Weather charts? Same ... yup. It's just a smaller part and parcel of an overall techno glitter cinema at our constant stimulation desire and disposal... We can't seem to turn away for more than mere minutes, where whence real nature moves at us far more quiescent and less 'triggering' ... and that's the trap. It really more than just seems everything we do as a species, in this general 'sociotechnological framework' of modernity ...is caught up in an illusory bubble ...where we think of reality as necessarily matching that steady diet of stimulation. Look out the window ( not you per se - I mean as allegory here ...)... That sun serenity ? That is how fast nature is coming to get you. It's not what we think of, after we've spent an hour brain-soaking, having been submerged in thumb-swipes and mouse click drama crack... bringing the entire world before our eyes, by people that gaslight and an audience willing to be manipulated because once in, the ennui outside the bubble is too miserable. It's like any addiction process - you can escape because the alternative circuitry has been fried by too much, and no longer turns on the joy. Your reality becomes a decision between heaven, and returning to hell - This is all new territory in human history ... It's why I've coined the notion that we are living in the greatest sociological experiment and [probably] evolutionary step since we crawled out of primordial competition as fire controlling iron smelters. It's a fascinating anthropological digression that is equally so, not appropriate for this thread and ... general circuitry of social media, no - Lol. Anyway, we in here suffer the same conditioning ... but we're getting it from two sources. Our lives outside this hobby/engagement/obsession ( whichever...), is bathed as such, but then we take that same membership of civility, and process that attention span through a mid December lust satisfying snow event ... What part of all that is gonna psycho-babble end too well? Particularly when/ if the rest of the year delivers pedestrian normalcy, and the dreaded fear that nature isn't really the same as the virtual reality bath described above.
-
Mm, last year raged on in a pan-systemic speed issue that was yet more pronounced than this year... We have them this year, too, but we've had a few intervals where that relaxed markedly. That was not the case last year pretty much at any point after the Dec event. The more I think back the frustration's coming back to my memory, and I remember last year as being too fast/speed contaminated in the hemisphere, in fact...the fastest I personally recalled since this velocity saturation shit began 10 or so years ago... And a lot of systems were merely just not given a chance to formulate critical cyclone scaffolding ( cross-sectional jets/ restorative flows mechanics...etc...). Lot of unorganized masses of evaporating failures smeared thru cyclone transit routes... In other words, unknowable because unexposed by virtue of not given the chance. Kind of like diseases that effect older people? 200 years ago... some of these were not known - Christ it predates genetic science too... People lived to the ripe old age of death before Alzheimer's had a chance to kick in (example). Nature's like that - it buries it's right pump bums behind immediate layers. haha ...true though in some sense
-
Whatever the cause and casualties of this bate-and-switch head-game by the models aside ... this system's already suffered a correction rug pullout - we'll see if this bucks trends and come back in short terms.
-
It's really an interesting aspect about the general ambit of the technology ... It doesn't seem to matter what species, either ...they are all doing this - all of them. Noormally, caveat emptor on any D7 anyway. Heh .. goes without saying. However, sniffing D7 "bigness" and ending up with something considerably smaller impact, scope or scale so frequently as to become notably dependable - . I don't recall this being the case last year this coherently - I'm wondering if there something about this season's hemisphere that's prone. The events that appeared more footed in the teleconnector signaling did perform better, all three ... October, Dec 17 and recently. Otherwise, these non-corrective in-between maintenance sort of systems have all been persistently over-baked. Moreover, their believability therein gets compounded for two reason really. The first being human, big storm presentation seeking lenses ( so that parts on us...). The other is cross-guidance support. That's the kicker for me ... I mean, the Euro and GFS seldom agree on much beyond D5 anyway; their native biases kick in and those happen to be diametrical .. Euro corrects everything into calligraphic layouts that end up with too much N-S; contrasting, the GFS has too cold of heights (always!) at 55 N which it convert the speeding flow into progressive over-management, W-E... Yet, both will "see" a given D7/8 menace... both end up weaker. So it's not really like we can blame it on a model's native handling -
-
Not impressed at all overnight ... Interesting ( sneaky) 00z and 06z operational GFS have a weak NORLUN sig pivoting down across eastern zones near-by seaward. QPF band vaguely notable ... It's a weak signal as is. But there nonetheless. Seems like I've seen that a couple times this year ( and other seasons for that matter ...) and they so seldom do materialize. Yet, when no one's looking, Portland ME .. etc. Anyway, seems to linger out there extending west through Saturday evening - ... maybe (metaphor ) think of that as morphine for weather graphical opiode withdraw clinic while facing the fact that the 22-25th period is also going to prove over-assimilated/over-amped. Ha - seriously though, the 00z Euro, at least hints that again.
-
Yeah Difference in synoptics ...just looks the same at the surface but not a good comparison
-
I’m not sure where my feelings set as I crash here. My taste for this thing soured a bit during the day ... Euros tough to beat inside of D4. I think it’s gotta tick pretty aggressively in this immediately ensuing run. If not it’ll be in an uncharacteristic short lead bust or proven superior. but as is yup ... the mid level magic has had an upshot look to it 300 mb jet !!
-
I was thinking that needs to happen it appears the NAM is front soaked with that isentropic snow wall it’s carrying on with but its gobbling up dynamics and escaping seaward with it in its total handling ... leaving less available for Q-V forcing cyclogen blah blah
-
The 00z GEF -based teleconnector coverage still looks rather warm in the AO and distant PNA ... So, the EPS signaling that ( assuming as we close out the month ..) not surprising. They could be rushing things though.. I'm also wondering if the PNA sagging out there may be accompanied by an EPO block...


