GaWx
Members-
Posts
11,467 -
Joined
Content Type
Profiles
Blogs
Forums
American Weather
Media Demo
Store
Gallery
Everything posted by GaWx
-
If you still think that, then there’s no reason to not stick with it. So, in your mind, you’re probably not going down with the ship because otherwise you wouldn’t have said you still expect super.
-
To not admit that 3.4 is very much underperforming vs model consensus and my own earlier expectations, especially at a very crucial time like this, wouldn’t be being objective/honest. The 3.4 anomaly on Oct 10th is the same as it was WAY back on Aug 16th, when it first made this level. Back then, it was warming rapidly and forecasts for a super strong ONI were looking good to me. That is no longer the case, period. A super peak is going to be very hard to attain based on the latest. I’m now back to a high end strong (~+1.7 to +1.9) like I was earlier.
-
The SOI is now up to 52 straight negative days. Looking at the models, it could easily end as early as tomorrow. We’ll see as I’ve been too early ending the streak in recent predictions. Regardless, a 52 -SOI day streak is impressive. Going back to 1994-5, only 2015-6 and 1997-8 had longer -SOI streaks though they their longest were well above 52 days (two were much longer in 1997-8 with 72 and 99 days and 2015-6 had both a 66 and a 55 day -SOI streak).
-
I’m confident that Oct 2023 won’t be nearly as cold as Oct of 1976. But regarding 2009, the cold was more intense in the C US than in the E US. Oct of 2023 has a very good chance as it looks now to end up colder in the SE and even a decent shot at as cold or colder up into the Mid Atlantic states vs 2009. And Oct looks to have a decent shot at being about on par in the E US with 1957, 1965, and 1977, especially if yesterday’s Euro weeklies were to verify well.
-
I agree with you about the SE. But even further N at BWI, there appears to be a decent chance. BWI is for Oct 1-9 down to +4.8 or 43 cumulative degrees above normal, consistent with the map you posted having BWI within +3 to +6. The latest Euro weeklies, which actually have had more tendency to be too warm rather than too cool per my memory, have BWI BN for each of Oct 9-16, Oct 16-23, and Oct 23-30. This is the first time it has a BN E US for Oct 23-30. IF this Euro run were to verify well, that 43 cumulative degree surplus could very easily be much more than erased. If these 3 weeks were to average, say, -5 (which from what I’m seeing is a reasonable possibility) that would be enough to put Oct 1-30 at a cumulative -62 degrees or an average of -2 per day, which is my threshold for a BN month.
-
There is a partial correlation between BN E US Octobers and BN subsequent winters during El Niño. That’s one reason I’ve been rooting for a BN E US October (besides my preferring BN during all seasons), which as @roardogjust implied is looking increasingly likely. Check out the map I included in the following post showing how cold it was in the E US during Octobers of 1957, 1965, 1976, 1977, 1987, and 2009:
-
But COD MJO (especially W half of COD) during El Niño correlates more to cold than warm in the E US. Most of the highlighted periods within the 15 MJO charts I posted had majority COD. So, that’s actually very good news for those hoping for a cold E US that you’re talking about COD possibly being frequent this winter.
-
These JMA maps for Jan and Feb look much more -EPO than +PNA to me with the lowest ht anomalies centered in the Lakes to NE and not in the SE and the highest H5 anomalies centered Alaska and NW Canada instead of further E from N Idaho northward. Regardless, I take these seasonal predictions of models with a huge grain, especially this far out due to limited accuracy.
-
Looking at the indices: despite a solid +PNA, there was a strong +AO and +NAO. Also, Jan MJO was strongly concentrated on the warm right side. Now, Feb was a cold month though despite no AO/NAO blocking.
-
Because it is mainly water vapor, it is having a net warming effect on the troposphere vs the typical net cooling from sulfur. Some of the unexplained significant GW this year could very well be explained by this. However, despite the net GW from the volcano, it varies quite a bit both regionally and seasonally. Also, the volcano is expected to have a longer term significant effect of ~7 years total with a higher than normal chance of a multiyear El Niño this decade, which could interestingly enough then actually cause some cooling during winter in the SE US/Mid Atlantic states along with strong warming in the NW US as per Nino climo.
-
The low this morning at KSAV was 46 after a 49 yesterday. From my perspective, the low dewpoint outdoors walking season started the evening before last (took two weekend walks and hope to later this evening) and hopefully the lack of humidity will dominate through next April.
-
The new Euro weeklies are the coldest yet for October overall in the E US with the all important last week of Oct BN for the first time on any run (see image below)! This is what’s needed to nearly insure a BN Oct in the E US. If this were to verify, this wouldn’t just be significant for chilly Oct prospects. More interestingly, there’s a partial correlation of BN E US Octs and BN E US winters during El Niño. New Euro weekly for 10/23-30 is BN E/SE US for first time:
-
I just posted this in the main ENSO thread and feel this is very relevant to prospects for cold in the SE during the upcoming winter. Bottom line: best chances for extended intense cold during El Niño winters are suggested (based on Nino winters since 1976-7) to be when the MJO is weak (including inside the COD), especially when mainly left side weak:
-
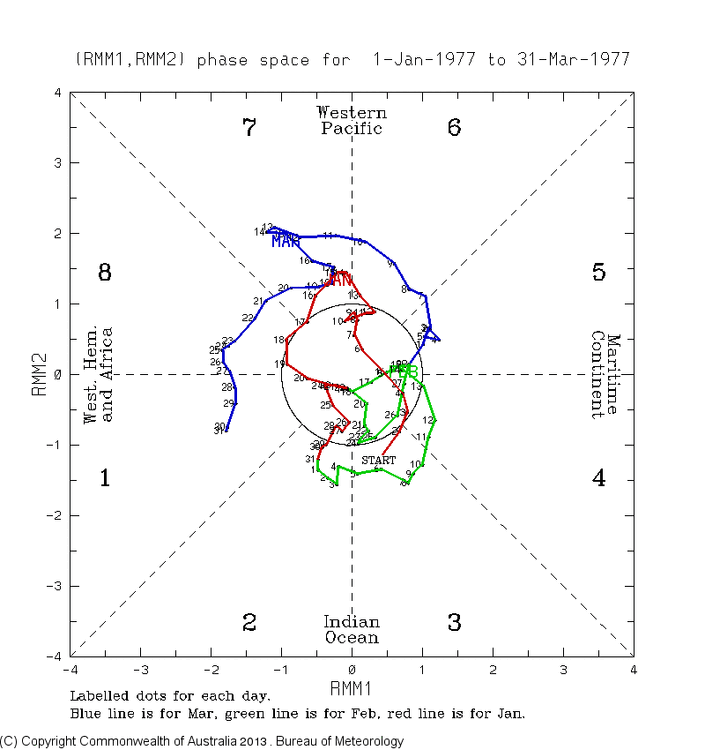
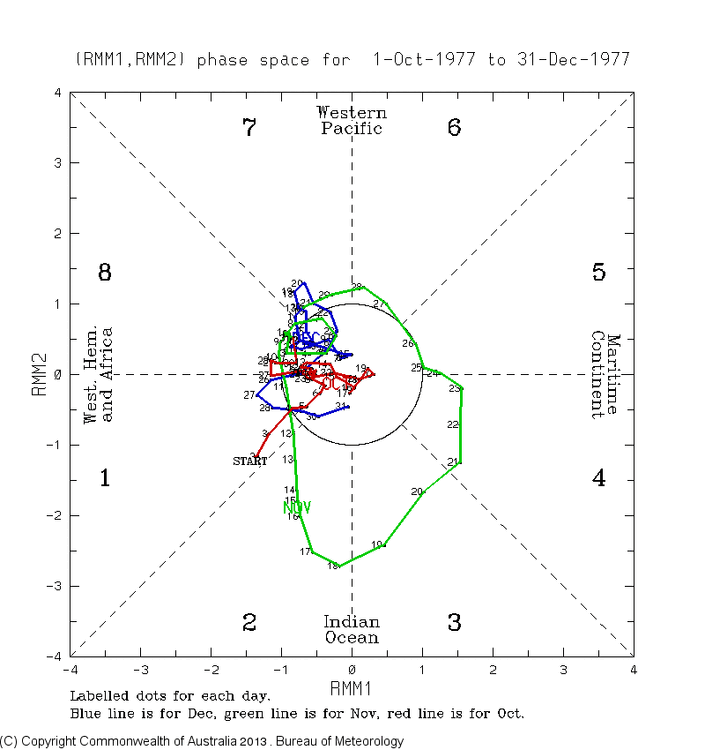
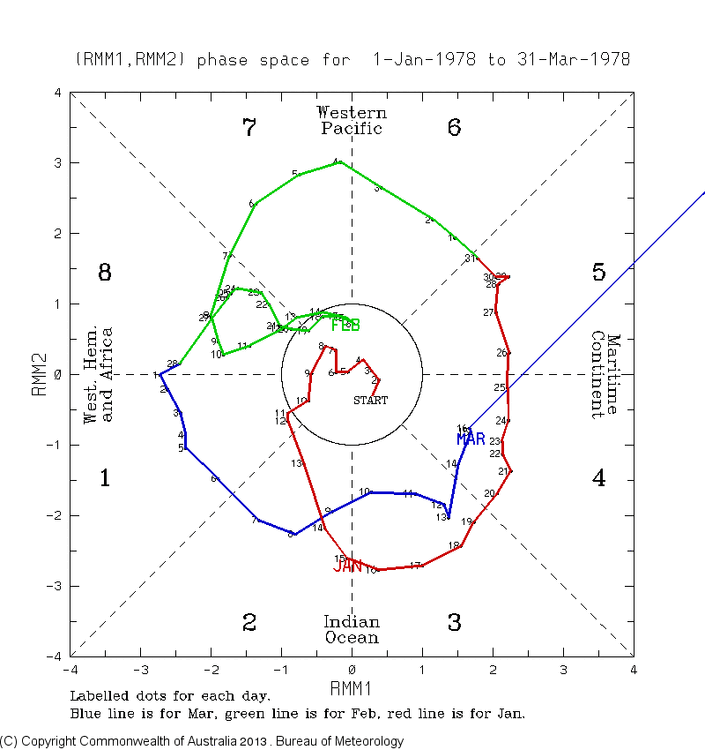
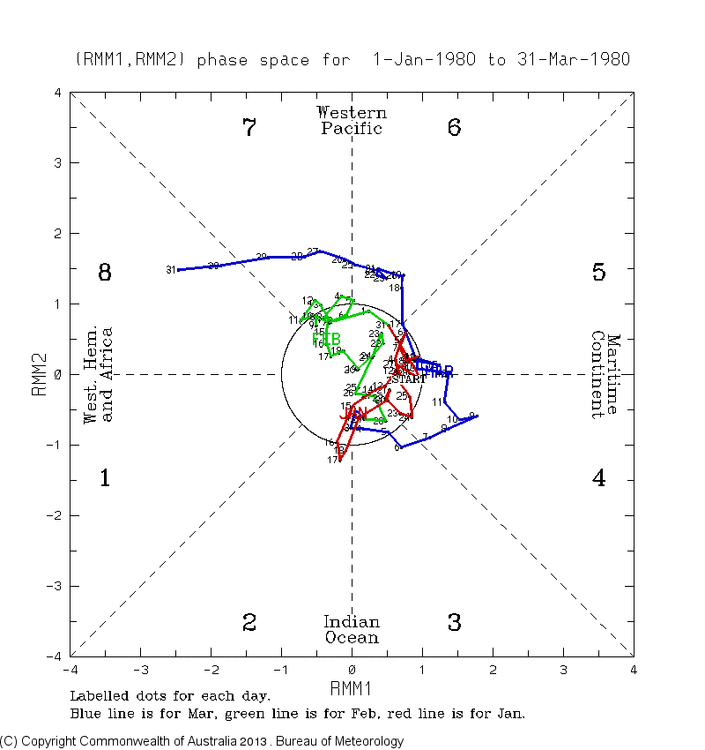
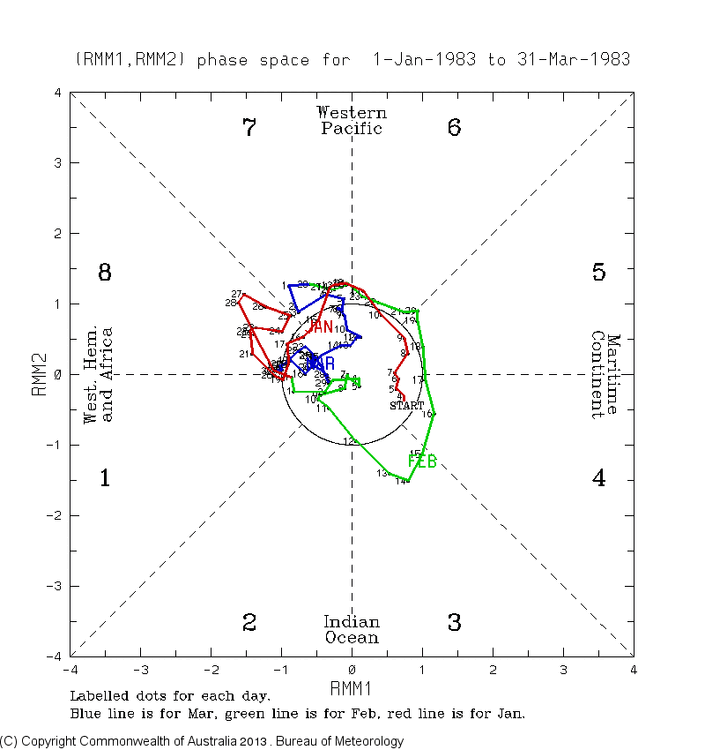
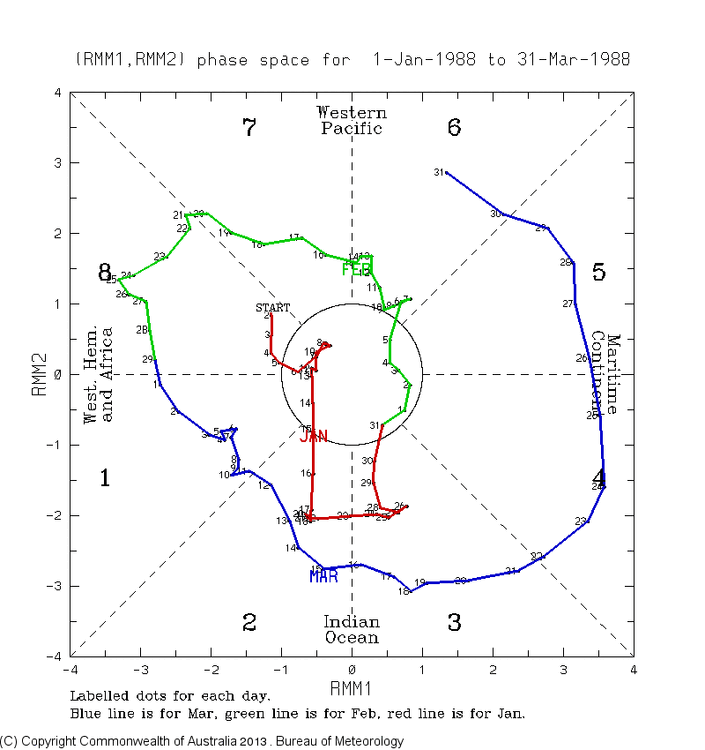
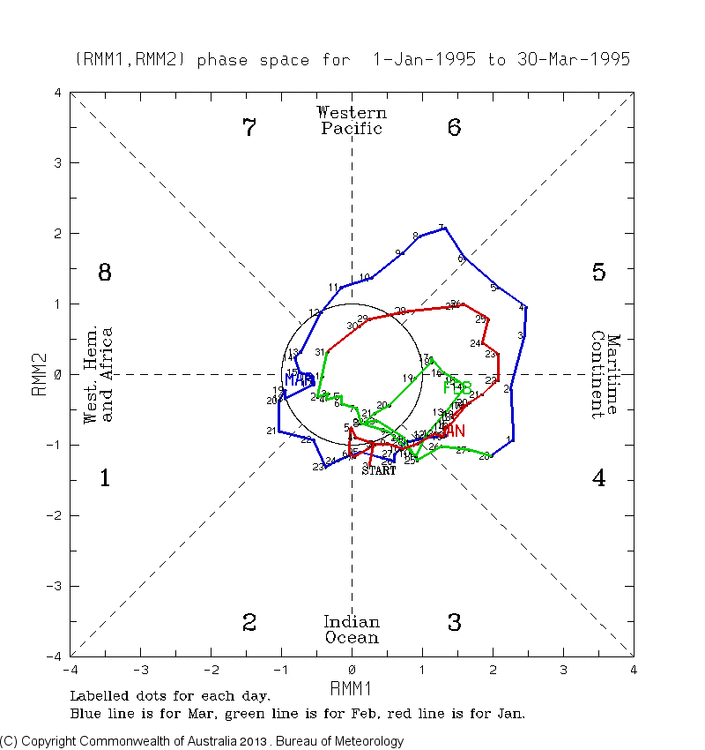
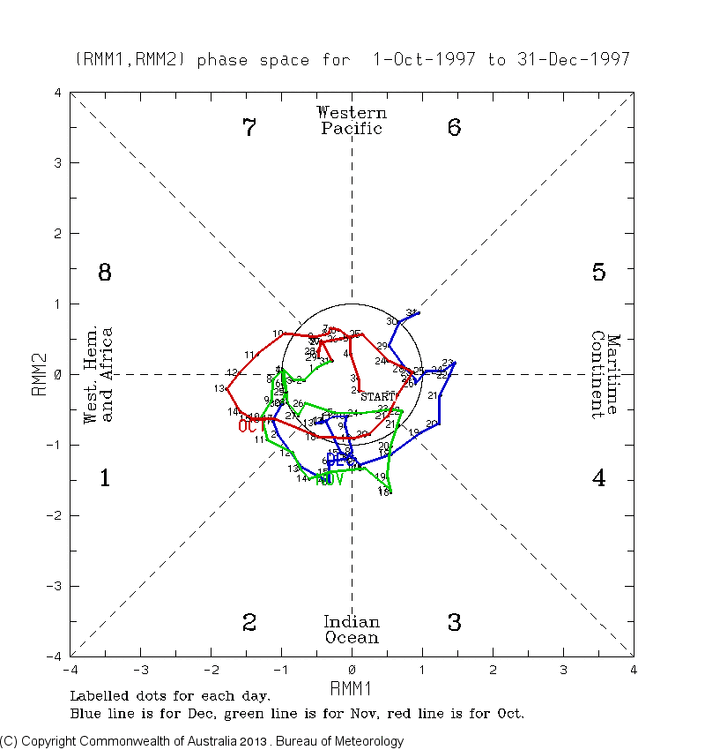
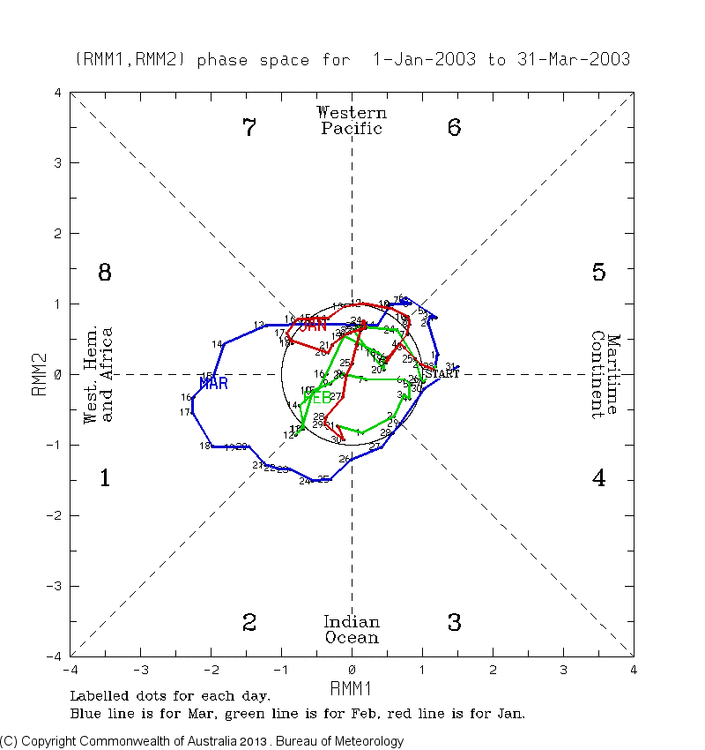
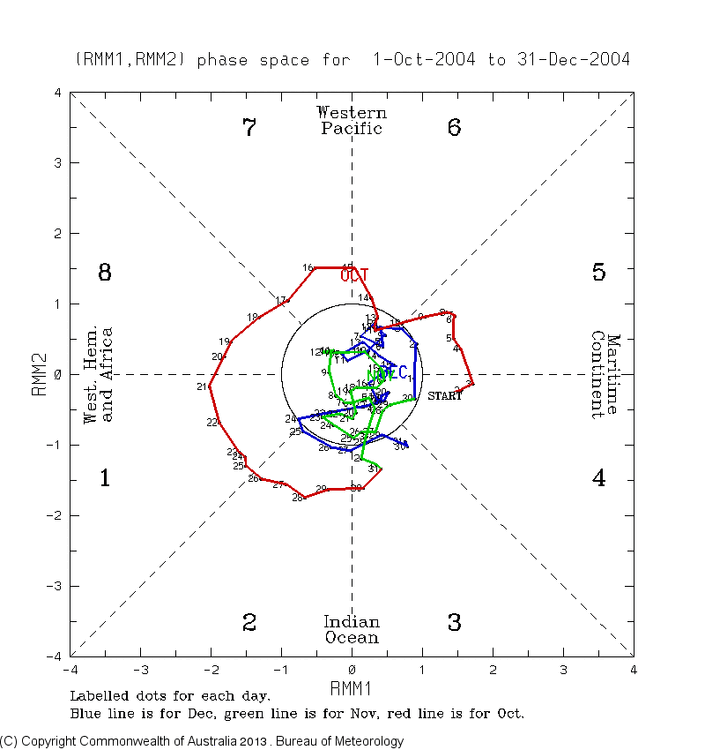
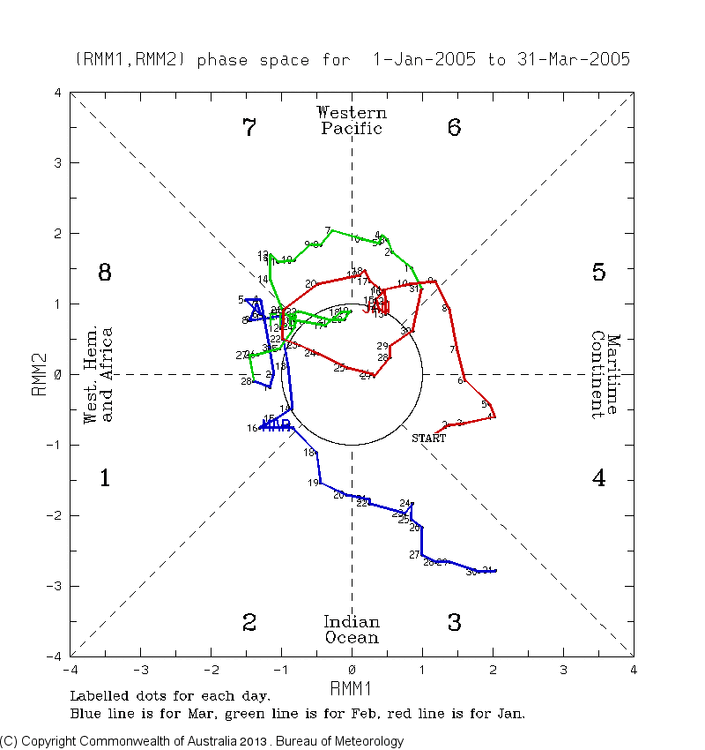
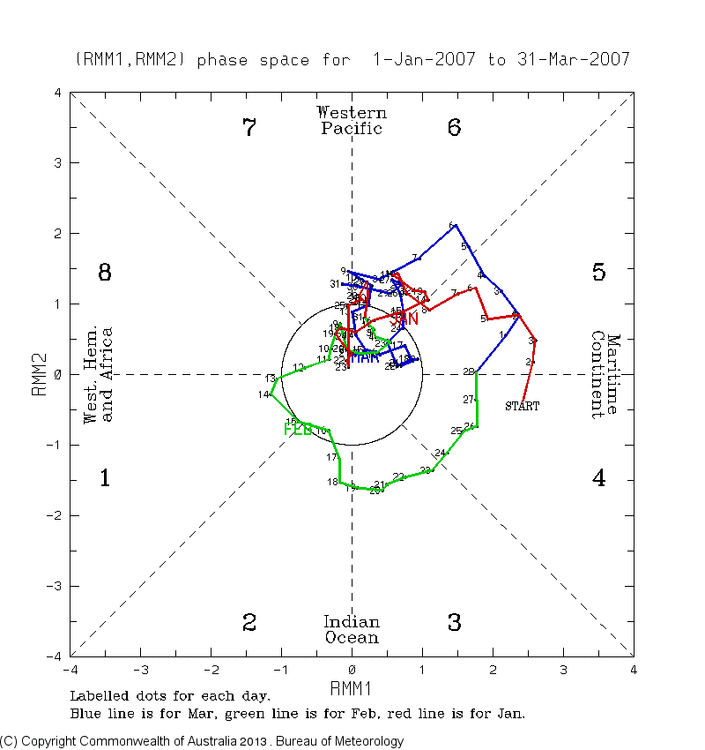
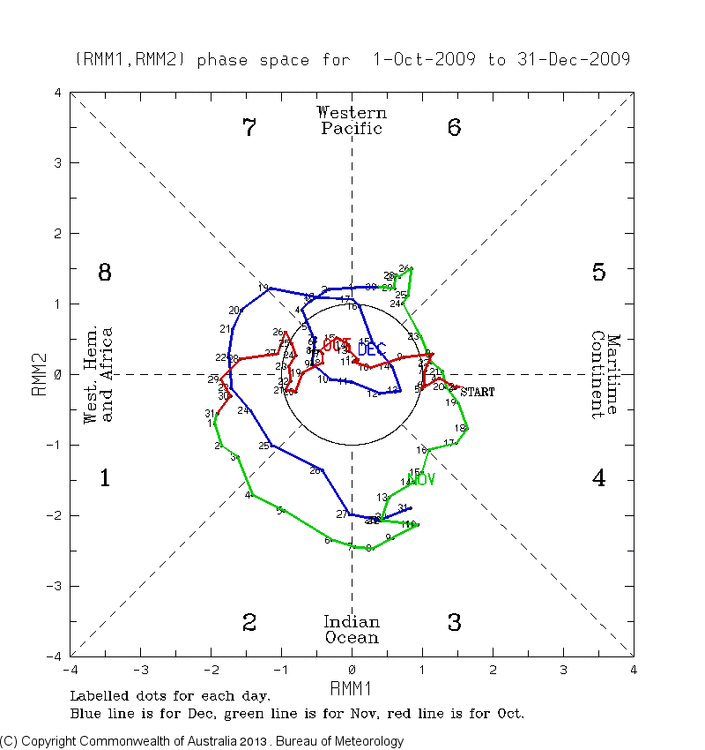
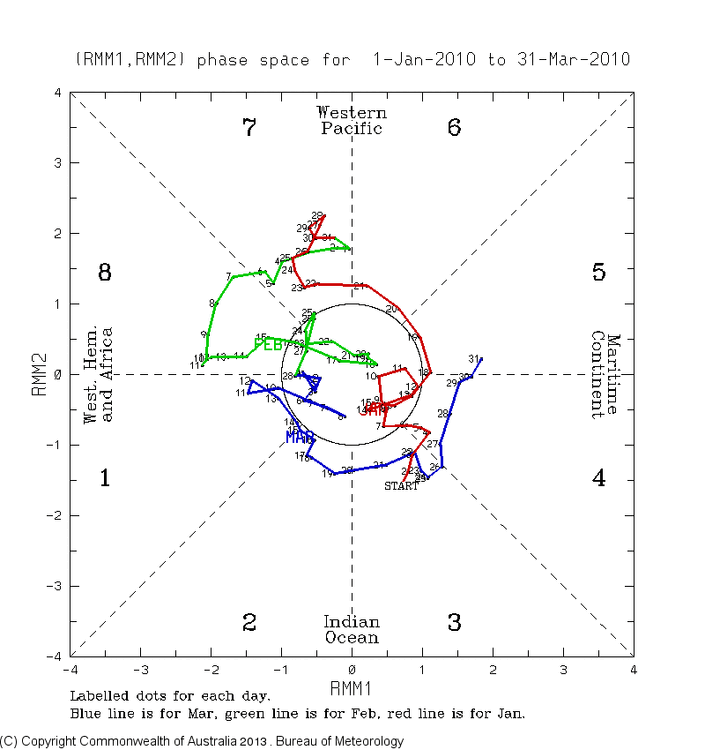
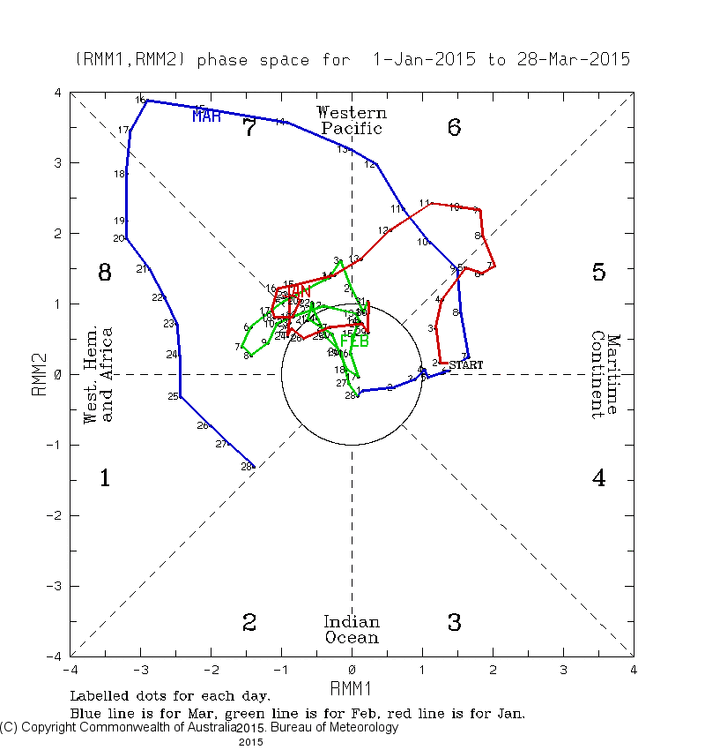
Weak 8-1-2 dominating during El Niño often favors a cold to very cold E US, especially SE US. As one who prefers cold, I would want a lot of weak 8-1-2 to keep cold chances the highest. Back in the 2010s, I analyzed the SE US going back to the 1970s and found that in general, weak left side of MJO diagram, including inside the COD, was coldest, while right side of diagram outside of COD, was warmest. Weak averaged colder than strong for all phases. This was often the case also for a good portion of the E US. Here are 15 MJO diagrams covering El Niño periods with weak MJO, (dominated by the left side in almost all cases) with inside the COD or just outside for (almost) all of the days, along with temp. anomalies for ATL and NYC: -Jan 1-Feb 2, 1977 (red/green): ATL -13, NYC -9 -Dec 21-30, 1977 (blue): ATL -9, NYC 0 -Jan 1-13, (red) and Feb 11-22 (green) 1978: ATL -7, NYC -4 -Feb 1-20 (green) and Mar 1-4 (blue), 1980: ATL -10, NYC -4 -Jan 12-Feb 13 (red/green) and Mar 9-31 (blue), 1983: ATL -5, NYC +1 Jan 1-16, 1988 (red): ATL -8, NYC -7 Jan 30-Feb 10, 1995 (red/green): ATL -6, NYC -4 Dec 1-15, 1997 (blue): ATL -6, NYC -2 Jan 11-27, 2003 (red): ATL -10, NYC -8 Dec 14-28, 2004 (blue): ATL -8, NYC -5 Feb 27-Mar 10, 2005 (green/blue): ATL -8, NYC -5 Jan 28-Feb 19, 2007 (red/green): ATL -8, NYC -9 Dec 1-21, 2009 (blue): ATL -5, NYC -3 Jan 1-14 (red) & Feb 14-Mar 22 (green/blue), 2010: ATL -9, NYC +1 Feb 12-28, 2015 (green): ATL -14, NYC -15 These 15 diagrams cover periods that were during 12 of the 16 (75%) El Niño winters between 1976-7 and 2018-9. The only 4 of these El Niño winters not covered by a diagram were 1986-7, 1991-2, 2015-6, and 2018-9. Other than Dec of 1986, those 4 didn’t have many weak left sided MJO days. So, for ATL, these 15 portions of El Niño winters with weak mainly left-sided MJO averaged a very cold 8 BN over 346 days. The 15 periods varied between -14 (MBN) and -5 (BN) with 11 MBN and 4 BN. So, for NYC, these 15 portions of El Niño winters with weak mainly left-sided MJO averaged a cold 4 BN over 346 days. The 15 periods varied between -15 (MBN) and +1 (N) with 5 MBN, 6BN, and 3N. So, with @snowman19 now suggesting weak 8-1-2 MJO likely to dominate much of the upcoming winter, I feel the chances for a cold E US winter and especially SE US are elevated vs if that weren’t the case. Now if we could get the cold Oct I’ve been hoping for since that’s a leading indicator!
-
How long do you expect weak MJO 8-1-2 to dominate? All of the way through winter or just through autumn?
-
To get a BN October, we’ll likely need a BN last week. As of now, that’s not being suggested by the longer term models. Hopefully that will change and there’s still plenty of time since that’s in week 3, easily far enough out for the models to be off. Fingers crossed as a BN Oct during El Niño is partially correlated to a BN winter.
-
The article linked below, which was written 8/9/22 suggests that the Hunga Tonga eruption caused major strat cooling in the S Hem in 2022. It also claimed some correlation between a cold S Hem strat in Jul-Sep and a -NAO the next NDJ, which would have been for 2022-3. But NDJ of 2022-3 was dominated by a +NAO. From the article: “If we look at the winter seasons following anomalously cold south stratospheric years, we can see a great example of a negative NAO pattern.” Comments? https://www.severe-weather.eu/global-weather/cold-anomaly-stratosphere-polar-vortex-volcanic-cooling-winter-influence-fa/
-
SN El Niño/-QBO RDU/ATL (excludes ZR): 51-2: 4.7”/3.9” 53-4: 7.1”/0.1” 58-9: 13.5”/2.4” 65-6: 11.8”/0.7” 68-9: 12.0”/2.2” 72-3: 11.3”/1.0” 76-7: 3.6”/1.0” 79-80: 18.3”/4.4” 86-7: 10.8”/4.8” 91-2: T/5.0” 09-10: 8.0”/5.3” 14-15: 7.9”/T AVG RDU Nino/-QBO: 9.1” vs 6.4” norm; so AN avg; median 9.4” AVG ATL Nino/-QBO: 2.6” vs 1.9” norm; so AN avg; median 2.3”
-
But he didn’t say E QBO favors opposite. Instead he implied (see his H5 map that backs this) still +PNA but with storms on avg going more quickly offshore vs more up coast with +QBO Nino. Both are +PNAs
-
NYC/Boston SN El Niño/-QBO 51-2: 19.7”/31.9” 53-4: 15.3”/23.6” 58-9: 13.0”/34.1” 65-6: 21.4”/44.1” 68-9: 31.2”/53.8” 72-3: 2.8”/10.3” 76-7: 24.5”/58.5” 79-80: 12.8”/12.5” 86-7: 23.1”/42.5” 91-2: 12.6”/22.0” 09-10: 51.4”/35.7” 14-15: 50.3”/110.6” AVG NYC Nino/-QBO: 23.2” vs 25.8” norm; so NN avg though median is less, 20.6” AVG Boston Nino/-QBO: 40.0” vs 43.7” norm; so NN avg though median is less, 34.9”
-
Nowhere in that preview of 09-10 did he say that a -QBO Nino favors a -PNA. Actually, his H5 map suggests +PNA is favored with the AN hts NW US and BN hts SE US. He did say less SN for Boston/NYC when -QBO vs +QBO because storms tend to go OTS too quickly with -QBO vs going more up the coast with +QBO. I’ll check the data and see.
-
We will have a -QBO in 2023-4. These Ninos had a -QBO/+PNA for DJF (and NDJFM) averaged out: 1976-7, 1979-80, 1986-7, 1991-2, 2009-10, and 2014-5: six cases While only these had -QBO/-PNA: 1951-2, 1965-6, 1968-9: 3 cases These had a -QBO/neutral PNA: 1953-4, 1958-9, 1972-3: 3 cases So, -QBO/+PNA has won out in -QBO Ninos by a 2:1 ratio over -QBO/-PNA. Chances during Nino/-QBO based on actual data since 1950: 50% +PNA, 25% neutral PNA, 25% -PNA QBO: https://psl.noaa.gov/data/correlation/qbo.data PNA: https://www.cpc.ncep.noaa.gov/products/precip/CWlink/pna/norm.pna.monthly.b5001.current.ascii.table
-
But these Ninos had a -QBO/+PNA for DJF (and NDJFM) averaged out: 1976-7, 1979-80, 1986-7, 1991-2, 2009-10, and 2014-5: six cases While only these had -QBO/-PNA: 1951-2, 1965-6, 1968-9: 3 cases So, -QBO/+PNA actually has won out in -QBO Ninos by a 2:1 ratio over -QBO/-PNA based on the actual data! To add, there were 3 cases of -QBO/neutral PNA. QBO: https://psl.noaa.gov/data/correlation/qbo.data PNA: https://www.cpc.ncep.noaa.gov/products/precip/CWlink/pna/norm.pna.monthly.b5001.current.ascii.table
-
And this is based on 1981-2010 base, which is cooler than 1991-2020. If there were to be a cold snap similar to this in late OCT, that would be enough to push a BN Oct chance to highly likely for much of the E US. The last Nino Oct that was BN in a good portion of the E US was 2009 fwiw. Other chilly E US Octs included 1987, 1977, 1976, 1965, and 1957.
-
Eyeballing this, it looks like ~2.11 for NDJ and ~2.15 for DJF vs last month’s 2.24/2.19 and August’s 2.4/2.35. So, another modest reduction in the peak though still super along with a slight delay in the peak timing to DJF instead of NDJ.


