GaWx
-
Posts
16,036 -
Joined
Content Type
Profiles
Blogs
Forums
American Weather
Media Demo
Store
Gallery
Everything posted by GaWx
-
BULLETIN - IMMEDIATE BROADCAST REQUESTED FLOOD WARNING NATIONAL WEATHER SERVICE RALEIGH NC 1042 PM EDT SUN JUL 6 2025 ...FORECAST FLOODING CHANGED FROM MODERATE TO MAJOR SEVERITY AND INCREASED IN DURATION FOR THE FOLLOWING RIVERS IN NORTH CAROLINA... HAW RIVER AT HAW RIVER AFFECTING ALAMANCE COUNTY. 250707T1727Z.NO/ 1042 PM EDT SUN JUL 6 2025 ..FLOOD WARNING NOW IN EFFECT UNTIL EARLY TUESDAY MORNING * WHAT...MODERATE FLOODING IS OCCURRING AND MAJOR FLOODING IS FORECAST. * WHERE...HAW RIVER AT HAW RIVER. * WHEN...UNTIL EARLY TUESDAY MORNING. * IMPACTS...AT 18.0 FEET, MINOR FLOODING BEGINS. OVERFLOW BEGINS ON BOTH BANKS AT THE WATER TREATMENT PLANT. AT 20.0 FEET, THERE IS SIGNIFICANT OVERFLOW ON THE RIGHT BANK OPPOSITE THE WATER TREATMENT PLANT. WATER ALSO REACHES THE RED SLIDE PARK UPSTREAM OF THE MAIN ST. BRIDGE. AT 23.0 FEET, MODERATE FLOODING BEGINS. FLOODING REACHES THE BASE OF THE WATER TREATMENT PLANT BUILDING. THERE IS ALSO SIGNIFICANT FLOODING OF THE RED SLIDE PARK UPSTREAM OF THE MAIN ST. BRIDGE, AND LANG ST WILL BE IMPASSABLE AT 25.5 FEET, THE WATER TREATMENT PLANT BUILDING FLOODS. AT 26.0 FEET, TRAILER HOMES ADJACENT TO THE RIVER AND THE WATER TREATMENT PLANT FLOOD. EVACUATIONS MAY BE NECESSARY. AT 27.0 FEET, MAJOR FLOODING BEGINS. THE TOWN OF HAW RIVER BEGINS TO FLOOD. AT 28.0 FEET, FLOOD WATERS REACH THE BOTTOM OF THE BRIDGE ACROSS I40. * ADDITIONAL DETAILS... - AT 9:45 PM EDT SUNDAY THE STAGE WAS 25.5 FEET. - FORECAST...THE RIVER IS EXPECTED TO RISE TO A CREST OF 27.5 FEET JUST AFTER MIDNIGHT TONIGHT. IT WILL THEN FALL BELOW FLOOD STAGE EARLY MONDAY AFTERNOON. - FLOOD STAGE IS 18.0 FEET. - FLOOD HISTORY...THIS CREST COMPARES TO A PREVIOUS CREST OF 26.3 FEET ON 09/17/2018. - HTTP://www.weather.gov/SAFETY/FLOOD FLD OBSERVED FORECASTS (8 PM EDT) LOCATION STG STG DAY/TIME MON TUE WED THU HAW RIVER HAW RIVE 18.0 25.5 SUN 9 PM EDT 14.0 10.6 8.4 6.0
-
BULLETIN - EAS ACTIVATION REQUESTED FLASH FLOOD WARNING NATIONAL WEATHER SERVICE RALEIGH NC 1032 PM EDT SUN JUL 6 2025 THE NATIONAL WEATHER SERVICE IN RALEIGH HAS EXTENDED THE * FLASH FLOOD WARNING FOR... ALAMANCE COUNTY IN CENTRAL NORTH CAROLINA... CHATHAM COUNTY IN CENTRAL NORTH CAROLINA... SOUTHWESTERN DURHAM COUNTY IN CENTRAL NORTH CAROLINA... SOUTHERN ORANGE COUNTY IN CENTRAL NORTH CAROLINA... EASTERN RANDOLPH COUNTY IN CENTRAL NORTH CAROLINA... * UNTIL 200 AM EDT. * AT 1032 PM EDT, WIDESPREAD FLASH FLOODING IS ONGOING ACROSS MUCH OF ORANGE, ALAMANCE AND CHATHAM COUNTIES THIS EVENING AS RAINFALL AMOUNTS OF 4 TO 7 INCHES HAVE BEEN OBSERVED IN THE AREA WITH LOCALIZED AMOUNTS IN EXCESS OF 8 INCHES. NUMEROUS WATER RESCUES HAVE OCCURRED THIS EVENING AND SOME HOMES FLOODED. PLEASE DO NOT TRAVEL UNLESS ABSOLUTELY NECESSARY. IT IS VERY DIFFICULT TO SEE THE DANGERS OF FLOODING AT NIGHT. HAZARD...LIFE THREATENING FLASH FLOODING. THUNDERSTORMS PRODUCING FLASH FLOODING. SOURCE...EMERGENCY MANAGEMENT REPORTED. IMPACT...LIFE THREATENING FLASH FLOODING OF CREEKS AND STREAMS, URBAN AREAS, HIGHWAYS, STREETS AND UNDERPASSES. * SOME LOCATIONS THAT WILL EXPERIENCE FLASH FLOODING INCLUDE... CHAPEL HILL, BURLINGTON, GRAHAM, HILLSBOROUGH, PITTSBORO, SILER CITY, CARRBORO, MEBANE, GOLDSTON, ELON, GIBSONVILLE, LIBERTY, HAW RIVER, RAMSEUR, FRANKLINVILLE, SWEPSONVILLE, ALAMANCE, STALEY AND SUTPHIN.
-
I just read that water rescues are taking place in Orange County, the county where Chapel Hill is located: "’People trapped with water up to their necks or higher’ at camelot village apts in CH”
-
BULLETIN - EAS ACTIVATION REQUESTED FLASH FLOOD WARNING NATIONAL WEATHER SERVICE RALEIGH NC 935 PM EDT SUN JUL 6 2025 THE NATIONAL WEATHER SERVICE IN RALEIGH HAS ISSUED A * FLASH FLOOD WARNING FOR... PERSON COUNTY IN CENTRAL NORTH CAROLINA... * UNTIL 145 AM EDT. * AT 935 PM EDT, DOPPLER RADAR INDICATED THUNDERSTORMS PRODUCING HEAVY RAIN ACROSS THE WARNED AREA. UP TO 2 INCHES OF RAIN HAVE FALLEN. ADDITIONAL RAINFALL AMOUNTS OF 2 TO 5 INCHES ARE POSSIBLE IN THE WARNED AREA. FLASH FLOODING IS ONGOING OR EXPECTED TO BEGIN SHORTLY. HAZARD...LIFE THREATENING FLASH FLOODING. THUNDERSTORMS PRODUCING FLASH FLOODING. SOURCE...RADAR. IMPACT...LIFE THREATENING FLASH FLOODING OF CREEKS AND STREAMS, URBAN AREAS, HIGHWAYS, STREETS AND UNDERPASSES. * SOME LOCATIONS THAT WILL EXPERIENCE FLASH FLOODING INCLUDE... ROXBORO, CONCORD, SURL, BUSHY FORK, BETHEL HILL, MAYO RESERVOIR, HYCO LAKE, HYCO MARINA AND MORIAH. OVER THE NEXT FEW HOURS, AREAS ACROSS PERSON COUNTY COULD RECEIVE AN ADDITIONAL 3-6 INCHES OF RAINFALL RESULTING IN FLASH FLOODING.
-
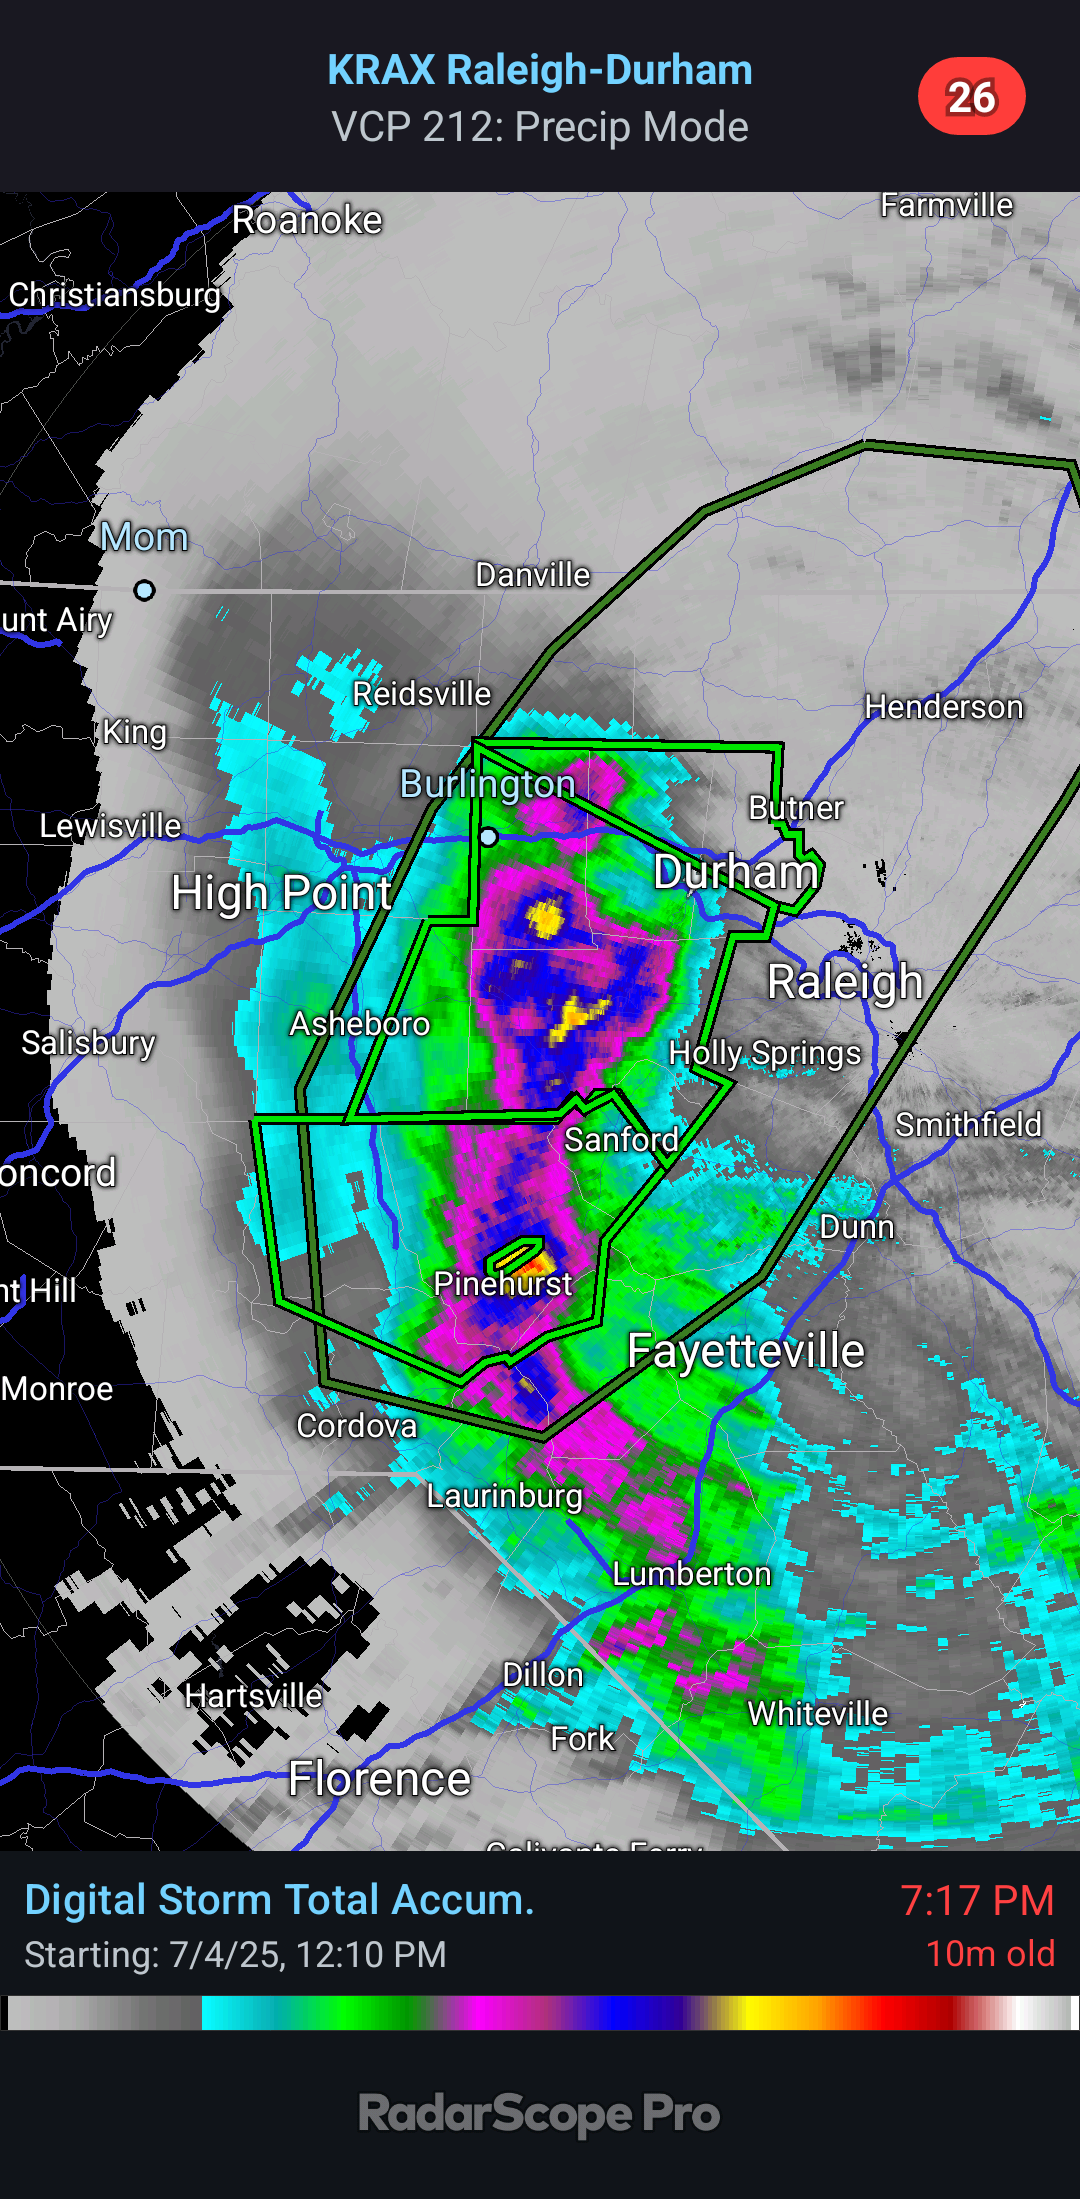
I don’t see a color/amounts guide, but this clearly shows where the heaviest has already fallen. I read that some areas have already gotten 8-10”!

-
BULLETIN - EAS ACTIVATION REQUESTED FLASH FLOOD WARNING NATIONAL WEATHER SERVICE RALEIGH NC 704 PM EDT SUN JUL 6 2025 THE NATIONAL WEATHER SERVICE IN RALEIGH HAS ISSUED A * FLASH FLOOD WARNING FOR... NORTHEASTERN ALAMANCE COUNTY IN CENTRAL NORTH CAROLINA... DURHAM COUNTY IN CENTRAL NORTH CAROLINA... NORTHERN ORANGE COUNTY IN CENTRAL NORTH CAROLINA... * UNTIL 1000 PM EDT. * AT 704 PM EDT, DOPPLER RADAR INDICATED THUNDERSTORMS PRODUCING HEAVY RAIN ACROSS THE WARNED AREA. UP TO 3 INCHES OF RAIN HAVE FALLEN. FLASH FLOODING IS ONGOING OR EXPECTED TO BEGIN SHORTLY. HAZARD...FLASH FLOODING CAUSED BY THUNDERSTORMS. SOURCE...RADAR. IMPACT...FLASH FLOODING OF SMALL CREEKS AND STREAMS, URBAN AREAS, HIGHWAYS, STREETS AND UNDERPASSES AS WELL AS OTHER POOR DRAINAGE AND LOW-LYING AREAS. * SOME LOCATIONS THAT WILL EXPERIENCE FLASH FLOODING INCLUDE... DURHAM, HILLSBOROUGH, ROUGEMONT, SCHLEY, ENO RIVER STATE PARK, BAHAMA, LAKE MICHIE, CARR, AND UNION RIDGE.
-
BULLETIN - EAS ACTIVATION REQUESTED FLASH FLOOD WARNING NATIONAL WEATHER SERVICE RALEIGH NC 656 PM EDT SUN JUL 6 2025 THE NATIONAL WEATHER SERVICE IN RALEIGH HAS ISSUED A * FLASH FLOOD WARNING FOR... A DAM FAILURE OF A FARM POND AT THE HEAD OF JOES FORK IN... CENTRAL MOORE COUNTY IN CENTRAL NORTH CAROLINA... * UNTIL 1245 AM EDT. * AT 656 PM EDT, LOCAL LAW ENFORCEMENT REPORTED THE IMMINENT FAILURE OF THE FARM POND DAM. HAZARD...LIFE THREATENING FLASH FLOODING FROM THE IMMINENT FAILURE OF A FARM POND A THE HEAD OF JOES FORK. SOURCE...LAW ENFORCEMENT REPORTED. IMPACT...LIFE THREATENING FLASH FLOODING POSSIBLE FOR AREAS DOWNSTREAM FROM THE FARM POND AT THE HEAD OF JOES FORK. * THE NEAREST DOWNSTREAM LOCATION IS MAIN STREET BETWEEN RICHMOND ST AND ALSTON DR IN TAYLORTOWN. ROADS ALONG AND ADJACENT TO JOES FORK MAY BECOME FLOODED AND IMPASSABLE. PRECAUTIONARY/PREPAREDNESS ACTIONS... IF YOU ARE IN LOW LYING AREAS ALONG JOES CREEK BETWEEN TAYLORTOWN AND WHISPERING PINES YOU SHOULD MOVE TO HIGHER GROUND IMMEDIATELY. NEVER DRIVE THROUGH FLOODED AREAS.
-
This is bad, folks, especially for areas west of the Fayetteville to Raleigh corridor, where very heavy rains have fallen: BULLETIN - EAS ACTIVATION REQUESTED FLASH FLOOD WARNING NATIONAL WEATHER SERVICE RALEIGH NC 709 PM EDT SUN JUL 6 2025 THE NATIONAL WEATHER SERVICE IN RALEIGH HAS EXTENDED THE * FLASH FLOOD WARNING FOR... NORTHWESTERN HOKE COUNTY IN CENTRAL NORTH CAROLINA... LEE COUNTY IN CENTRAL NORTH CAROLINA... MONTGOMERY COUNTY IN CENTRAL NORTH CAROLINA... MOORE COUNTY IN CENTRAL NORTH CAROLINA... NORTHEASTERN RICHMOND COUNTY IN CENTRAL NORTH CAROLINA... * UNTIL 1115 PM EDT. * AT 709 PM EDT, DOPPLER RADAR INDICATED THE HEAVY RAIN HAS LARGELY ENDED, HOWEVER EARLIER THUNDERSTORMS PRODUCED UP TO 7 INCHES OF OVER MOORE COUNTY. FLOODING IS ONGOING. HAZARD...FLASH FLOODING CAUSED BY THUNDERSTORMS. SOURCE...RADAR. IMPACT...FLASH FLOODING OF SMALL CREEKS AND STREAMS, URBAN AREAS, HIGHWAYS, STREETS AND UNDERPASSES AS WELL AS OTHER POOR DRAINAGE AND LOW-LYING AREAS. * SOME LOCATIONS THAT WILL EXPERIENCE FLASH FLOODING INCLUDE... SANFORD, SOUTHERN PINES, TROY, CARTHAGE, PINEHURST, ABERDEEN, BISCOE, HOFFMAN, WHISPERING PINES, PINEBLUFF, ROBBINS, FOXFIRE, STAR, CANDOR, TAYLORTOWN, VASS, CAMERON AND NORMAN.
-
Maybe so, but keep in mind that H5 forecasts are sometimes pretty lousy, themselves.
-
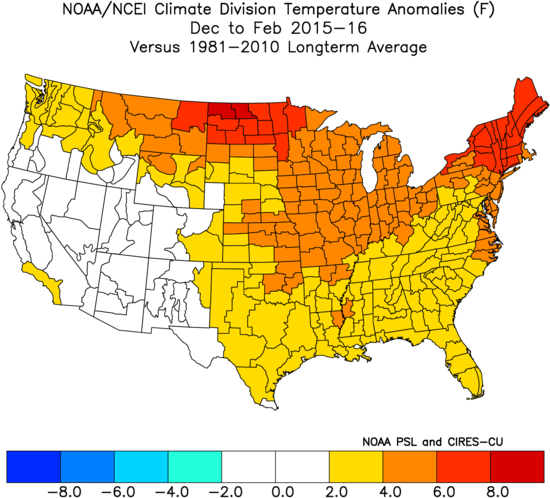
Unfortunately, the best I’ve found archived is the 0.5 month lead like I posted. They did pretty well in Nov of 2015 for DJF 2015-6: I give them a B for the US as a whole -They did so-so in Nov 2016 for DJF 2016-7: my grade C for US overall -NOAA did well in 11/2017 for DJF 2017-8: A -They were absolutely awful in 11/2018 for 2018-9: F -2019-20 mediocre at best: C -2020-1 poor: D -2021-2 pretty good: B -2022-3 pretty good: B -2023-4 very good: A -2024-5 lousy: D —————— Summary of my overall US grades of Nov NOAA probabilities for DJF temps: 2013-4: C 2014-5: B 2015-6: B 2016-7: C 2017-8: A 2018-9: F 2019-20: C 2020-1: D 2021-2: B 2022-3: B 2023-4: A 2024-5: D Tally: A: 2 B: 4 C: 3 D: 2 F: 1 NOAA GPA for 0.5 month lead of last 12 DJF for US as a whole: 2.3/C+ (not bad)

-
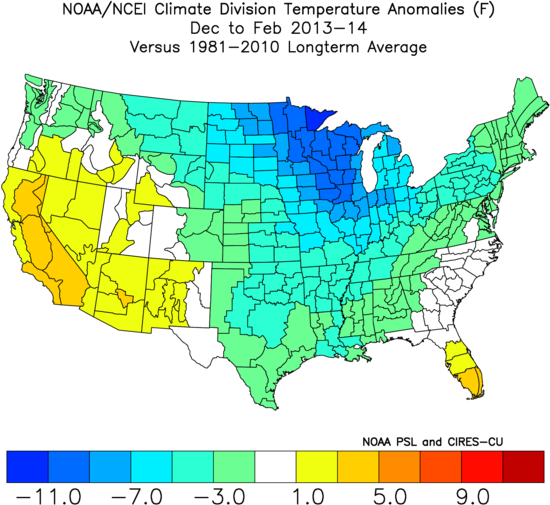
NWS 11/15/2013 probabilities for DJF 2013-4 weren’t all that telling as they underdid the prospects for widespread cold though they hinted ok at where the coldest and warmest ended up being:

-
NWS DJF 2014-15 probabilities released in 11/2014: best cold chances centered in south Actual 2014-5 DJF vs 1981-2010: coldest in NE not south, which was only slightly BN

-
Does anyone know if archived Cansips seasonal forecasts are available somewhere so we can easily see how they’ve done overall?
-
If someone had the time, they could go through AmericanWx threads for each winter and find CANSIPS forecast maps (however far back they go) and compare to what verified. Any volunteers?
-
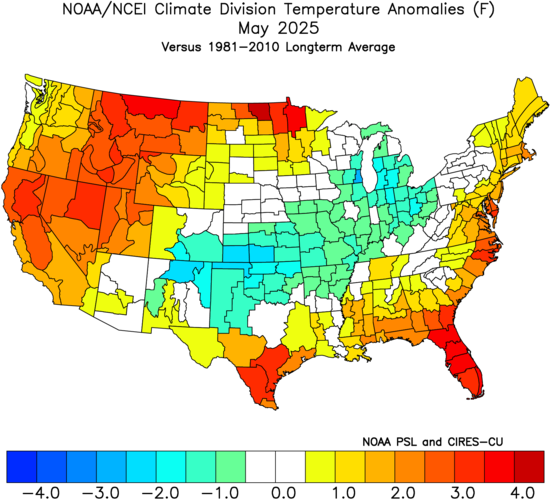
Hey Mitch, I’m confident that you realize that a model bias in whatever direction doesn’t mean it’s almost never going to miss in the opposite direction. A typical model bias could be something like verifying consistent with the bias 65% of the time while verifying the opposing way 20% of the time and being close 15% of the time. For example, the April 30th CANSIPS forecast for May was actually too warm, especially in Midwest/OH Valley/NE (though a bit too cool E VA S to FL): 4/30/25 CANSIPS for May ‘25 (in C vs 1981-2010): Actual May ‘25 (in F) vs 1981-2010: But the 2/28/25 CANSIPS verified as being significantly too cold for Mar ‘25 vs the reality of a very warm month. It was mainly warmer than normal but not nearly warm enough in most of the E US. Whereas CANSIPS was much too warm in Jan and too warm in Feb, it was much too cold in Dec.

-
Chris, Very well said about model biases! I couldn’t agree with you more. When significant clearcut cold biases are identified, it isn’t cherry picking to point out a much too cold model verification. If a model is too cold and has too low H5 hts in the E 1/2 of the US, say, 75-80% of the time, it isn’t cherry picking. The same could be said for any identified clear cut biases for any model.
-
Thanks, Charlie! Yes, I recall you mentioning the surface winds being higher this year vs last thus resulting in cooling from upwelling. Regardless, I think it’s important to always expose JB when he spreads misinfo about underwater seismic being the main factor in ocean warming and now cooling. I don’t expose it and other stuff like this because I necessarily agree with it. However, sometimes I like being reminded of the true explanation. Also, I expose it to show how often it’s being spouted as well as to generate responses like yours to keep others informed who are just reading this stuff from JB for the first time of how far off JB is. Thus, I expect to repost more of this JB nonsense as he continually posts it in the near future.
-
BULLETIN Tropical Storm Chantal Intermediate Advisory Number 6A NWS National Hurricane Center Miami FL AL032025 200 AM EDT Sun Jul 06 2025 ...CHANTAL A LITTLE STRONGER AND CLOSE TO LANDFALL ALONG THE SOUTH CAROLINA COAST... ...FLASH FLOODING CONCERNS INCREASE AS RAINBANDS MOVES ONSHORE... SUMMARY OF 200 AM EDT...0600 UTC...INFORMATION ---------------------------------------------- LOCATION...33.2N 78.8W ABOUT 75 MI...115 KM ENE OF CHARLESTON SOUTH CAROLINA ABOUT 85 MI...140 KM SW OF WILMINGTON NORTH CAROLINA MAXIMUM SUSTAINED WINDS...60 MPH...95 KM/H PRESENT MOVEMENT...N OR 350 DEGREES AT 8 MPH...13 KM/H MINIMUM CENTRAL PRESSURE...1002 MB...29.59 INCHES Recent aircraft and land-based radar velocity data indicate that maximum sustained winds have increased to near 60 mph (95 km/h) with higher gusts. Little change in strength is expected before landfall, with rapid weakening forecast after landfall. Tropical-storm-force winds extend outward up to 140 miles (220 km) from the center. Within the past hour, Springmaid Pier in South Carolina reported a sustained wind of 47 mph (76 km/h) gusting to 56 mph (90 km/h). The estimated minimum central pressure based on Air Force dropsonde data is 1002 mb (29.59 inches).
-
Posted just after 1AM in SE subforum by someone visiting N Myrtle Beach, he said this at ~1AM as it’s gotten quite stormy there (consistent with the radar): “Hello everyone, I normally post on the New England forum however I am in North Myrtle Beach and the weather has quickly deteriorated to heavy squalls and the wind has increased considerably in the last 30 minutes from an estimated 10 to 15 miles an hour to 20 to 25 with a couple of gusts that have been 40mph at least, I don’t have an anemometer however I think that is a pretty close estimate.”
-
As Barry posted, flash flooding is the biggest concern from Chantal. This covers NE SC and SE NC. The main area of solid rain is just entering these areas:URGENT - IMMEDIATE BROADCAST REQUESTED FLOOD WATCH NATIONAL WEATHER SERVICE WILMINGTON NC 1250 PM EDT SAT JUL 5 2025 NCZ099-109-110-SCZ054-058-059-061215- /O.NEW.KILM.FA.A.0002.250705T1700Z-250708T0000Z/ /00000.0.ER.000000T0000Z.000000T0000Z.000000T0000Z.OO/ COLUMBUS-INLAND BRUNSWICK-COASTAL BRUNSWICK-COASTAL HORRY-CENTRAL HORRY-NORTHERN HORRY- INCLUDING THE CITIES OF MYRTLE BEACH, LONG BEACH, SHALLOTTE, OAK ISLAND, AYNOR, LONGS, SOUTHPORT, LORIS, BUCKSPORT, CHADBOURN, BOILING SPRING LAKES, GARDEN CITY, SOCASTEE, SUNSET BEACH, GREEN SEA, NORTH MYRTLE BEACH, LELAND, WHITEVILLE, LITTLE RIVER, TABOR CITY, LAKE WACCAMAW, AND CONWAY 1250 PM EDT SAT JUL 5 2025 ..FLOOD WATCH IN EFFECT THROUGH MONDAY EVENING * WHAT...FLASH FLOODING CAUSED BY EXCESSIVE RAINFALL IS POSSIBLE. * WHERE...PORTIONS OF SOUTHEAST NORTH CAROLINA, INCLUDING THE FOLLOWING AREAS, COASTAL BRUNSWICK, COLUMBUS AND INLAND BRUNSWICK AND NORTHEAST SOUTH CAROLINA, INCLUDING THE FOLLOWING AREAS, CENTRAL HORRY, COASTAL HORRY AND NORTHERN HORRY. * WHEN...THROUGH MONDAY EVENING. * IMPACTS...EXCESSIVE RUNOFF MAY RESULT IN FLOODING OF RIVERS, CREEKS, STREAMS, AND OTHER LOW-LYING AND FLOOD-PRONE LOCATIONS. * ADDITIONAL DETAILS... - HEAVY RAIN FROM TROPICAL STORM CHANTAL WILL INCREASINGLY EFFECT THE AREA LATE TONIGHT INTO SUNDAY. - WEATHER.GOV/SAFETY/FLOOD PRECAUTIONARY/PREPAREDNESS ACTIONS... BE ESPECIALLY CAUTIOUS AT NIGHT WHEN IT IS HARDER TO RECOGNIZE THE DANGERS OF FLOODING. YOU SHOULD MONITOR LATER FORECASTS AND BE PREPARED TO TAKE ACTION SHOULD FLASH FLOOD WARNINGS BE ISSUED.
-
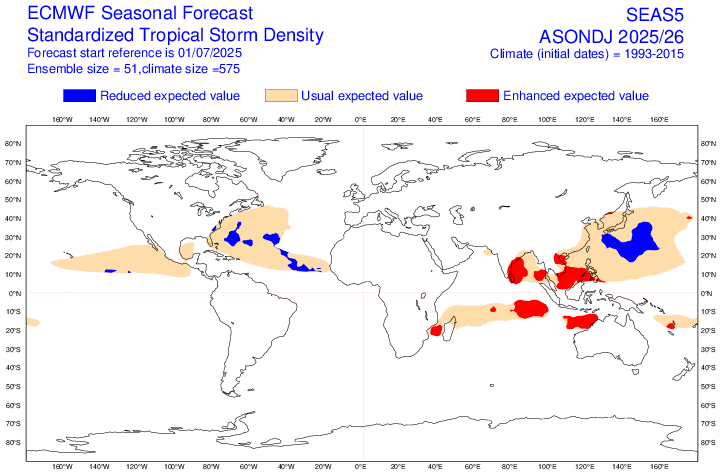
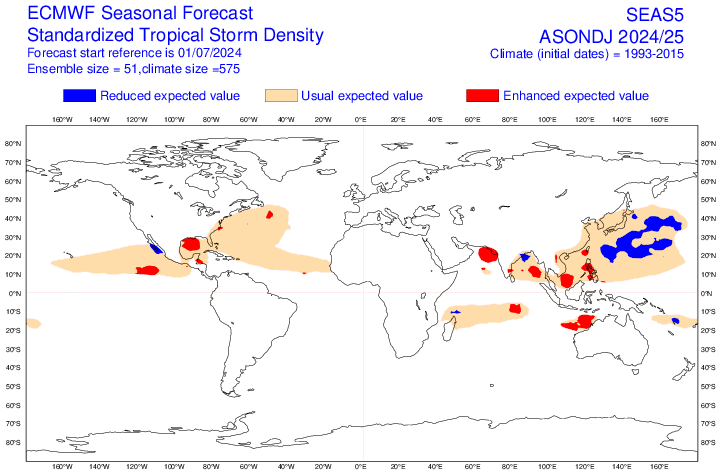
Today the new monthly Euro seasonal outlook was released for August and beyond in the ATL basin. Compared to the prior monthly forecast, which was near the avg for the active period 1993-2015 for # of TS+/# of H and very slightly above the avg ACE, the new one is very slightly less active with very slightly below the 1993-2015 avg for # of TS+/# of H and right at the active period’s ACE avg. It’s forecasting 6.0 hurricanes vs a 6.7 avg. Last year at this time, it forecasted 8.4 of them for the same period in 2024. 2024 actually had 11 for July+. So, though beside my point, it wouldn’t surprise me if the 6 is a good bit too low especially if we end up with weak La Nina per RONI I predicted 9 H for 2025. The distribution of storms is similar to the prior forecast, which again suggests less activity from the NE Caribbean to Bahamas/FL/SE US/E Gulf vs last year’s horrendous season. It suggests near to very slightly below the active 1993-2015 activity in those regions. So, that wouldn’t mean quiet but instead less active than a terrible year. Fingers crossed this will be right, especially for FL/SE US, because another year like 2024 could be a real disaster for especially FL’s home insurance industry. 7/1/25 Euro fcast for August+: 7/1/24 Euro fcast for August+:
-
BOULDER’S WINDS AREN’T WHAT THEY USED TO BE Extreme gusts in Boulder and Front Range appear to be diminishing JUN 24, 2025 - BY DAVID HOSANSKY Throughout the 1960s, 1970s, and 1980s, wind gusts routinely topped 120 miles per hour (mph), as measured at NSF NCAR’s Mesa Lab in the foothills above southwest Boulder. But the city’s extreme downslope winds have seemingly slackened in the last 30 years, with observed peak gusts rarely approaching 100 mph after 1995. More research is needed to flesh out the reason for the decrease in peak gusts. But the paper suggests it may have to do with changes in atmospheric conditions. As global temperatures have become warmer, tropical storms are pumping more heat high in the atmosphere, affecting upper-level winds in the midlatitudes that could be changing the combination of atmospheric ingredients that produce strong wind gusts during powerful downslope wind events. “The difference in instrument location is part of the story, but the bigger picture probably has to do with changing conditions in the atmosphere,” https://news.ucar.edu/133028/boulders-winds-arent-what-they-used-be —————- Note that the year 1995 was stated as the cutoff point after which extreme gusts started to diminish. The +AMO/current active era/higher ACE for Atlantic tropical activity also started in 1995. Concurrently, the EPAC’s quieter ACE era started in 1995. Coincidence?
-
VORTEX DATA MESSAGE AL032025 A. 06/01:05:50Z B. 32.45 deg N 078.72 deg W C. 850 mb 1482 m D. 1005 mb E. 015 deg 12 kt F. NA G. NA H. 26 kt I. 212 deg 44 nm 00:51:30Z J. 317 deg 20 kt K. 212 deg 54 nm 00:48:30Z L. 51 kt M. 051 deg 40 nm 01:18:00Z N. 147 deg 55 kt O. 051 deg 42 nm 01:18:30Z P. 17 C / 1519 m Q. 20 C / 1522 m R. 16 C / NA S. 12345 / 8 T. 0.02 / 15 nm U. AF303 0303A CHANTAL OB 03 MAX FL WIND 55 KT 051 / 42 NM 01:18:
-
Per this in C: -Biggest warmings in 1 yr (per eyeballing) (all >0.2) 1. 2022 to 23 0.30 2. 1976 to 77 0.27 3. 1887 to 88 and 1956 to 57 0.24 5. 1929 to 30 0.21 -Biggest warmings in 2 yr 1. 2022 to 24 0.39 2. 1887 to 89 0.29 3. 2014 to 16 0.28 4. 1971 to 73, 1996 to 98, and 1956 to 58 0.27 7. 1904 to 06 and 1929 to 31 0.26
-
Last 10 yrs: Subtropical Pac: Subtropical ATL: ATL MDR: