

GaWx
-
Posts
19,027 -
Joined
Content Type
Profiles
Blogs
Forums
American Weather
Media Demo
Store
Gallery
Everything posted by GaWx
-
2026-2027 Super El Nino
GaWx replied to Stormchaserchuck1's topic in Weather Forecasting and Discussion
After rising to -0.19 on June 24th, the WCS daily PDO has since plunged and is as of July 9th down to -1.50, which is the lowest daily PDO since way back on Nov 8th!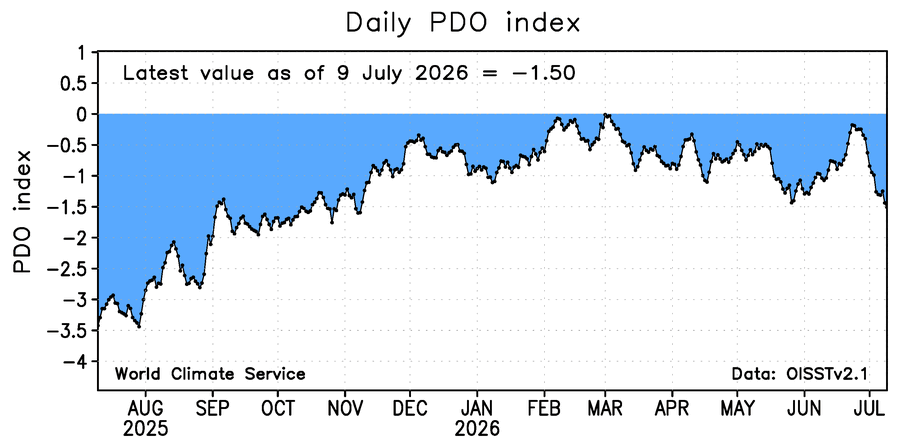
-
2026-2027 Super El Nino
GaWx replied to Stormchaserchuck1's topic in Weather Forecasting and Discussion
The TAO buoy data, including the Dateline data found at the links below, totally confirms Roundy’s noting of the lack of a consistent 30C isotherm E of the Dateline in 1997 when considering SSTs along the 180 and 170W longitudes and comparing those to 1997 to 2026. But it’s also important to keep in mind that there’s been a large amount of GW since 1997. So, that by itself gives 2026 a significant advantage. That’s of course why relative measures have been incorporated in products by NOAA and some others worldwide. That being said, this isn’t meant to minimize the significance of what Roundy said as it’s still a big deal! That’s the beauty of the SOI. It doesn’t appear to be substantially affected by GW and thus the comparison to past years. TAO buoy historical data: https://www.pmel.noaa.gov/cache-tao/sb1/deliv/data1897934/sst5s180w_dy.ascii https://www.pmel.noaa.gov/cache-tao/sb1/deliv/data1897934/sst0n180w_dy.ascii -
2026-2027 Super El Nino
GaWx replied to Stormchaserchuck1's topic in Weather Forecasting and Discussion
Thanks, Adam. So, Long Paddock after ~a week finally came back to updating its daily SOIs. This is what I earlier posted about this: In doing so, it also retroactively changed some dailies prior to July 3rd. What’s most interesting is that those changes changed what had been 2 small positives to negatives: June 18th/19th changed from +4/+1 to -4/-4. Based on the original June 18th release of +4, a 37 day -SOI streak had apparently ended June 18th. However, with these changes, it didn’t and thus we’re in a very long -SOI streak that’s now at a whopping 62 days and is still going strong! How does this compare to the longest back to 1991? -100 days in 1998 -72 days in 1997 -66 days in 2015 -65 days in 2023 -62 days and counting 2026 -
I’d love for this to be true. However, unfortunately: The administration has a new climate change office. It’s headed by a climate critic. The office that produces the National Climate Assessment has been reconstituted, after the administration gutted it last year. https://www.politico.com/news/2026/07/09/the-administration-has-a-new-climate-change-office-its-headed-by-a-climate-critic-00990916 ————————— Spreading climate misinformation is fast becoming a shortcut to popularity across right-wing media. This man’s rise proves it. Matthew Wielicki makes baseless claims about climate change and is now a budding star in the climate denial community https://www.mediamatters.org/climate-deniers/spreading-climate-misinformation-fast-becoming-shortcut-popularity-across-right
-
2026-2027 Super El Nino
GaWx replied to Stormchaserchuck1's topic in Weather Forecasting and Discussion
Thanks, Chris. Wow! 1. Am I correct in assuming this 0Z Euro map referring to record high H5 for 6Z of 7/14/26 centered on the N Plains is for ALL dates rather than just for July 14th? 2. Do you have a link to a source for record highest and lowest H5 for all dates for any location? -
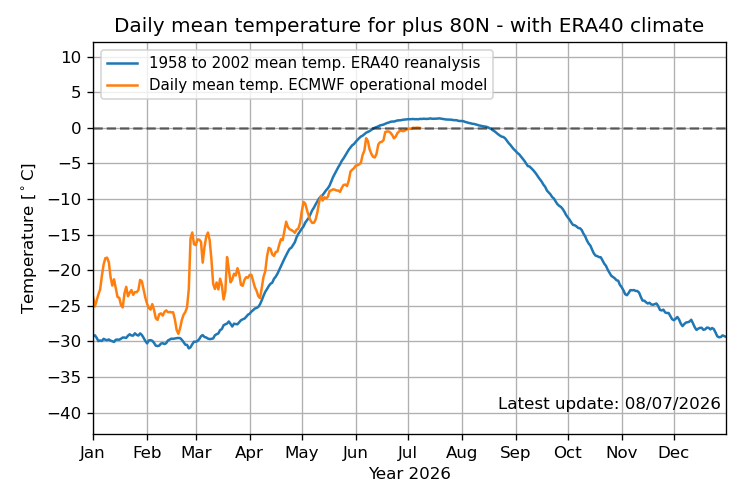
Thanks, Chris. From that ECMWF “data information sheet” link, the 80N+ mean is strongly biased toward the portion closer to 90N and thus shouldn’t be used for determining actual mean. I’m educatedly guessing that that’s the reason for its cold bias. OTOH, it also says comparing one year to another, which I’ve also been doing, can still be done: “Since the data are gridded, it is straightforward to deduce the average temperature North of 80 degree North. However, since the model is gridded in a regular 0.5 degree grid, the mean temperature values are strongly biased towards the temperature in the most northern part of the Arctic! Therefore, do NOT use this measure as an actual physical mean temperature of the arctic. The 'plus 80 North mean temperature' graphs can be used for comparing one year to an other.”
-
2026-2027 Super El Nino
GaWx replied to Stormchaserchuck1's topic in Weather Forecasting and Discussion
Based on my own look just now at the comparison of anomalies in the 4 Nino regions, I have only 4 clearcut Modoki El Niño events since 1950: 1. 1968-9: Month……..1+2……3……3.4……4 Nov………-0.1……+0.1….+0.5…+0.4 Dec………+0.2….+0.4….+0.7….+0.6 Jan………-0.2……+0.5…..+1.0….+0.9 Feb……..-0.8…….+0.3…..+1.1…….+1.1 Mar……..+0.3……+0.2……+0.5.…+0.6 2. 1977-8: not as Modoki as 68-9 Month……..1+2……3……3.4……4 Nov……….-0.5…..+0.2….+0.5…+0.3 Dec……….-0.6…..+0.3….+0.7….+0.4 Jan……….-0.4…..+0.1…..+0.6…..+0.4 Feb……….-0.4…...0.0……+0.3…..+0.2 Mar……….-1.2……-0.5…..-0.2…..-0.1 3. 2004-5: the most Modoki Month……..1+2……3……3.4……4 Nov……...+0.7…..+0.6…+0.7….+0.8 Dec……..+0.4……+0.7….+0.7….+0.9 Jan……...0.0……..+0.3…..+0.7….+0.9 Feb……..-0.9…….-0.1…….+0.4…..+0.7 Mar……..-1.5…….-0.1…….+0.5……+0.6 4. 2014-5: 2nd most Modoki Month……..1+2……3……3.4……4 Nov……….+0.8….+0.8…+0.8…+0.7 Dec………+0.4….+0.7…+0.7….+0.8 Jan………-0.2…..+0.4…+0.5….+0.8 Feb……..-0.5…..+0.1….+0.4….+0.9 Mar…….+0.1…..+0.1….+0.5…..+0.9 So, based on the above, the most Modoki (W based) El Niño events since 1950 were (starting from strongest): 1. 2004-5 2. 2014-5 3. 1968-9 4. 1977-8 Based on this, it appears to me that regarding wintry precip in El Niño seasons, the SE (based on ATL and RDU) seems to do somewhat better with C based (3.4 with clearly the warmest anomalies) than Modoki/W based. If I’m not mistaken, the NE tends to do better with W based (Modoki) over C based. Please correct me if that’s wrong. Interesting! https://www.cpc.ncep.noaa.gov/data/indices/ersst5.nino.mth.91-20.ascii -
2026-2027 Super El Nino
GaWx replied to Stormchaserchuck1's topic in Weather Forecasting and Discussion
Indeed! Yeah, Chuck, it’s confusing because when I searched for it, I first found the new FB post, dated 7/2/26. At first it looked on the surface like a new record/first time over 100 in Arctic Circle based on the 1st 2 paragraphs. But then the 3rd paragraph said that on June 20, 2020, it hit 38C/100.4F. Then I was curious to see the comments below. The first one incorrectly said that was Antarctica lol. Then the 2nd comment said that it was 6 years ago and was critical of the story being posted now for no good reason other than to confuse. -
2026-2027 Super El Nino
GaWx replied to Stormchaserchuck1's topic in Weather Forecasting and Discussion
“In 2020, the town of Verkhoyansk, Russia, reached a temperature of 100.4 degrees Fahrenheit, the highest temperature ever recorded in the Arctic Circle.” https://www.upi.com/amp/Top_News/2026/06/20/On-This-Day-Arctic-Circle-reaches-record-setting-100-degrees/2481781913298/ -
2026-2027 Super El Nino
GaWx replied to Stormchaserchuck1's topic in Weather Forecasting and Discussion
Hey Chuck, Do you have a link? The only thing I saw was a story from just a few days ago but it said that on 6/20/20 it hit 100.4F at Verkhoyansk, Russia (Siberia): https://www.facebook.com/story.php?story_fbid=1023286790456624&id=100083259374691 -
2026-2027 Super El Nino
GaWx replied to Stormchaserchuck1's topic in Weather Forecasting and Discussion
July 8th mean 80N+ temp. (C) per DMI: 2026: 273.1 (barely below freezing and lowest on record (to 1958)) 2025: 274.1 2024: 274.5 2023: 274.2 2022: 273.8 2021: 273.9 2020: 274.3 2019: 274.3 https://download.dmi.dk/pub/plus80N_temperatureindex/ -
Very strong storm incoming! Very windy and fierce looking skies just to west! Small limbs falling! A few big raindrops. So far just a few big drops. This batch formed per radar from collision of inland outflow and seabreeze boundaries. Cool stuff! Rarely a dull moment this time of year. Edit 9:20 PM: There was never more than a trace from those aforementioned few drops at my place. However, there was heavy rain for a pretty short period from the NW part of the county to downtown and also from Skidaway and Wilmington Islands to Tybee. In addition, much of the coastal counties of S SC got plentiful rain.
-
After 3 99s this summer so far, KSAV had 100 today!
-
Thanks, Chris Keep in mind that even when assuming a bias, this is the coldest chart late May through early July overall for 80N+ compared to the same charts back to 1958. So, isn’t it an apples to apples comparison if one says it’s the coldest DMI chart for 80N for this period?
-
2026-2027 Super El Nino
GaWx replied to Stormchaserchuck1's topic in Weather Forecasting and Discussion
Per TAO, 5 day averaged SSTs of 30C+ reached not only 180 but also to 170W at 0N as early as April 22nd of 2015: Location: 0N 170W 22 Apr 2015 to 22 May 2015 ( 7 times, 1 blocks) Gen. Date Jul 9 2026 Units: Sea Surface Temperature (C), -9.99 = missing Time: 1200 22 Apr 2015 to 1200 22 May 2015 (index 1 to 7, 7 times) Depth (M): 1 QUALITY YYYYMMDD HHMM SST Q 20150422 1200 30.04 1. 20150427 1200 -9.99 0 20150502 1200 -9.99 0 20150507 1200 29.85 1 20150512 1200 29.89 1 20150517 1200 29.91 1 20150522 1200 30.06 1 Time: 1200 3 Dec 2015 to 1200 2 Jan 2016 (index 49 to 55, 7 times) Depth (M): 1 QUALITY YYYYMMDD HHMM SST Q 20151203 1200 30.62 1 20151208 1200 30.68 1 20151213 1200 30.76 1 20151218 1200 30.53 1 20151223 1200 30.26 1 20151228 1200 30.29 1 20160102 1200 30.23 1 —————— This year it was still <29C in April and took til June 1st to exceed 30C although it’s been mainly rising since: Location: 0N 170W 2 Apr 2026 to 6 Jul 2026 ( 20 times, 1 blocks) Gen. Date Jul 9 2026 Units: Sea Surface Temperature (C), -9.99 = missing Time: 1200 2 Apr 2026 to 1200 6 Jul 2026 (index 1 to 20, 20 times) Depth (M): 1 QUALITY YYYYMMDD HHMM SST Q 20260402 1200 28.01 2 20260407 1200 28.14 2 20260412 1200 28.35 2 20260417 1200 28.65 2 20260422 1200 28.74 2 20260427 1200 28.94 2 20260502 1200 29.17 2 20260507 1200 29.36 2 20260512 1200 29.34 2 20260517 1200 29.67 2 20260522 1200 29.59 2 20260527 1200 29.82 2 20260601 1200 30.05 2 20260606 1200 30.38 2 20260611 1200 30.42 2 20260616 1200 30.59 2 20260621 1200 30.58 2 20260626 1200 30.56 2 20260701 1200 30.55 2 20260706 1200 30.46 2 https://www.pmel.noaa.gov/tao/data_deliv/deliv-nojava.html @snowman19 -
2026-2027 Super El Nino
GaWx replied to Stormchaserchuck1's topic in Weather Forecasting and Discussion
The WCS daily PDO has plunged from -0.19 on June 24th to -1.43 just 2 weeks later: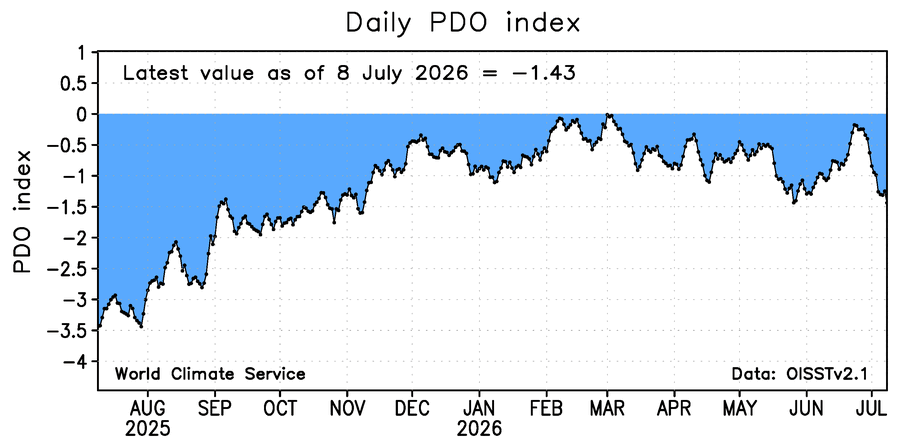
-
2026-2027 Super El Nino
GaWx replied to Stormchaserchuck1's topic in Weather Forecasting and Discussion
Dips: below -26 in ‘25, ‘24, ‘22, ‘18, ‘15, ‘12, ‘10, ‘07, ‘05, ‘96, ‘94, ‘84; But none in 1983-1948: why? -
Meanwhile, per DMI charts back to 1958, the mean temp. for the Arctic N of 80N continues being the coldest on record (I’ve been looking at all years’ charts) thus continuing the coldest overall there since the 2nd half of May:
-
2026-2027 Super El Nino
GaWx replied to Stormchaserchuck1's topic in Weather Forecasting and Discussion
I agree strongly. Out of the last 10 moderate or stronger El Niño DJFs, which goes back to 1982-3, 90% (9) had all 3 months +0.25+! The only one that didn’t was the last one, 2023-4. That one still had 2 of the 3 at +0.25+ with Feb at +0.09. March of ‘24 went back up to +0.45. Since 1982-3, 90% (9) of Marches were +0.25+ with only March of 2003 not as it was neutral (-0.07). In contrast to 1982-3+, only 1 of the prior 7 moderate or stronger El Niño DJFs had all 3 months at +0.25+! -
SPOTTER REPORTS NATIONAL WEATHER SERVICE CHARLESTON SC 352 PM EDT WED JUL 08 2026 THE FOLLOWING ARE UNOFFICIAL OBSERVATIONS TAKEN BY VARIOUS QUALITY CONTROLLED OBSERVATIONS SYSTEMS FROM ACROSS SOUTHEAST SOUTH CAROLINA AND SOUTHEAST GEORGIA. *************MAXIMUM HEAT INDEX (113F AND ABOVE)************* LOCATION MAXIMUM TIME/DATE COMMENTS HT INDEX MEASURED (DEG F) SOUTH CAROLINA ..BEAUFORT COUNTY BEAUFORT MCAS 114.0 256 PM 7/08 ASOS ..BERKELEY COUNTY HUGER 114.0 114 PM 7/08 MESONET WITHERBEE 113.0 1215 PM 7/08 OTHER FEDERAL ..CHARLESTON COUNTY AWENDAW/WAMBW 116.0 147 PM 7/08 OTHER FEDERAL CHARLESTON INTL ARPT 114.0 308 PM 7/08 ASOS CHARLESTON EXE ARPT 113.0 1255 PM 7/08 AWOS DOWNTOWN CHARLESTON 113.0 200 PM 7/08 OFFICIAL NWS OB. ..COLLETON COUNTY BENNETTS POINT 113.0 1200 PM 7/08 OTHER FEDERAL
-
2026-2027 Super El Nino
GaWx replied to Stormchaserchuck1's topic in Weather Forecasting and Discussion
Thanks, Adam. Note how much the WPAC has cooled from Korean Pen. to E of Japan! Also, check out the impressive N Atlantic cooling! That ATL cooling along with cooling tropics (-AMO trend) may be indicative of a major pattern change toward colder E US winters coming up. -
2026-2027 Super El Nino
GaWx replied to Stormchaserchuck1's topic in Weather Forecasting and Discussion
Moderate +NAO 1973 2 1 0.250 1973 2 2 0.252 1973 2 3 0.237 1973 2 4 0.525 1973 2 5 0.834 1973 2 6 0.944 1973 2 7 0.807 1973 2 8 0.672 1973 2 9 0.656 1973 2 10 0.718 1973 2 11 0.924 Moderate to strong +AO 1973 2 1 1.868 1973 2 2 1.709 1973 2 3 0.930 1973 2 4 0.511 1973 2 5 1.958 1973 2 6 2.915 1973 2 7 2.326 1973 2 8 1.437 1973 2 9 1.385 1973 2 10 1.560 Neutral to weak +PNA 1973 2 1 0.304 1973 2 2 0.161 1973 2 3 0.229 1973 2 4 0.295 1973 2 5 0.179 1973 2 6 -0.004 1973 2 7 -0.097 1973 2 8 0.154 1973 2 9 0.349 1973 2 10 0.166 Moderate to strong -EPO 1973 02 01 74.97 1973 02 02 -15.68 1973 02 03 -165.84 1973 02 04 -262.56 1973 02 05 -228.20 1973 02 06 -209.60 1973 02 07 -231.67 1973 02 08 -209.49 1973 02 09 -159.81 1973 02 10 -29.44 Neutral to weak +WPO 1973 02 01 247.35 1973 02 02 202.33 1973 02 03 119.68 1973 02 04 71.22 1973 02 05 36.31 1973 02 06 9.54 1973 02 07 -8.75 1973 02 08 -19.39 1973 02 09 0.37 1973 02 10 21.42 -
It’s still an oppressive 97.3 at my place with mostly sunny skies. I don’t know what the high was but my guess would be ~99 (about the hottest of the year so far) and HI’s way up there.
-
CSU 7/7/26 update: This forecast is predicting the weakest season since 2013. I wouldn’t at all mind a break here in the very hard hit SE overall since 2016. “We further reduce our 2026 Atlantic basin hurricane season forecast and now anticipate a well below-normal season. Moderate El Niño conditions are likely to intensify over the next few months, with a high potential for a strong El Niño for the peak of hurricane season. Sea surface temperatures across the Caribbean and tropical Atlantic are near their long-term averages. We anticipate the powerful El Niño being the dominant factor for the upcoming hurricane season, driving high levels of tropical Atlantic vertical wind shear. We are forecasting a well below-average probability for major hurricane landfalls along the continental United States coastline and in the Caribbean. As with all hurricane seasons, coastal residents are reminded that it only takes one hurricane making landfall to make it an active season. Thorough preparations should be made every season, regardless of predicted activity.” https://tropical.colostate.edu/Forecast/2026-07.pdf
-
Winter 2026-2027 Seasonal Outlook
GaWx replied to WinstonSalemArlington's topic in Southeastern States
I just posted this elsewhere: 1. Asheville temp. records go back to 1876 and thus include 1877-8. Whereas Dec was mild/AN at 43.6, Jan was actually snowy and cold/BN (35.2) and Feb was NN (39.8). So, DJF averaged 39.5, which is actually NN. In Jan, they had well above normal snow with 4” on the 4th and 4.5” on the 31st! They had a low of 7F on the 7th. So, I wonder why this source per your post said:The winter of 1877–1878 in North Carolina was remarkably warm, largely recognized as an exceptionally mild season brought on by a historic 'Super' El Niño event.This doesn’t at all jibe with this Asheville data and I haven’t found any data for any other locale in NC going that far back.Data from here: https://www.weather.gov/wrh/Climate?wfo=gsp —————2. Regarding other super-El Nino winters in the SE:-1888-8: Feb 1889 had a SE major snowstorm and was cold allowing for DJF to avg BN-1957-8: cold winter overall with cold in Jan and especially Feb. and was snowy overall, esp in Feb, which included deep SE-1965-6: cold winter overall thanks to quite cold in Jan and overall snowy in part of SE thanks to Jan/Feb-1972-3: historic ZR Jan N GA and vicinity; historic snowstorm Feb AL to NC, including deep SE; overall NN temps with BN Feb-1982-3: very snowy much of SE, including historic snow much of area in spring! ATL had biggest snowstorm as well as snowiest winter since 1939-40! It hasn’t been matched since! Overall NN temps.-1991-2: ATL and nearby had a major snowstorm in Jan. Otherwise it was a mild winter.-1997-8: NN temps overall with cold Dec, mild Jan, and NN Feb-2015-6: AN temps overall due to warmest on record Dec as JF were actually BN to NN—————In summary, -a super-Nino doesn’t point to an expected warm SE winter as only 2 of the 9 averaged mild in DJF. Only one, 1991-2, averaged mild throughout DJF.-Super El Niño winters tend to average mild in the N tier of the US, not the SE.-Dec will be favored to be AN as 6 of these 9 had a mild Dec, including the warmest on record-Jan/Feb averaged out will be favored to be BN with most of the 9 BN overall, with some quite cold months in some cases-AN wintry precip prospects are better than avg. All it takes is one major snow in the SE in many cases.-AN rainfall prospect is the best news of all due to the drought!


