GaWx
Members-
Posts
18,109 -
Joined
Content Type
Profiles
Blogs
Forums
American Weather
Media Demo
Store
Gallery
Everything posted by GaWx
-
My forecast has low 80s for Thu/Fri highs…yippee!
-
I got ~0.75” of rainfall from showers mid to late this afternoon with some heavy for a short period. This is the most I’ve gotten in a day since at the very least Jan 18th. The new mini-drainage system that was set up in the back portion of MBY seemed to do pretty well although the real tests will probably not come til spring and especially summer.
-
Thanks, Don 1. I felt that at a minimum that the wording wasn’t the best, possibly due to haste. I may follow up with him on that to get better clarification. 2. He did mention the effect on crop sizes from the variable of climate/wx being hard to separate out. Doesn’t that include the variable of temperature?
-
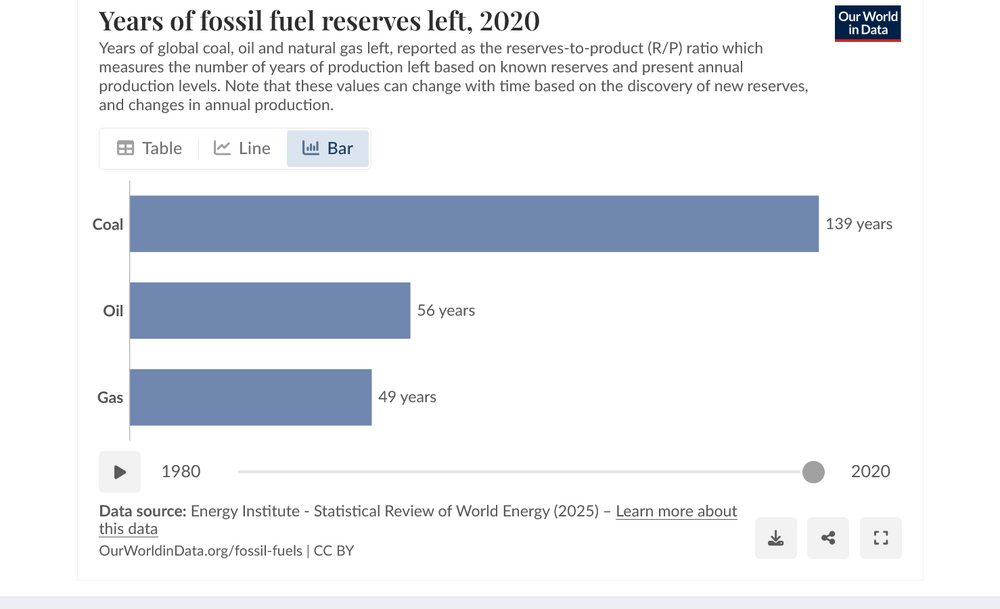
Thanks, Charlie. Here’s Mike’s response to your reply: These people remind me of MAGA, seriously. It's complete fake climate crisis RELIGION. CO2 below 1,000 parts per million is a massively beneficial gas. To compare it to when CO2 was numerous times higher that this [sic] is a strawman attack (assigning a position that doesn't exist and attacking that position instead of the REAL one). And to keep projected CO2's increase for another 100 years and to keep insisting that the residence time for today's CO2 in the atmosphere is hundreds of years lacks critical thinking based just on how we watch it DROP during the Northern Hemisphere's growing season every year. Ignoring the fact that fossils fuels are finite and will be running out well before then and the chances of us ever getting over 900 ppm, the optimal level for life/plants/crops is minuscule. So what if CO2 was X thousands of parts per million in the past???? That is NOT what will be happening from CO2 increasing this time. The highest reasonable projection is still BELOW the optimal level of 900 ppm. Regarding all the articles from so called authorities that climate change is already cutting back on food production: 100% nonsense. It's the exact opposite. With crops, we can't tell how much impact is from CO2, climate/weather, genetics, fertilizers, use of pesticides/herbicides(technology). When you change numerous variables at the same time, like we do with crops, it's impossible to separate the impact from each one on the outcome. However, we have 2 ways to address that with OBJECTIVE data which clearly speaks for the impact of photosynthesis by itself and for photosynthesis +climate change. 1. The impact of JUST adding CO2 and not changing anything else: Here is irrefutable evidence using empirical data to show that the increase in CO2 is causing a huge increase in crop yields/world food production. We can separate the CO2 effect out from other factors effecting [sic] crops and plants with many thousands of studies that hold everything else constant, except CO2. Observing and documenting the results of experiments with elevated CO2 levels tell us what increasing CO2 does to many hundreds of plants. Here's how to access the empirical evidence/data from the site that has more of it than any other. Please go to this link: http://www.co2science.org/data/data.php 2. But other human factors impact soybeans, including climate change that we can't separate out. That's ok because we have something that looks almost exclusively at the increase in CO2 and climate change as the main factors. Planet earth has been a huge open air experiment the past XX years. The objective results are striking. The impacts have been mostly from changes in photosynthesis and changes in the climate. Carbon Dioxide Fertilization Greening Earth, Study Finds https://www.nasa.gov/technology/carbon-dioxide-fertilization-greening-earth-study-finds/ In addition: Earth greening mitigates hot temperature extremes despite the effect being dampened by rising CO2 https://www.sciencedirect.com/science/article/pii/S2590332223005584 ++++++++++++++ Importantly, the indisputable science tells us that increasing CO2 allows plants/crops to be more drought tolerant(not the other way around). The reason is that plants open their stomata to get CO2 and while doing so, they transpire(lose water from their roots that get it from the soil) As CO2 increases, the stomata don't need to open as wide and this REDUCES water loss from their roots. It's rock solid agronomy/plant science. CO2 Enrichment Improves Plant Water-Use Efficiency https://www.masterresource.org/carbon-dioxide/co2-increased-water-use-efficiency/ +++++++++++++++= Despite me just PROVING the points with indisputable science above, this is what the very predictable response will be from people that posted to you previously with the same response they gave the first time: "Those are denier sources" NASA's satellite study showing the greening of the planet obviously can't be put in that category but CO2 Science and Dr. Craig Idso, an elite authority on plants and the impact of CO2/climate change, has been labelled a denier. Never mind everything he shows is backed up with empirical data and rock solid scientific principles, which is why I use that source(as an atmospheric scientist for 44 years). If he or anybody else, including me, contradicts the mainstream view on the climate crisis.........they are discredited as deniers no matter us [sic] using 2+2=4 science to prove that 2+2 is not 5.
-
CO2 is not “pollution” from my perspective. I never agreed with using that term for CO2 despite fully believing in AGW.
-
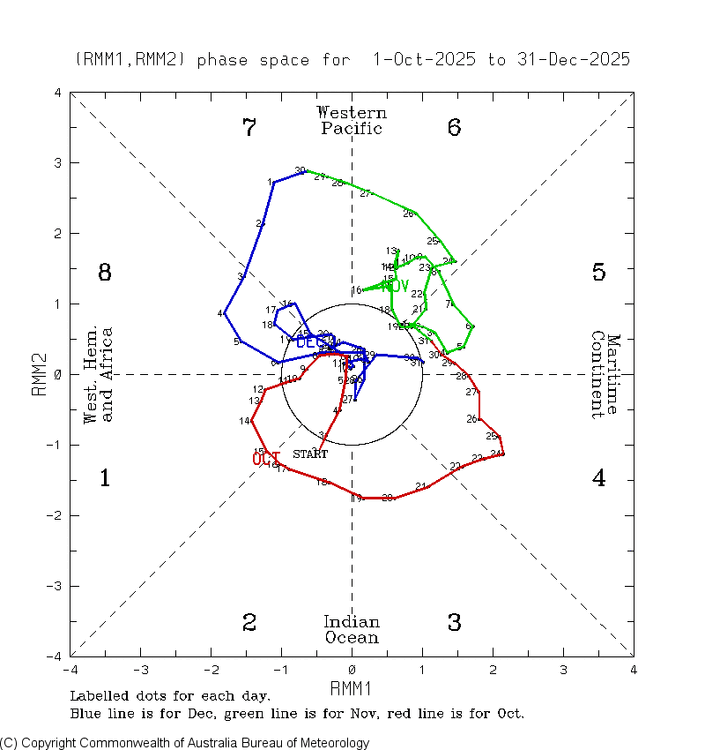
GEFS verified better than EPS for Dec. I prefer to describe it as less wrong than far more accurate but that’s just me: This is what actually verified: Dec ‘25 is in blue
-
Anthony absolutely did but at least he’s not denying it. And he’s absolutely right about it being forecasted (several times in fact). Here’s one of several ext-EPS runs forecasting a 30+ straight day phase 8: this one (12/3 ext-EPS run) had it at 32 days (12/3-1/3) and on top of that showing no sign of it ending on 1/3 thus being a great example of why the models should be taken with a grain for the MJO and in general
-
Thanks. Note that the new CANSIPS run’s SST anoms look pretty similar to those on the run posted above predicting Modoki for 23-4 in most locations worldwide fwiw.
-
Yesterday’s publicly available Bastardi video (“Saturday Summary”) didn’t at all talk about the upcoming mild E US (gee, I wonder why lol) and instead talked about the expected upcoming El Nino being a Modoki. He’s using CANSIPS SSTAs to predict that, which I feel is wrought with risk as it similarly predicted a Modoki El Niño for this past autumn last year at this time: What verified per this same model? A redeveloping La Niña: look how far off CANSIPS was! Here’s CANSIPS trying again for Modoki El Niño next autumn: will it verify this time or will it again bust? Opinions? Based on the following latest CANSIPS prog of ASO SST anoms, which he showed in his video, he’s going all-in on Modoki next hurricane season and continuing through winter: Based on this Modoki prog, JB is going for: -very active and threatening to US 2026 hurricane season using the highest impact on US El Niño seasons of 1969 and 2004 as analogs (which he considers Modoki) along with a very warm Atlantic with ACE of 140-180, 17-21 NS, 8-10 H, 3-5 MH, 1-3 US H landfalls, and 1-2 MH US landfalls -cold winter throughout much of Conus due to limited time spent in warm phases 4-7. He’s saying that 2023-4 was a warm flop only because models were wrong in predicting typical cold around Australia. It ended up warm there and in W Pac in general, which lead to a dominant +WPO instead of the progged -WPO. He said that warmth there was due to the “sudden impact of geothermal a couple of years ago”. He said SST anoms E of Australia rose an unprecedented 5 degrees from Nov to Jan, which he said had nothing to do with CO2 or solar. He expects none of the same as 23-24 this time with W Pac undersea seismic activity down and thus there instead being the typical cold around Australia during El Niño this fall/winter ————— My primary concerns with JB forecast: - Will it actually be Modoki? CANSIPS can’t be trusted for one thing. - 2004 and 1969 were weak Ninos per ONI/RONI. Will 2026-7 actually be a weak Nino per RONI? -JB tends to forecast the more threatening H season and cold E US winter scenarios and has even admitted to having a cold bias @snowman19@donsutherland1
-
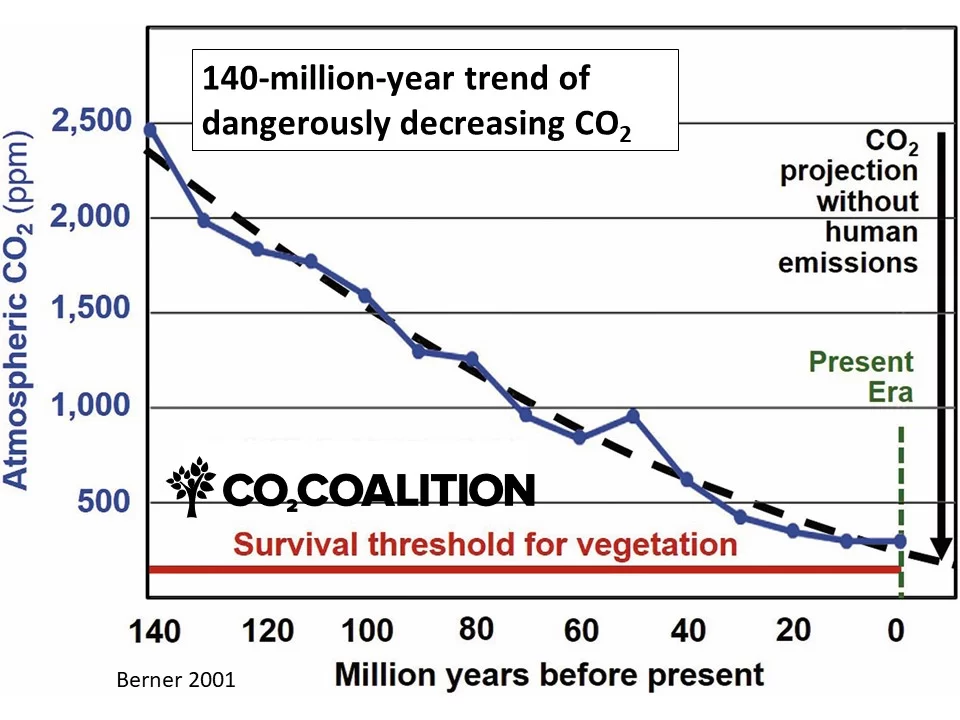
Hey Charlie, This is from yesterday from a very experienced pro met., Mike Maguire, who believes in AGW: Let me point out what is REALLY going to happen with high confidence: Fossil fuels are finite. There was only X amount of plants that died while life existed on this planet that got sequestered/buried in the ground and decomposed/concentrated into fossil fuels. At the rate that we are burning them, it won't be much longer before they start running out. BTW, all the CO2 we've been returning back into the atmosphere was there before as a beneficial gas and the building block for all of life. This scary false narrative of "CO2 is the highest its been in X zillion years" is intentionally meant to make people think there's something wrong with that, instead of receiving it as the profound gift that it's been for life on our massively greening planet. https://co2coalition.org/facts/140-million-year-trend-of-dangerously-decreasing-co2/ Anyways, back to the fact that fossil fuels will be running out with certainty and the horrific disaster that will occur to the planet and human beings when that happens, almost with certainty. We constantly hear that CO2 stays in the atmosphere for 100+ years and the carbon pollution that we are spewing into the atmosphere today, will be damaging the planet past 2100. Complete hogwash!!!!!!!!!! ————— Does anyone disagree with anything Mike said in this post? If so, what and why? He believes in AGW but feels it is net beneficial for the globe. I don’t agree with him because I have a bigger concern about sea level rise being that I’m not far from the coast and he’s a Midwesterner. But otherwise, what about his points about it continue to lead to increased greening of the planet? Also, he’s shown evidence that cold kills more than heat although I do wonder if that will eventually switch after enough warming.
-
February 2026 Medium/ Long Range Discussion: 150K Salary Needed to Post
GaWx replied to Weather Will's topic in Mid Atlantic
You’re welcome. It’s not just that though. As my example and examples that can be found on just about every run show, it literally has very heavy snow with these Gulf blobs when temperatures aren’t just a few degrees above 32 but rather as warm as ~40 degrees above 32! How can a major company let these Euro AIFS snow maps with this obvious major issue that’s as plain as day continue to be released before getting them fixed? -
February 2026 Medium/ Long Range Discussion: 150K Salary Needed to Post
GaWx replied to Weather Will's topic in Mid Atlantic
The WB Euro AIFS ensemble means are often the snowiest of the ens means due to having a true snowy bias likely resulting from an algorithm issue at WB although I suppose the issue could be internal at ECMWF (doubtful). This is most easily exhibited by the numerous times (every run) when individual members have blobs of heavy snow well out over the Gulf/Atlantic when temperatures are in the 60s-70s. Even Bastardi has noted this oddity about his company’s own Euro AIFS snow maps! These blobs even show up on all of the ens means although obviously lighter. Notice that no other end snow maps have this oddity. (This isn’t the first issue I’ve seen with WB maps by the way. For example, their Euro Weekly 2m maps are colder than the ecmwf in-house maps.) Example: member 46 (far right) getting heavy snow during hours 60-66 (6Z to 12Z on 1/22/26) on the 18Z 1/19/26 run 200 miles out into the Gulf while temperatures are above normal (70s)! While laughable, it is more importantly indicative of a significant snowy bias on its maps: Actually, this can be seen in subtropical regions throughout the globe. It even shows snow blobs now in Australia during their summer, for example! -
Per ecmwf (not WxBell): Today’s Bleaklies are, indeed, on the bleak side for Mar in most of the E US though NE is NN.
-
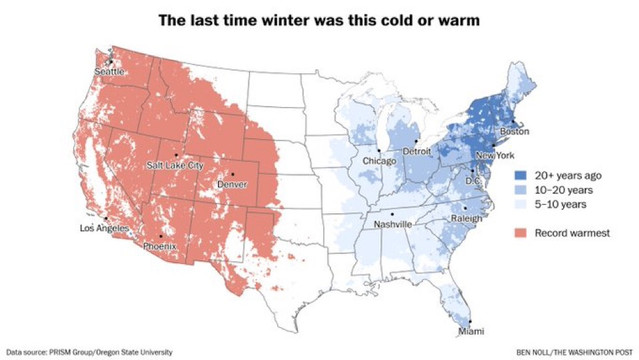
Good catch. But, GSO/RDU/New Bern were 33.3/35.7/35.2 (MB). Also, Greenville (NC), FAY, LUM, and ILM were MB. Yes, ATL was 46.4 (NN). AHN was 44.4 (NN). GVL was 39.4 (B). GSP was 41.0(B). CLT was 38.8 (B). Also, B were MYR, CHS, CAE, AGS, and SAV. I should have said N and E NC, specifically, for the “brutal” Feb 1-12. I just looked at SAV: averaging -1.5 for winter through 2/12 vs -0.4 prior winter. This makes 2025-6 the coldest thru 2/12 since 2010-1 there and in GSO meaning coldest in 10-20 years, which is close to what map has for those. Map has N GA incl ATL-AHN coldest in 5-10 years…I’m checking now……. AHN thru 2/12: 25-6: 45.4 24-5: 45.8 17-18: 44.8 Coldest in 5-10 is correct ATL thru 2/12: 2025-6: 49, 45.2, 46.4 46.99 2024-5: 44.7 (2), 59.1 47.04 So, ATL 25-6 barely colder than 24-5 thru 2/12 **20-21: 46.15 (2), 47.6 So, 20-1: 46.4 thru 2/12 meaning colder than 25/6 meaning 25-6 is coldest since 20-1 meaning coldest in 5 meaning map’s coldest in 5-10 correct @suzookfor ATL update just added
-
It’s because Feb 1-12 2026 has been brutal (coldest in many years) while Feb 1-12 of 2025 was the warmest in many decades in much of SE.
-
Check out today’s GEFS AO prog, a pretty notable change downward vs yesterday:
-
Hey Charlie, I don’t have any links to provide right now. I’m going off of what a pro met. has posted elsewhere a number of times for years. Also, don’t forget that it isn’t just the CO2 Fertilizer Effect that’s beneficial. It’s also the longer growing seasons.
-
Who broke the Bleaklies? Whereas I haven’t been able to get them all evening, I did look at the WxBell interpretation of them. That suggests they’ve cooled closer to the run from two days ago during several Bleaks fwiw. @MJO812 2/13/26 edit: Bleaklies were finally fixed at ecmwf site
-
Today was downright chilly! Looking forward to a pretty cold evening walk. Edit: The walk was very enjoyable in the near calm chill with mid 40s. Tomorrow will be another lovely day. Saturday will be a little warmer (~upper 60s high), but with still nice low dewpoints. These are the types of days I dream about during the long monotonous hot and humid summers here.
-
Some of the crop yield increases were likely helped by better technology, but not nearly all of it. GW/AGW have helped significantly with crop sizes, something often intentionally glossed over
-
Another positive effect of AGW/GW is regarding the world food supply due to the photosynthesis effect of CO2 as well as longer growing seasons. These favor larger crops/larger global food supply/less starvation. That shouldn’t be ignored in the full objective assessment of AGW/GW, which certainly has significant negative effects. However, there are some good things, too, like fewer deaths from cold as you said and fewer deaths from starvation. These good effects are often glossed over by those wanting to only emphasize the bad effects.
-
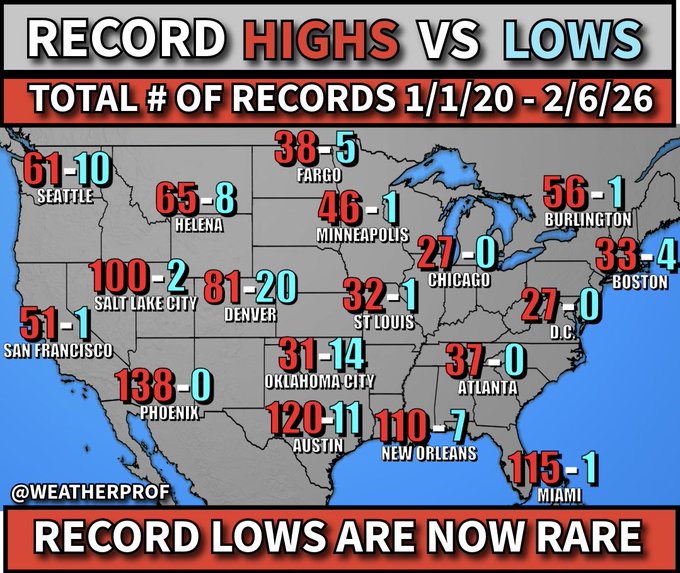
I saw the following image today: I’m not doubting the general accuracy of this. For example, this shows NO record lows at KATL vs 37 record highs since 2020. The last record low there including ties was way back on 9/7/2017! So, the zero record lows is confirmed. A better representation of the SE US to minimize the warming effects of UHI as well as warming from increased traffic on airport runways (big problem at ATL for example) would be to use a rural station like the far N GA small town of Blairsville, GA, which has a pretty long record (back to 1931): Per my counting (hoping I didn’t miscount…if I did it should be only minimally off): Since 2020 including ties, it has had 24 different days with record highs and 7 days with record lows. Since 2010, 65 with highs and 25 with lows Since 2000: 87 with highs and 42 with lows So, of course GW is real. But large cities’ records often cause an exaggeration of the degree of warming. So, it’s important to separate out UHI/airport effects as much as possible. —————— Daily records from here: https://www.weather.gov/wrh/Climate?wfo=ffc
-
Here there has been accumulating snow in March only 2 times in the modern record: 1993 and 1986. However, there have also been 9 traces, including 1980 and 1960. And way back in 1837, there was the 2nd biggest snow on record on March 3rd. We also had a major ZR/IP on 2/25/1914.
-
A better representation of the SE US to minimize the warming effects of UHI as well as warming from increased traffic on airport runways (big problem at ATL for example) would be to use a rural station like the far N GA small town of Blairsville, GA, which has a pretty long record (back to 1931): Per my counting (hoping I didn’t miscount…if I did it should be only minimally off): Since 2020 including ties, it has had 24 different days with record highs and 7 days with record lows. Since 2010, 65 with highs and 25 with lows Since 2000: 87 with highs and 42 with lows So, of course GW is real. But large cities’ records often cause an exaggeration of the degree of warming. So, it’s important to separate out UHI/airport effects as much as possible.—————— Daily records from here: https://www.weather.gov/wrh/Climate?wfo=ffc
-
Agreed. It’s still not warm at all for you as you average NN during this 3 week period on this run. However, that’s a bit warmer than the prior run, which had y’all averaging a little BN. Hoping the next few runs reverse cooler from this in the E US.

