GaWx
-
Posts
19,030 -
Joined
Content Type
Profiles
Blogs
Forums
American Weather
Media Demo
Store
Gallery
Everything posted by GaWx
-
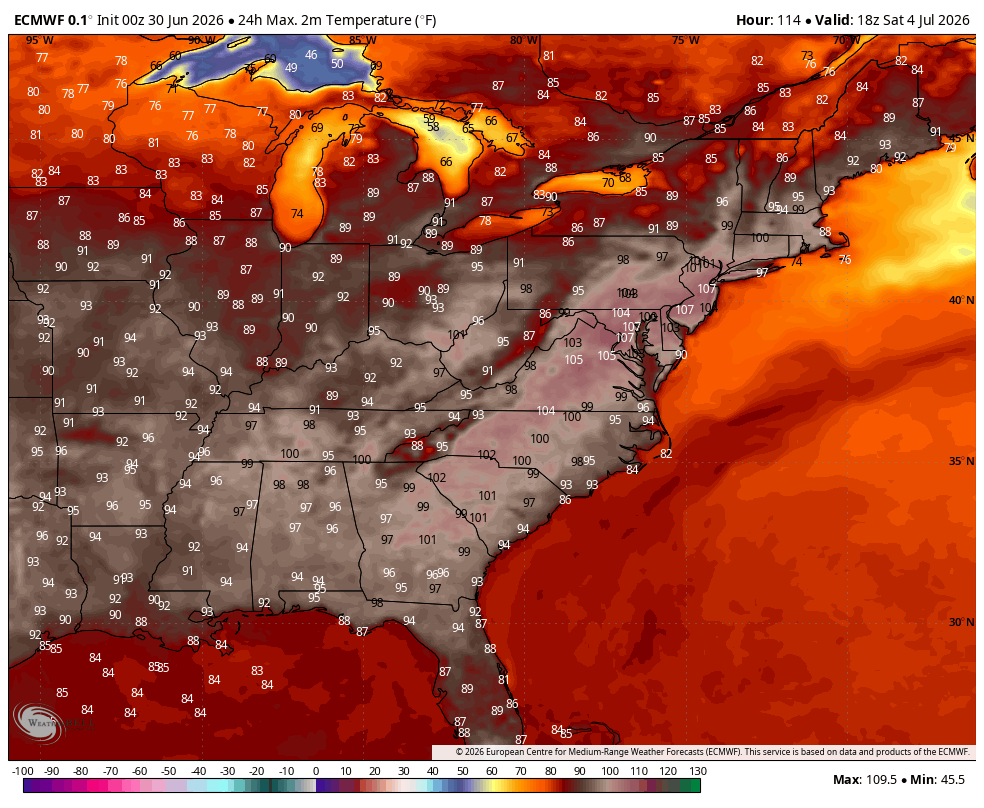
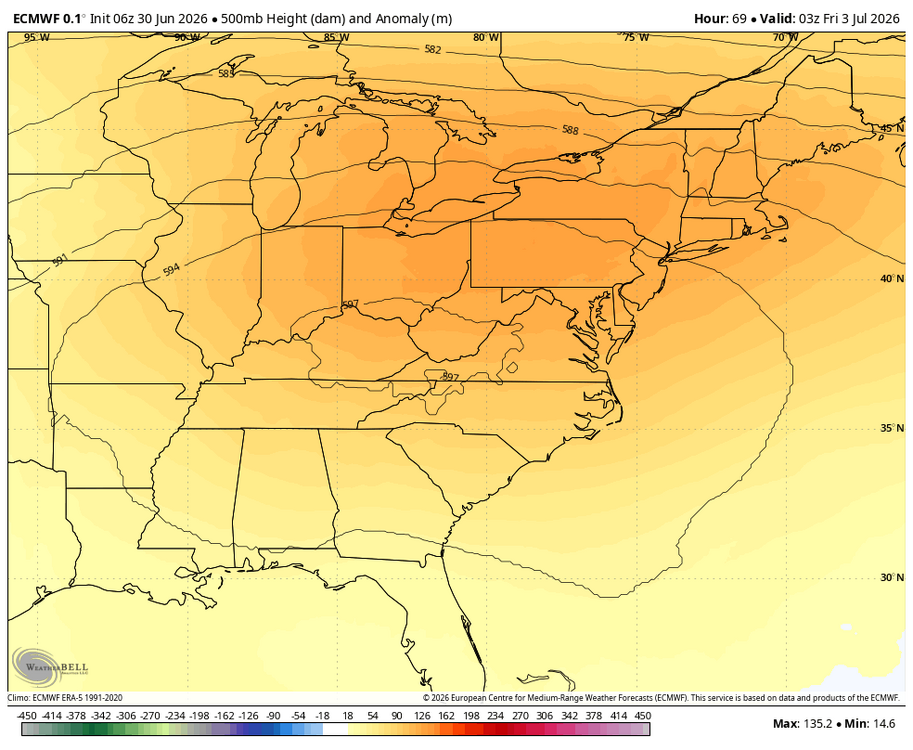
Hey Don, My point in thanking you for your post was agreeing with you about Chris Martz. Chris is both openly dismissing the contribution of AGW in these cases and is also dead wrong about the use of the term “heat dome”. But at the same time, I disagree with Jeff B. in calling this US heatwave one of the most “expansive”. It’s quite intense with record highs likely for a couple of days, but certainly not in a large portion of the country: This is the largest extent of the heat dome at H5 expected to produce record heat in and near the Mid-Atlantic states: Compare that to this significantly more expansive heatwave over the U.S.: 594 dm from E coast to Rockies and also N to MSP in addition to it peaking at ~600 vs the current one peaking at ~597: There are others, including the Dust Bowl years, especially July of 1936, that had some days of 100++ over a much larger portion of the U.S. In contrast, the current one is forecasted at its peak extent to have 100+ only mainly from E GA to the NYC/Hartford areas, which is not one of the most expansive in US history:

-
Thunderstorms popped up along the Savannah River ~1-1.5 hours ago. They’re moving in a somewhat unusual SE direction and one is about to get going here. Some rain drops just started falling and I hear plenty of thunder. Edit: It looks like I got ~0.2”.
-
I’ve learned that any location with “horse” in the name, whether in Canada or the U.S., seems to be amazingly wintry: -Deadhorse in Alaska -Whitehorse in Yukon, Canada -Darkhorse Lake and Hungry Horse in Montana
-
Thanks. But otoh, doesn’t the hot RDU sensor, itself, often end up verifying warmer unlike everywhere else?
-
The new (12Z) UKMET has nothing from the lemon designated as a weak TD, unlike the prior 3 full runs. However, Pivotal’s UK maps still have just about the same as a weak TD (a closed weak sfc low) along a similar track. It approaches SC late on 7/2 and comes into SC with hardly any circ. but with strong and persistent convection for S SC on 7/3-4 with a max of a whopping 9” 35 miles W of CHS before the convection heads NE up the Carolinas’ coast 7/5-6. That very heavy precip though is a major outlier vs other models and thus is highly unlikely as of now.
-
The new (12Z) UKMET has nothing designated as a weak TD, unlike the prior 3 full runs. However, Pivotal’s UK maps still have just about the same as a weak TD (a closed weak sfc low) along a similar track. It approaches SC late on 7/2 and comes into SC with hardly any circ. but with strong and persistent convection for S SC on 7/3-4 with a max of a whopping 9” 35 miles W of CHS before the convection heads NE up the Carolinas’ coast 7/5-6. That very heavy precip though is a major outlier vs other models and thus is highly unlikely as of now.
-
Absolutely, Don. It still would have been another historic heatwave even without AGW but not near as historic as it got due to the added effects from AGW. A larger portion of this extreme heat was very likely due to the pattern, itself, as opposed to AGW, itself. But AGW means a higher baseline as your quote said. The global baseline average has warmed ~2.5F since the late 1800s and not far from that even since just the mid-20th century if I’m not mistaken with the Arctic significantly higher and the tropics lower. How much do you figure the W Europe climate baseline has warmed?
-
2026-2027 Super El Nino
GaWx replied to Stormchaserchuck1's topic in Weather Forecasting and Discussion
Agree 100% about the volatility of Nino 1+2, but I’m talking about Nino 3.4, for which the latest CFS has a record obliterating high in Nov followed by a record rate of cooling afterward. The CFS’ volatility is not unlike how 1+2 can often be! But it is out on its own with that rapid a cooling of 3.4. And I agree about the atmospheric lag, regardless. -
2026-2027 Super El Nino
GaWx replied to Stormchaserchuck1's topic in Weather Forecasting and Discussion
I agree with you on a lot of this, especially the late winter hype and the fact that the CFS is out on its own with this record rate of cooling. However, at the same time, I’ll say these things: -It’s fair to post this aspect of the CFS as you did the first CFS post of the morning. Not only a record peak, but also a record cool off afterward (V shape). -This cooling of 1.3 from Nov to Jan would be a new record cooling as the current record per ERSST monthlies is the 1.0 cooling from Nov to Jan of 2002-3 -Sometimes they’ve actually strengthened from Nov to Jan -
Bump to show that once again the GFS looks like it is going to end up quite a bit too hot: Here is an apples to apples comparison with 24 hour highs on the GFS runs of 12Z 6/25 vs 6Z 6/29: still miserable and dangerous for sure but most of Carolinas are 5-9F less hot! This is a common bias of the GFS in summer in the SE US on mainly sunny days. 12Z 6/25 GFS 24 hour max ending 0Z 7/5: 6Z 6/29 GFS 24 hour max ending 0Z 7/5:
-
2026-2027 Super El Nino
GaWx replied to Stormchaserchuck1's topic in Weather Forecasting and Discussion
This is again indicative of a not nearly as E based El Niño as 1997-8 with the slope from E to W not nearly as steep. -
2026-2027 Super El Nino
GaWx replied to Stormchaserchuck1's topic in Weather Forecasting and Discussion
The latest CFS has its warmest relative 3.4 monthly peak yet, way up at a record high obliterating +3.3 in Nov! But note that it also still cools it at a record rapid pace all the way down to +2.0 in Jan, +1.5 in Feb, and +1.0 in Mar: @PhiEaglesfan712 -
2026-2027 Super El Nino
GaWx replied to Stormchaserchuck1's topic in Weather Forecasting and Discussion
Updated relative weeklies: Midweek date……..1+2………3……..3.4……..4 29APR2026 0.6 0.4 0.4 0.5 06MAY2026 1.0 0.5 0.4 0.5 13MAY2026 1.3 0.6 0.4 0.6 20MAY2026 1.6 0.7 0.5 0.6 27MAY2026 1.7 0.8 0.5 0.7 03JUN2026 2.0 0.9 0.7 0.7 10JUN2026 2.1 1.0 0.9 0.8 17JUN2026 2.4 1.3 1.1 0.8 24JUN2026 2.5 1.5 1.2 0.6 -
2026-2027 Super El Nino
GaWx replied to Stormchaserchuck1's topic in Weather Forecasting and Discussion
The CFS is still forecasting Nino 4 to reach a +2.5C monthly peak, which is not at all indicative of a relatively severely E based Nino like 1997, when it peaked at a mere +0.7C. It would even obliterate the monthly record peak of +1.5 of 2023-4 as well as the +1.4 of 2015-6, +1.1 of 2009-10, +0.9 of 1957-8, +0.9 of 1991-2, +0.8 of 1965-6, and +0.7 of 1972-3: -
2026-2027 Super El Nino
GaWx replied to Stormchaserchuck1's topic in Weather Forecasting and Discussion
The Arctic mean temp. N of 80N, helped by a +AO, still didn’t reach freezing as it actually cooled very slightly yesterday! The prior latest on record (back to 1958) to first exceed 0C was June 20th (2013). Will it finally exceed 0C before the end of the month? Time’s running out and the model consensus has BN temps persisting. It had come within 0.35C on June 27th and then yesterday fell a little to 0.47C away: -
The UKMET keeps developing this into a weak TD and then dissipating it well offshore the SE US as it moves SW, WSW, W, and then WNW. I doubt this ever becomes a TD when considering other models: MET OFFICE TROPICAL CYCLONE GUIDANCE FOR NORTH-EAST PACIFIC AND ATLANTIC GLOBAL MODEL DATA TIME 0000UTC 29.06.2026 NEW TROPICAL CYCLONE FORECAST TO DEVELOP AFTER 30 HOURS FORECAST POSITION AT T+ 30 : 32.5N 72.5W LEAD CENTRAL MAXIMUM WIND VERIFYING TIME TIME POSITION PRESSURE (MB) SPEED (KNOTS) -------------- ---- -------- ------------- ------------- 1200UTC 30.06.2026 36 31.5N 71.9W 1012 26 0000UTC 01.07.2026 48 31.1N 72.1W 1011 26 1200UTC 01.07.2026 60 30.8N 73.0W 1012 23 0000UTC 02.07.2026 72 30.8N 74.3W 1013 21 1200UTC 02.07.2026 84 31.1N 75.8W 1015 18 0000UTC 03.07.2026 96 31.8N 77.2W 1016 18 1200UTC 03.07.2026 108 CEASED TRACKING
-
12Z UKMET is fairly similar to the 0Z: TD that stays weak and then dissipates well offshore: MET OFFICE TROPICAL CYCLONE GUIDANCE FOR NORTH-EAST PACIFIC AND ATLANTIC GLOBAL MODEL DATA TIME 1200UTC 28.06.2026 NEW TROPICAL CYCLONE FORECAST TO DEVELOP AFTER 48 HOURS FORECAST POSITION AT T+ 48 : 32.1N 72.3W LEAD CENTRAL MAXIMUM WIND VERIFYING TIME TIME POSITION PRESSURE (MB) SPEED (KNOTS) -------------- ---- -------- ------------- ------------- 1200UTC 30.06.2026 48 32.1N 72.3W 1013 25 0000UTC 01.07.2026 60 31.4N 72.5W 1012 24 1200UTC 01.07.2026 72 31.0N 72.8W 1013 22 0000UTC 02.07.2026 84 31.2N 74.4W 1014 20 1200UTC 02.07.2026 96 31.6N 75.7W 1015 17 0000UTC 03.07.2026 108 CEASED TRACKING
-
The 12Z UKMET had nothing of note, even less than yesterday’s 0Z’s very weak low hitting near Daytona Beach. But the new 0Z is the 1st of its runs with a TD transitioning from an extratropical low that forms on a front. It then moves WSW but remains weak and then gradually weakens followed by dissipation on Thu well off the SE coast: MET OFFICE TROPICAL CYCLONE GUIDANCE FOR NORTH-EAST PACIFIC AND ATLANTIC GLOBAL MODEL DATA TIME 0000UTC 28.06.2026 NEW TROPICAL CYCLONE FORECAST TO DEVELOP AFTER 54 HOURS FORECAST POSITION AT T+ 54 : 32.1N 71.8W LEAD CENTRAL MAXIMUM WIND VERIFYING TIME TIME POSITION PRESSURE (MB) SPEED (KNOTS) -------------- ---- -------- ------------- ------------- 1200UTC 30.06.2026 60 32.1N 70.7W 1011 26 0000UTC 01.07.2026 72 31.2N 71.3W 1012 25 1200UTC 01.07.2026 84 30.4N 71.5W 1013 25 0000UTC 02.07.2026 96 30.5N 72.7W 1015 22 1200UTC 02.07.2026 108 30.6N 74.3W 1016 16 0000UTC 03.07.2026 120 CEASED TRACKING
-
2026-2027 Super El Nino
GaWx replied to Stormchaserchuck1's topic in Weather Forecasting and Discussion
Those are the NAO values, not PNAs. -
Per DMI, the daily mean temp in the Arctic N of 80N has still not reached 0C! As of today (6/27), it’s still barely <0C at -0.35C: Going all of the way back to 1958, the previous latest to first exceed 0C was a full week earlier, June 20th, and that was in 2013: So, even if it finally exceeds 0C tomorrow, that would still be a whopping 8 days later than the previous latest on record of June 20th! I checked every year. https://ocean.dmi.dk/arctic/meant80n.uk.php
-
2026-2027 Super El Nino
GaWx replied to Stormchaserchuck1's topic in Weather Forecasting and Discussion
Per DMI, the daily mean temp in the Arctic N of 80N has still not reached 0C! As of today (6/27), it’s still barely <0C at -0.35C: Going all of the way back to 1958, the previous latest to first exceed 0C was a full week earlier, June 20th, and that was in 2013: So, even if it finally exceeds 0C tomorrow, that would still be a whopping 8 days later than the previous latest on record of June 20th! I checked every year. https://ocean.dmi.dk/arctic/meant80n.uk.php -
The above popup, which didn’t last too long, still gave me ~0.3-0.4”. And now a new popup line of thunderstorms along the seabreeze is moving in with heavy rainfall potential per radar. This 2nd one ended up fizzling quickly as it came in after just a brief period of mainly just moderate rain. I estimate my total for today at 1/2”, which gets me to ~5.15” MTD. This further delays the earliest I’ll need to restart watering.
-
2026-2027 Super El Nino
GaWx replied to Stormchaserchuck1's topic in Weather Forecasting and Discussion
I’m wondering if W Yellowstone Gateway, which is at 6,666 ft, could get some snow: ...WINTER WEATHER ADVISORY REMAINS IN EFFECT FROM 6 PM THIS EVENING TO NOON MDT MONDAY... * WHAT...PERIODS OF WET SNOW EXPECTED. TOTAL SNOW ACCUMULATIONS UP TO 4 INCHES ABOVE 6500 FEETINCLUDING THE CITIES OF BIG SKY, WEST YELLOWSTONE, TARGHEE PASS, AND RAYNOLDS PASS 942 AM MDT SAT JUN 27 2026 TONIGHT COLDER. RAIN SHOWERS AND CHANCE OF THUNDERSTORMS IN THE EVENING, THEN RAIN SHOWERS AND SNOW SHOWERS AFTER MIDNIGHT. SNOW ACCUMULATION UP TO 4 INCHES. LOWS 31 TO 37.IF W Yell. Gate can somehow get any measurable SN late tonight, it would be a new record latest in season meas. on record by 20 days! They’ve had no meas. June 9th-Sep 14th although records go back only to 2007. But even just a T would be notable as they’ve had only 2 Ts June 28th-Sep 4th since 2007:Records: https://www.weather.gov/wrh/Climate?wfo=tfx https://grizzlyrv.com/what-is-the-elevation-of-west-yellowstone/ -
Heavy popup over me just started! Edit: I forgot to post about a popup line that developed along the seabreeze midafternoon yesterday that gave me ~0.25” (on June 26th), which had brought my MTD as of 6/26 to 4.65”.
-
2026-2027 Super El Nino
GaWx replied to Stormchaserchuck1's topic in Weather Forecasting and Discussion
These are progging 4 to get way up to +2.4 to +2.5, which is way higher than the record high of only +1.5 (‘23-4), +1.4 (‘15-6), +1.2 (‘09-10), +1.1 (‘68-9), +1.0 (‘18-9). Even the relatives for ‘26 on CFS/Euro are way up at ~+2.0! ‘97-8 and ‘82-3 were only +0.7! https://www.cpc.ncep.noaa.gov/data/indices/ersst5.nino.mth.91-20.ascii