

donsutherland1
-
Posts
24,186 -
Joined
Content Type
Profiles
Blogs
Forums
American Weather
Media Demo
Store
Gallery
Everything posted by donsutherland1
-
Morning thoughts... At weak system will move eastward across the region. It will be mostly cloudy and cold. A period of light rain or snow is possible in parts of the region, especially during the afternoon or early evening. High temperatures will reach the upper 30s and the lower 40s across most of the region. Likely high temperatures around the region include: New York City (Central Park): 40° Newark: 41° Philadelphia: 43° Tomorrow will be partly cloudy and milder. Overall, the March 16-19 period remains a period of opportunity for at least some snowfall in parts of the region. The next system will be a late-week developing nor’easter that could bring a period of accumulating snow to central and northern New England. A pronounced warming trend will likely commence during the weekend. As a result, there is a chance that the coming weekend could see Central Park’s last freeze of the 2020-21 season.
-
The March 1-15 period saw New York City come out with a mean temperature of 40.7°. That was 0.7° above normal. The second half of March will likely be warmer relative to normal. A weak system will approach the region overnight and then move across the region tomorrow. As a result, it will become increasingly cloudy tonight. Tomorrow will likely see a period of light snow or flurries, especially during the afternoon into the evening. Any accumulations will likely be minor, as the temperature will likely be well above freezing during much or all of the event. Some areas outside of New York City and Newark could pick up a slushy coating. Following the system, Wednesday will likely see a return to sunshine and milder conditions. Nevertheless, the remainder of the March 16-19 period could still offer some opportunity for at least some snowfall in parts of the region. The coming weekend could mark the start of a new warming trend. Since 1950, nearly 60% of days two weeks after the AO reached +3.000 or above in the March 1-15 period were warmer than when the AO reached +3.000 or above. The AO reached +3.000 on March 10. The mean increase was 2.8°. This suggests that it is more likely than not that the closing week of March could see a return to warmer conditions. Most of the guidance now favors the development of warmer conditions that would continue through the remainder of the month. Wednesday could see greatly elevated CAPE in an area extending from eastern Texas across the Gulf States. As a result, there will likely be a high probability of severe thunderstorms with hail and possible tornados in parts of that area, especially in the Gulf States. That risk of severe weather will then likely move into the Carolinas on Thursday and then offshore afterward. The ENSO Region 1+2 anomaly was +0.9°C and the Region 3.4 anomaly was -0.3°C for the week centered around March 10. For the past six weeks, the ENSO Region 1+2 anomaly has averaged -0.20°C and the ENSO Region 3.4 anomaly has averaged -0.80°C. La Niña conditions will likely give way to neutral-cool ENSO conditions as the spring progresses. The SOI was -1.29 today. The preliminary Arctic Oscillation (AO) figure was +1.710 today. On March 14 the MJO data was unavailable. The significant December 16-17 snowstorm during what has been a blocky December suggests that seasonal snowfall prospects have increased especially from north of Philadelphia into southern New England. At New York City, there is a high probability based on historic cases that an additional 20" or more snow will accumulate after December. Since January 1, New York City has picked up 28.1" snow. Winters that saw December receive 10" or more snow, less than 10" in January, and then 10" or more in February in New York City, saw measurable snowfall in March or April in 83% of cases. Winter 2009-2010 was the exception where only a trace of snow was recorded. This group of winters saw 6" or more snow during the March-April period in 50% of the cases. All said, it is more likely than not that there will be measurable snowfall after February. Based on sensitivity analysis applied to the latest guidance, there is an implied 68% probability that New York City will have a warmer than normal March. March will likely finish with a mean temperature near 43.5° (1.0° above normal).
-
Given the forecast CAPE, I wouldn’t be surprised if the risk is bumped up to “moderate” by tomorrow.
-
Front Range snowstorm nowcast/conditions 3/13-15
donsutherland1 replied to mayjawintastawm's topic in Central/Western States
-
Morning thoughts... In 1990, temperatures rose into the upper 70s and lower 80s across much of the northern Middle Atlantic region. This time around, it will feel more like mid-February than mid-March. At 7 am EDT, temperatures included: Albany: 12°; Allentown: 22°; Binghamton: 12°; Boston: 17°; Bridgeport: 21°; Danbury: 20°; Islip: 22°; New York City: 24°; Newark: 25°; Philadelphia: 28°; Poughkeepsie: 20°; Providence: 18°; and, White Plains: 20°. These will likely be the coldest temperatures the region will see until late next fall. Despite strong sunshine, temperatures will top out only in the upper 30s and the lower 40s across most of the region. Likely high temperatures around the region include: New York City (Central Park): 40° Newark: 42° Philadelphia: 43° Clouds will increase tonight. It will be mostly cloudy and continued cold tomorrow. A period of light snow could impact the region. Overall, the March 16-19 period remains a period of opportunity for at least some snowfall in parts of the region. A pronounced warming trend could commence during the weekend.
-
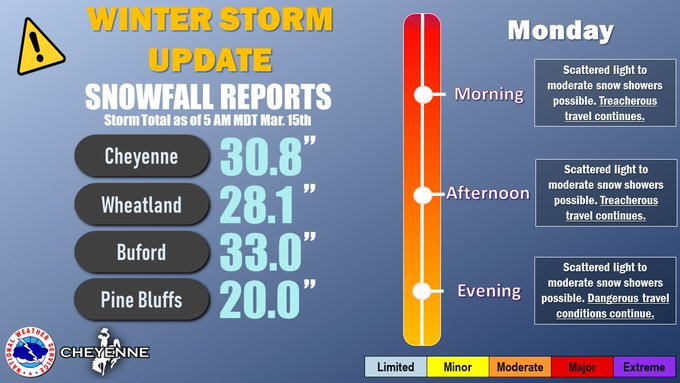
Cheyenne has seen 22.2” snow today. The 22.2” daily snowfall beats the old daily record of 19.8”, which was set on November 20, 1979. The 30.3” storm total surpasses the 25.6” that fell during November 19-21, 1979 to become Cheyenne’s biggest snowstorm on record.
-
Front Range snowstorm nowcast/conditions 3/13-15
donsutherland1 replied to mayjawintastawm's topic in Central/Western States
From the National Weather Service in Cheyenne: 818 CDUS45 KCYS 150333 CLICYS CLIMATE REPORT NATIONAL WEATHER SERVICE CHEYENNE WY 933 PM MDT SUN MAR 14 2021 ................................... ...THE CHEYENNE WYOMING AIRPORT CLIMATE SUMMARY FOR MARCH 14 2021... VALID TODAY AS OF 0900 PM LOCAL TIME. CLIMATE NORMAL PERIOD 1981 TO 2010 CLIMATE RECORD PERIOD 1871 TO 2021 WEATHER ITEM OBSERVED TIME RECORD YEAR NORMAL DEPARTURE LAST VALUE (LST) VALUE VALUE FROM YEAR NORMAL ................................................................... TEMPERATURE (F) TODAY MAXIMUM 31 144 AM 70 2003 47 -16 30 MINIMUM 23 759 PM -17 1880 24 -1 24 AVERAGE 27 36 -9 27 PRECIPITATION (IN) TODAY 1.91R 1.29 1946 0.03 1.88 0.01 MONTH TO DATE 2.61 0.41 2.20 0.42 SINCE MAR 1 2.61 0.41 2.20 0.42 SINCE JAN 1 3.33 1.21 2.12 1.21 SNOWFALL (IN) TODAY 22.2 R 11.5 1946 0.4 21.8 0.1 MONTH TO DATE 33.3 4.8 28.5 2.7 SINCE MAR 1 33.3 4.8 28.5 2.7 SINCE JUL 1 70.5 41.3 29.2 55.6 SNOW DEPTH 14 DEGREE DAYS HEATING TODAY 38 29 9 38 MONTH TO DATE 386 433 -47 375 SINCE MAR 1 386 433 -47 375 SINCE JUL 1 5304 5452 -148 5360 COOLING TODAY 0 0 0 0 MONTH TO DATE 0 0 0 0 SINCE MAR 1 0 0 0 0 SINCE JAN 1 0 0 0 0 ................................................................... WIND (MPH) HIGHEST WIND SPEED 36 HIGHEST WIND DIRECTION N (360) HIGHEST GUST SPEED 54 HIGHEST GUST DIRECTION N (350) AVERAGE WIND SPEED 23.3 SKY COVER POSSIBLE SUNSHINE MM AVERAGE SKY COVER 1.0 WEATHER CONDITIONS THE FOLLOWING WEATHER WAS RECORDED TODAY. THUNDERSTORM HEAVY SNOW SNOW LIGHT SNOW FOG FOG W/VISIBILITY <= 1/4 MILE RELATIVE HUMIDITY (PERCENT) HIGHEST 100 1200 AM LOWEST 88 1100 AM AVERAGE 94 .......................................................... THE CHEYENNE WYOMING AIRPORT CLIMATE NORMALS FOR TOMORROW NORMAL RECORD YEAR MAXIMUM TEMPERATURE (F) 48 76 2015 MINIMUM TEMPERATURE (F) 24 -13 1880 SUNRISE AND SUNSET MARCH 14 2021.........SUNRISE 712 AM MDT SUNSET 705 PM MDT MARCH 15 2021.........SUNRISE 710 AM MDT SUNSET 706 PM MDT - INDICATES NEGATIVE NUMBERS. R INDICATES RECORD WAS SET OR TIED. MM INDICATES DATA IS MISSING. T INDICATES TRACE AMOUNT. $$ The 22.2” daily snowfall beats the old daily record of 19.8”, which was set on November 20, 1979. The 30.3” storm total surpasses the 25.6” that fell during November 19-21, 1979 to become Cheyenne’s biggest snowstorm on record. -
Tomorrow will be the coldest day of the week and possibly the coldest day until at least late next fall. Temperatures will tumble into the lower and middle 20s from Philadelphia to New York City and into the teens in some areas outside of those cities. This cold shot following the recent warmth is not unusual. Since 1990, 73% of cases that saw a high temperature of 70° or above during March 1-15 were followed by a low temperature of 32° or below during the following two weeks. 54% of such cases saw a low temperature below 30° during the following two weeks and 27% saw the temperature fall below 25°. The mean lowest temperature during the following two weeks was 29°. In addition, the March 16-19 period could offer a period of opportunity for a light snow event in parts of the region. Next weekend could mark the start of a new warming trend. Since 1950, nearly 60% of days two weeks after the AO reached +3.000 or above in the March 1-15 period were warmer than when the AO reached +3.000 or above. The AO reached +3.000 on March 10. The mean increase was 2.8°. This suggests that it is more likely than not that the closing week of March could see a return to warmer conditions. Out west, a major to historic blizzard will continue into late tonight or early tomorrow. Cheyenne will likely set its all-time storm total snowfall record. Cheyenne's All-Time Snowfall Records: Daily: 19.8”, November 20, 1979; 2-Day: 25.2”, November 20-21, 1979; 3-Day: 25.6”, November 19-21, 1979 The ENSO Region 1+2 anomaly was +0.2°C and the Region 3.4 anomaly was -0.7°C for the week centered around March 3. For the past six weeks, the ENSO Region 1+2 anomaly has averaged -0.43°C and the ENSO Region 3.4 anomaly has averaged -0.87°C. La Niña conditions will likely prevail at least through most of March. Afterward, neutral-cool ENSO conditions will likely develop as the spring progresses. The SOI was -2.44 today. The SOI had recently been negative for 10 consecutive days. That development could be an early indication that what has been a fairly stable La Niña regime throughout the winter could be moving closer to its end stages. The preliminary Arctic Oscillation (AO) figure was +4.329 today. On March 13 the MJO data was unavailable. The significant December 16-17 snowstorm during what has been a blocky December suggests that seasonal snowfall prospects have increased especially from north of Philadelphia into southern New England. At New York City, there is a high probability based on historic cases that an additional 20" or more snow will accumulate after December. Since January 1, New York City has picked up 28.1" snow. Winters that saw December receive 10" or more snow, less than 10" in January, and then 10" or more in February in New York City, saw measurable snowfall in March or April in 83% of cases. Winter 2009-2010 was the exception where only a trace of snow was recorded. This group of winters saw 6" or more snow during the March-April period in 50% of the cases. All said, it is more likely than not that there will be measurable snowfall after February. Based on sensitivity analysis applied to the latest guidance, there is an implied 62% probability that New York City will have a warmer than normal March. March will likely finish with a mean temperature near 43.2° (0.7° above normal).
-
Front Range snowstorm nowcast/conditions 3/13-15
donsutherland1 replied to mayjawintastawm's topic in Central/Western States
313 FXUS65 KCYS 142257 AFDCYS Area Forecast Discussion National Weather Service Cheyenne WY 457 PM MDT Sun Mar 14 2021 .SHORT TERM...(Tonight - Monday) Issued at 352 PM MDT Sun Mar 14 2021 ...HISTORIC AND CRIPPLING BLIZZARD SEVERELY IMPACTING TRAVEL AND COMMERCE ACROSS MUCH OF THE AREA... Extreme snowfall. Whiteout conditions. Severe drifting. Impossible travel. This epic winter storm & blizzard has truly become one for the record books, literally. A storm total snowfall of 25.8 inches was recorded at NWS Cheyenne as of the 12 PM MDT observation, with periods of moderate to heavy snow continuing through the afternoon hours. This already shatters our 2-day record, and could even near or exceed 30 inches by the time all is said and done. Snow amounts upwards of 4 feet have been reported in some of the higher terrain along the Laramie Range! Very impressive indeed. Extreme snow fall rates of 2-3 inches were common through the event with a number of instances of thunder snow as a highly anomalous fetch of moist and unstable air interacted orographically with the Cheyenne Ridge and the Southern/Central Laramie Range. 10 inches of snow fell in a 4- hour period ending at 7 AM MDT this morning! That would be a solid snowfall event just in itself, but extreme rates persisted through the morning with widespread totals reaching 2-3 feet along/east of the Laramie Range as an extremely impressive TROWAL wrapped across the CWA in the presence of deep upslope. Surface cyclogenesis over Colorado led to tightening MSLP gradients, and widespread blizzard conditions as wind gusts up to 50 MPH plagued the area for most of the early morning and afternoon hours. Drifts became impressive at 5-10 feet and WYDOT has reported via Twitter that rotary plows are needed to clear portions of I-80. Perspective: This is the type of equipment normally used to clear mountain passes in the Spring. It is virtually impossible to travel, and could remain very difficult for the next day or two as the degree of drifting is unprecedented on this scale. This is even considering that snow and wind impacts should diminish this evening and overnight. Spectacular Water Vapor Satellite display with an extremely large/ intense upper-level low spinning over east central CO w/ quite the footprint encompassing over half of the CONUS. Expect this record- breaking system will begin to fill shortly as it drifts off to the east-northeast, but wrap-around moisture should support periods of snow through Monday morning, although any additional accumulations should be limited. Direct impacts from snow and blowing snow could lessen considerably in the next few hours, but it will take a good bit of time to dig out. .LONG TERM...(Tuesday - Sunday) Issued at 332 AM MDT Sun Mar 14 2021 A very active pattern in store for Tuesday to Wednesday evening as we have a quick succession of this current winter storm lifting northeast, followed by a closed low moving south across the Four Corners region, and finally a shortwave embedded in the eastern side of a ridge that builds into SE Wyoming and W Nebraska Thursday. Once the ridge builds in Thursday, skies should clear and temperatures will warm up to above normal once again. But, until then, there are chances of precipitation across most of SE Wyoming and W Nebraska, most likely snow as our temperatures will be in the 20s at night, only warming up the lower-to-mid 30s during the day. Accumulations were previously forecast to be between 1 and 3 inches, but now with the latest model runs, it's looking closer to an inch or less with higher amounts in the mountains and higher elevations. The center of the low stays well south of forecast region and it moves very quickly eastward and northeastward, but as it interacts with the current major winter storm, the low stalls the winter storm, keeping the snow and some minor impacts around until Wednesday afternoon/evening when both systems are pushed out of the way by a strong ridge. Another reason this small second wave is less likely to drop buckets of snow on Wyoming and Nebraska again is because as the winter storm moves northeast, it puts Wyoming and Nebraska on the southeast side of the storm where the winds are westerly, which is downsloping for most of our forecast area and limits the growth of the snow showers. && -
It can happen. I saw it once when I was west of Trois Rivières in Canada.
-
Front Range snowstorm nowcast/conditions 3/13-15
donsutherland1 replied to mayjawintastawm's topic in Central/Western States
Thank you, Jake. Enjoy the snowstorm. It’s an exceptional one. -
Front Range snowstorm nowcast/conditions 3/13-15
donsutherland1 replied to mayjawintastawm's topic in Central/Western States
It's an amazing storm. Also, would you mind if I add your photo to my winter storms photos site. -
There was a sprinkle in New Rochelle, NY a short time ago.
-
Front Range snowstorm nowcast/conditions 3/13-15
donsutherland1 replied to mayjawintastawm's topic in Central/Western States
Time: 2021-03-14T12:00:00Z UTC Event: 52.5 HEAVY SNOW Source: PARK/FOREST SRVC Remark: WINDY PEAK SNOTEL IN THE LARAMIE RANGE. ELEVATION 7900 FEET. SNOW WATER EQUIVALENT IS 3.5 INCHES AND THE SNOW TO LIQUID RATIO USED WAS 15 TO 1. ACCUMULATION WAS OVER PAST 24 HOURS. -
Front Range snowstorm nowcast/conditions 3/13-15
donsutherland1 replied to mayjawintastawm's topic in Central/Western States
Cheyenne’s March Snowfall Records: Daily: 15.9”, March 18, 2003; 2-Day: 17.2”, March 17-18, 2003; 3-Day: 18.9”, March 5-7, 1990 Cheyenne’s All-Time Snowfall Records: Daily: 19.8”, November 20, 1979; 2-Day: 25.2”, November 20-21, 1979; 3-Day: 25.6”, November 19-21, 1979 -
Back on March 5 0z, the EPS ensembles were indicating that there would be a pattern similar to that of March 9-15, 2020. https://www.americanwx.com/bb/topic/54600-march-2021/?do=findComment&comment=5954517March 9-12, 2021 saw what turned out to be an even more amplified version of the 2020 pattern, as the Arctic Oscillation (AO) soared to a preliminary March record of +5.656. As a result, the March 9-12, 2021 timeframe was even warmer than the March 9-15, 2020 period. Boston: Average High: 2020: 56.9°; 2021: 62.0° Average Low: 2020: 37.3°; 38.3° Mean: 2020: 47.0°; 2021: 50.1° Highest: 2020: 72°; 2021: 74° New York City: Average High: 2020: 60.7°; 2021: 64.3° Average Low: 2020: 45.0°; 2021: 44.8° Mean: 2020: 52.9°; 2021: 54.5° Highest: 2020: 72°; 71° Philadelphia: Average High: 2020: 63.6°; 2021: 70.3° Average Low: 2020: 43.1°; 2021: 42.0° Mean: 2020: 53.4°; 2021: 56.1° Highest: 2020: 74°; 2021: 74° In sum, this experience suggests the insight hemispheric patterns can provide. Synoptic details, including the placement of features and magnitude of amplification, determine the details of how things turn out.
-
Front Range snowstorm nowcast/conditions 3/13-15
donsutherland1 replied to mayjawintastawm's topic in Central/Western States
NWS Cheyenne: 10” snow in 4 hours. https://twitter.com/NWSCheyenne/status/1371082592682790914?s=20 -
Morning thoughts... A blizzard is currently bringing heavy snow and high winds to parts of the Rockies. So far, Denver has picked up 11.1” of snow. Areas around Cheyenne had picked up 8” of snow just before midnight MST. A strong cold front will cross the region today. Overall, it will be partly sunny and increasingly windy. Winds could gust past 50 mph in some areas. There could be an isolated sprinkle. Temperatures will likely top out mainly in the upper 40s and lower 50s in most of the region. Likely high temperatures around the region include: New York City (Central Park): 53° Newark: 55° Philadelphia: 58° Tomorrow will be sunny and unseasonably cold. Much of the region will see low temperatures in the lower 20s. Outside the major cities, some teens are possible. The March 16-19 period could still offer a period of opportunity for a light snow event in parts of the region. Out west, the major to perhaps historic snowstorm will rage into this evening. Snow will diminish at night or early tomorrow. Denver will likely experience a storm total 12”-18” snowfall. Cheyenne remains on track to pick up a storm total 20”-30” of snow. Cheyenne’s March Snowfall Records: Daily: 15.9”, March 18, 2003; 2-Day: 17.2”, March 17-18, 2003; 3-Day: 18.9”, March 5-7, 1990 Cheyenne’s All-Time Snowfall Records: Daily: 19.8”, November 20, 1979; 2-Day: 25.2”, November 20-21, 1979; 3-Day: 25.6”, November 19-21, 1979
-
Cooler weather moved back into the region overnight. Tomorrow will be partly sunny, windy, and seasonably cool. A strong cold front will move across the region bringing some clouds. There could be an isolated sprinkle. Monday will be the coldest day of the week and possibly the coldest day until at least late next fall. Since 1990, 73% of cases that saw a high temperature of 70° or above during March 1-15 were followed by a low temperature of 32° or below during the following two weeks. 54% of such cases saw a low temperature below 30° during the following two weeks and 27% saw the temperature fall below 25°. The mean lowest temperature during the following two weeks was 29°. Monday's fairly strong cold shot is consistent with recent historical experience. In addition, the March 16-19 period could offer a period of opportunity for a light snow event in parts of the region. Next weekend could mark the start of a new warming trend. Since 1950, nearly 60% of days two weeks after the AO reached +3.000 or above in the March 1-15 period were warmer than when the AO reached +3.000 or above. The AO reached +3.000 on March 10. The mean increase was 2.8°. This suggests that it is more likely than not that the closing week of March could see a return to warmer conditions. Out west, a major to perhaps historic snowstorm will continue into late tomorrow or early Monday. Denver, Cheyenne, and possibly Casper, as well as the Nebraska Panhandle, will likely see heavy snowfall. Denver will likely pick up 8"-16" of snow. Cheyenne will likely see 20"-30" of snow. That would set a new March record and could challenge that Cheyenne's all-time record snowstorm amount. Cheyenne's March Snowfall Records: Daily: 15.9”, March 18, 2003; 2-Day: 17.2”, March 17-18, 2003; 3-Day: 18.9”, March 5-7, 1990 Cheyenne's All-Time Snowfall Records: Daily: 19.8”, November 20, 1979; 2-Day: 25.2”, November 20-21, 1979; 3-Day: 25.6”, November 19-21, 1979 The ENSO Region 1+2 anomaly was +0.2°C and the Region 3.4 anomaly was -0.7°C for the week centered around March 3. For the past six weeks, the ENSO Region 1+2 anomaly has averaged -0.43°C and the ENSO Region 3.4 anomaly has averaged -0.87°C. La Niña conditions will likely prevail at least through most of March. Afterward, neutral-cool ENSO conditions will likely develop as the spring progresses. The SOI was -11.68 today. The SOI had recently been negative for 10 consecutive days. That development could be an early indication that what has been a fairly stable La Niña regime throughout the winter could be moving closer to its end stages. The preliminary Arctic Oscillation (AO) figure was +4.329 today. On March 12 MJO data was not available. The March 11-adjusted amplitude was 1.297 (RMM). The significant December 16-17 snowstorm during what has been a blocky December suggests that seasonal snowfall prospects have increased especially from north of Philadelphia into southern New England. At New York City, there is a high probability based on historic cases that an additional 20" or more snow will accumulate after December. Since January 1, New York City has picked up 28.1" snow. Winters that saw December receive 10" or more snow, less than 10" in January, and then 10" or more in February in New York City, saw measurable snowfall in March or April in 83% of cases. Winter 2009-2010 was the exception where only a trace of snow was recorded. This group of winters saw 6" or more snow during the March-April period in 50% of the cases. All said, it is more likely than not that there will be measurable snowfall after February. Based on sensitivity analysis applied to the latest guidance, there is an implied 52% probability that New York City will have a warmer than normal March. March will likely finish with a mean temperature near 42.9° (0.4° above normal).
-
Under bright sunshine, the temperature rose to 50° in New York City. After the last few days of much above normal temperatures, the New York Botanical Garden’s Japanese Apricot trees have burst into bloom. Crocuses are out in abundance.
-
000 NOUS41 KOKX 131147 PNSOKX CTZ005>012-NJZ002-004-006-103>108-NYZ067>075-078>081-176>179-132335- PUBLIC INFORMATION STATEMENT NATIONAL WEATHER SERVICE NEW YORK NY 647 AM EST SAT MAR 13 2021 ...HIGHEST WIND GUST REPORTS... LOCATION SPEED TIME/DATE PROVIDER ...CONNECTICUT... ...FAIRFIELD COUNTY... BRIDGEPORT AIRPORT 43 MPH 1249 AM 03/13 ASOS BRIDGEPORT 43 MPH 0115 AM 03/13 CWOP ...MIDDLESEX COUNTY... CHESTER AIRPORT 40 MPH 0515 AM 03/13 AWOS ...NEW HAVEN COUNTY... STONY CREEK 51 MPH 1255 AM 03/13 CWOP LIGHTHOUSE POINT 45 MPH 1154 PM 03/12 WXFLOW WATERBURY AIRPORT 41 MPH 1106 PM 03/12 AWOS HAMMONASSET 41 MPH 1154 PM 03/12 WXFLOW ...NEW LONDON COUNTY... GROTON AIRPORT 49 MPH 0255 AM 03/13 ASOS ...NEW JERSEY... ...BERGEN COUNTY... FAIR LAWN 41 MPH 1254 AM 03/13 CWOP TETERBORO AIRPORT 41 MPH 0154 AM 03/13 ASOS ...HUDSON COUNTY... BAYONNE 43 MPH 0345 AM 03/13 WXFLOW ...UNION COUNTY... NEWARK AIRPORT 53 MPH 1249 AM 03/13 ASOS LINDEN AIRPORT 43 MPH 0215 AM 03/13 AWOS ...NEW YORK... ...KINGS COUNTY... BROOKLYN COLLEGE 49 MPH 0105 AM 03/13 NYSM SHEEPSHEAD BAY 41 MPH 0145 AM 03/13 CWOP ...NASSAU COUNTY... BAYVILLE 52 MPH 0121 AM 03/13 WXFLOW WANTAGH 44 MPH 0110 AM 03/13 NYSM ...NEW YORK COUNTY... MIDTOWN MANHATTAN 50 MPH 0245 AM 03/13 NYSM ...ORANGE COUNTY... STEWART AIRPORT 47 MPH 1245 AM 03/13 AWOS VAILS GATE 44 MPH 1211 AM 03/13 CWOP NEWBURGH 43 MPH 1031 PM 03/12 CWOP WARWICK 41 MPH 1215 AM 03/13 NYSM MONTGOMERY AIRPORT 40 MPH 0116 AM 03/13 AWOS ...PUTNAM COUNTY... BREWSTER 49 MPH 1145 PM 03/12 NYSM ...QUEENS COUNTY... NYC/LA GUARDIA 54 MPH 0110 AM 03/13 ASOS NYC/JFK AIRPORT 54 MPH 0245 AM 03/13 ASOS KEW GARDEN HILLS 48 MPH 0120 AM 03/13 NYSM JACKSON HEIGHTS 46 MPH 0243 AM 03/13 CWOP NYC/JFK 41 MPH 0246 AM 03/13 ASOS ...RICHMOND COUNTY... COLLEGE OF STATEN ISLAND 43 MPH 0115 AM 03/13 NYSM ...ROCKLAND COUNTY... SUFFERN 50 MPH 0230 AM 03/13 NYSM ...SUFFOLK COUNTY... EATONS NECK 61 MPH 1235 AM 03/13 WXFLOW WESTHAMPTON AIRPORT 55 MPH 1226 AM 03/13 ASOS GREAT GULL ISLAND 52 MPH 0318 AM 03/13 WXFLOW SOUTHOLD 50 MPH 0423 AM 03/13 CWOP NAPEAGUE 49 MPH 0359 AM 03/13 WXFLOW SOUTHOLD 47 MPH 0340 AM 03/13 NYSM SHIRLEY AIRPORT 46 MPH 0202 AM 03/13 ASOS RIDGE 45 MPH 1245 AM 03/13 CWOP WEST GILGO BEACH 45 MPH 0338 AM 03/13 CWOP MECOX BAY 45 MPH 0419 AM 03/13 WXFLOW ISLIP AIRPORT 44 MPH 0237 AM 03/13 ASOS FARMINGDALE AIRPORT 41 MPH 0155 AM 03/13 ASOS GREAT SOUTH BAY 41 MPH 0226 AM 03/13 WXFLOW FISHERS ISLAND AIRPORT 40 MPH 0442 AM 03/13 WXFLOW ...WESTCHESTER COUNTY... WHITE PLAINS AIRPORT 47 MPH 0142 AM 03/13 ASOS TAPPAN ZEE LIGHT 14 45 MPH 0233 AM 03/13 WXFLOW PEEKSKILL 44 MPH 0158 AM 03/13 CWOP CROTON 43 MPH 0218 AM 03/13 WXFLOW SOMERS 40 MPH 1140 PM 03/12 NYSM ...CONNECTICUT... ...MARITIME STATIONS... USCG ACADEMY 52 MPH 0346 AM 03/13 WXFLOW 1 ESE NORWALK 48 MPH 0118 AM 03/13 WXFLOW STONGINGTON OUTER BREAKWATER 46 MPH 0349 AM 03/13 WXFLOW 2 SSE NEW HAVEN 45 MPH 1212 AM 03/13 NOS-PORTS ...NEW YORK... LARCHMONT HARBOR 48 MPH 0311 AM 03/13 WXFLOW FIRE ISLAND CG 48 MPH 0206 AM 03/13 WXFLOW ROBBINS REEF, NJ 47 MPH 0312 AM 03/13 NOS-PORTS SHINNECOCK 45 MPH 1219 AM 03/13 WXFLOW POINT O WOODS YC 44 MPH 0130 AM 03/13 WXFLOW CITY ISLAND 41 MPH 0216 AM 03/13 CWOP &&
-
Morning thoughts... Overnight, cooler air began pushing into the region on gusty winds. Nevertheless, New York City’s Central Park set a record high minimum temperature for March 12 with a low temperature of 52°. That beat the previous record of 50°, which had been set way back in 1898. Today will be fair, windy and noticeably cooler than yesterday. Temperatures will likely top out mainly in the upper 40s and lower 50s in most of the region. Likely high temperatures around the region include: New York City (Central Park): 49° Newark: 50° Philadelphia: 52° Tomorrow will be a seasonably cool day. The March 16-19 period could offer a period of opportunity for a light snow event in parts of the region. Out west, a major to perhaps historic snowstorm will get underway and continue through late tomorrow night or early Monday. Denver will likely experience an 8”-16” snowfall. Cheyenne remains on track to pick up 20”-30” of snow. March Snowfall Records: Daily: 15.9”, March 18, 2003; 2-Day: 17.2”, March 17-18, 2003; 3-Day: 18.9”, March 5-7, 1990 All-Time Snowfall Records: Daily: 19.8”, November 20, 1979; 2-Day: 25.2”, November 20-21, 1979; 3-Day: 25.6”, November 19-21, 1979
-
Enjoy the storm.
-
Early clouds yielded to abundant sunshine in parts of the region sending temperatures soaring for another day. Parts of the northern Middle Atlantic and southern New England areas saw record high temperatures. High temperatures included: Allentown: 65° Boston: 65° Bridgeport: 67° (old record: 65°, 2012) Islip: 67° (old record: 65°, 1973 and 2012) New Haven: 66° (old record: 63°, 1973) New York City-JFK: 70° (old record: 68°, 1973) New York City-LGA: 69° (tied record set in 2012) New York City-NYC: 68° Newark: 71° Philadelphia: 71° Providence: 65° Poughkeepsie: 63° Trenton: 69° Westhampton: 67° (old record: 60°, 2012) The early episode of spring is now concluding. Cooler weather will return this weekend. Since 1990, 73% of cases that saw a high temperature of 70° or above during March 1-15 were followed by a low temperature of 32° or below during the following two weeks. 54% of such cases saw a low temperature below 30° during the following two weeks and 27% saw the temperature fall below 25°. The mean lowest temperature during the following two weeks was 29°. In sum, the fairly strong cold shot for early next week is consistent with recent historical experience. However, just as was the case during the historic February arctic outbreak, the core of the cold will likely remain west of the region on account of a fairly expansive western Atlantic ridge. Nevertheless, the March 16-19 period could offer a period of opportunity for a light snow event in parts of the region. Since 1950, nearly 60% of days two weeks after the AO reached +3.000 or above in the March 1-15 period were warmer than when the AO reached +3.000 or above. The mean increase was 2.8°. This suggests that it is more likely than not that the closing week of March could see a return to warmer conditions. This warmth is now showing up on the CFSv2's week 3 maps. Out west, a major to perhaps historic snowstorm will develop in the Rockies late tonight and continue into late Sunday or early Monday. Denver, Cheyenne, and possibly Casper, as well as the Nebraska Panhandle, will likely see heavy snowfall. Denver will likely pick up 8"-16" of snow, though there is greater uncertainty. Cheyenne will likely see 20"-30" of snow. That would set a new March record and could challenge that Cheyenne's all-time record snowstorm amount. Cheyenne's March Snowfall Records: Daily: 15.9”, March 18, 2003; 2-Day: 17.2”, March 17-18, 2003; 3-Day: 18.9”, March 5-7, 1990 Cheyenne's All-Time Snowfall Records: Daily: 19.8”, November 20, 1979; 2-Day: 25.2”, November 20-21, 1979; 3-Day: 25.6”, November 19-21, 1979 The ENSO Region 1+2 anomaly was +0.2°C and the Region 3.4 anomaly was -0.7°C for the week centered around March 3. For the past six weeks, the ENSO Region 1+2 anomaly has averaged -0.43°C and the ENSO Region 3.4 anomaly has averaged -0.87°C. La Niña conditions will likely prevail at least through most of March. Afterward, neutral-cool ENSO conditions will likely develop as the spring progresses. The SOI was -6.51 today. The SOI had been negative for 10 consecutive days. That development could be an early indication that what has been a fairly stable La Niña regime throughout the winter could be moving closer to its end stages. The preliminary Arctic Oscillation (AO) figure was +5.656 today. That exceeds the March record of +5.588, which was set on March 8, 2015. On March 11 the MJO was in Phase 1 at an amplitude of 1.290 (RMM). The March 10-adjusted amplitude was 1.099 (RMM). The significant December 16-17 snowstorm during what has been a blocky December suggests that seasonal snowfall prospects have increased especially from north of Philadelphia into southern New England. At New York City, there is a high probability based on historic cases that an additional 20" or more snow will accumulate after December. Since January 1, New York City has picked up 28.1" snow. Winters that saw December receive 10" or more snow, less than 10" in January, and then 10" or more in February in New York City, saw measurable snowfall in March or April in 83% of cases. Winter 2009-2010 was the exception where only a trace of snow was recorded. This group of winters saw 6" or more snow during the March-April period in 50% of the cases. All said, it is more likely than not that there will be measurable snowfall after February. Based on sensitivity analysis applied to the latest guidance, there is an implied 52% probability that New York City will have a warmer than normal March. March will likely finish with a mean temperature near 42.9° (0.4° above normal).
-
January 6, 2007: 71 degrees


