donsutherland1
-
Posts
24,169 -
Joined
Content Type
Profiles
Blogs
Forums
American Weather
Media Demo
Store
Gallery
Everything posted by donsutherland1
-
Building on yesterday's post concerning the pattern evolution, the prospects of a colder than normal start to January have continued to increase. The MJO has now moved into Phase 7 at a very high amplitude (2.000 or above). The number of cases where the MJO moved into Phase 7 at amplitudes of 2 or above (n=3) or 1.75 or above (n=4) during December 10-20 is small. However, those cases overwhelmingly saw January 1-10 wind up colder or perhaps much colder than normal. January 1-10 Temperatures for New York City and Philadelphia: New York City: Mean: 26.1° Lowest: 21.2°, 2018 Highest: 34.1°, 2002 1991-2020 Mean: 34.8° Philadelphia: Mean: 26.1° Lowest: 20.7°, 2018 Highest: 34.5°, 2002 1991-2020 Mean: 35.2°
-
Morning thoughts… Today will be mostly sunny, breezy, and mild. High temperatures will likely reach the lower and middle 50s in most of the region. Likely high temperatures around the region include: New York City (Central Park): 53° Newark: 56° Philadelphia: 56° Normals: New York City: 30-Year: 44.9°; 15-Year: 45.6° Newark: 30-Year: 45.4°; 15-Year: 46.2° Philadelphia: 30-Year: 46.6°; 15-Year: 47.5° The unseasonably mild weather will continue into the start of the weekend.
-
Another warmup is poised to unfold starting tomorrow. Parts of the Midwest could see daily and December-record temperatures. Des Moines has a shot at seeing its first ever 70° December day. Some of that warmth will affect the region late in the week before cooler air again returns. No Arctic blasts appear likely for the foreseeable future. Overall, through December 20th, there will likely be only some relatively short-lived cool shots. Afterward, the AO could go negative, increasing the opportunity for colder outcomes. In the Midwest, Chicago has yet to receive its first measurable snowfall through December 11. Only four prior years saw their first measurable snowfall on December 11 or later: 1. December 20, 2012 2. December 16, 1965 3. December 14, 2001 4. December 12, 1946 The base case is that the closing 10 days of December could turn cooler, though not necessarily cold. Since 1950, there have been 7 cases where the AO averaged +2.000 or above during the first week in December, as has been the case this year. The mean December 21-31 temperature in New York City was 40.2°. The median temperature was 41.5°. The coldest was 35.3° (1951) and the warmest was 44.0° (1979). In short, this historic experience would suggest that there will be no severe Arctic outbreaks in the East this month. It also suggests that New York City will likely have an average temperature of 40° or above this month. Following very wet July-September periods, winter (December-February) precipitation has typically been near or below normal. The most recent exception was winter 2018-19. The ENSO Region 1+2 anomaly was -1.1°C and the Region 3.4 anomaly was -0.9°C for the week centered around December 1. For the past six weeks, the ENSO Region 1+2 anomaly has averaged -0.87°C and the ENSO Region 3.4 anomaly has averaged -0.92°C. La Niña conditions will likely persist into at least late winter. The SOI was +12.40 today. The preliminary Arctic Oscillation (AO) figure was +1.290 today On December 10 the MJO was in Phase 6 at an amplitude of 2.423 (RMM). The December 9-adjusted amplitude was 2.539 (RMM). Based on sensitivity analysis applied to the latest guidance, there is an implied 85% probability that New York City will have a warmer than normal December (1991-2020 normal). December will likely finish with a mean temperature near 42.3° (3.2° above normal).
-
The long-range guidance is looking somewhat more promising. However, through the 20th, readings remain likely to average above normal with any cold shots being transient and modest. During the closing 10 days of the month, a somewhat cooler but not very cold regime could begin to unfold. If a period of sustained below normal temperatures will develop, one might need to wait for the first week in January. Then, we’ll have to see whether such a pattern could be sustained or would wind up breaking down within two weeks or so. We’ll also have to wait to see if the severe cold from Alaska/NW Canada moves into the region or remains largely confined to Canada as it spreads eastward. For perspective, below are the mean temperatures for NYC for 12/21-25 for the last four runs of the EPS: 12/11 0z: 37.7 12/11 0z: 37.0 12/12 0z: 36.7 12/12 12z: 37.9 That’s not much of a change. It’s also somewhat warmer than normal.
-
He might be referring to winter 2018-19 and March 2019. 2019-20 was among the least snowy winters on record.
-
Morning thoughts… Today will be partly sunny, breezy, and noticeably cooler. High temperatures will likely reach the upper 40s and lower 50s in most of the region. Likely high temperatures around the region include: New York City (Central Park): 49° Newark: 52° Philadelphia: 51° Normals: New York City: 30-Year: 45.2°; 15-Year: 45.8° Newark: 30-Year: 45.7°; 15-Year: 46.5° Philadelphia: 30-Year: 46.9°; 15-Year: 47.7° Milder air will begin to return tomorrow.
-
59. It was well short of its daily record due to a persistent onshore wind.
-
Although it was mostly cloudy throughout the region, daily record high temperatures were matched or broken in many parts of the region. Those records included some dusty 19th century antique marks. Record temperatures through 7 pm included: Allentown: 63° (old record: 61°, 1952 and 1979) Atlanta: 75° (tied record set in 2007) Baltimore: 70° (old record: 66°, 1971) Buffalo: 67° (old record: 61°, 1899) Harrisburg: 68° (old record: 63°, 1897) New York City-LGA: 67° (old record: 62°, 1971) New York City-NYC: 66° (old record: 64°, 1879) Newark: 68° (old record: 65°, 1966 and 1971) Philadelphia: 68° (old record: 65°, 1899 and 1971) Poughkeepsie: 64° (old record: 63°, 1966) Rochester: 64° (tied record set in 2015) Scranton: 64° (tied record set in 1979) Syracuse: 64° (old record: 62°, 1979) Toronto: 64° (old record: 56°, 1979) Trenton: 65° (tied record set in 1911) Washington, DC: 70° (old record: 68°, 1897, 1971 and 1979) Wilmington, DE: 67° (old record: 66°, 1971) Wilmington, NC: 80° (old record: 79°, 2007) Baltimore's 70° temperature was that city's record 189th such day. The previous record was 187 days, which was set in 2017. A cold front will move across the region this evening and tonight. It could bring some heavy showers and thundershowers, damaging winds, and perhaps some hail. This cold front will bring a transient shot of somewhat cooler air to the region. Another warmup is possible beginning next week. No Arctic blasts appear likely for the foreseeable future. Overall, through December 20th, there will likely be only some relatively short-lived cool shots. Afterward, the AO could go negative, increasing the opportunity for colder outcomes. In the Midwest, Chicago has yet to receive its first measurable snowfall through December 10. Only five prior years saw their first measurable snowfall on December 10 or later: 1. December 20, 2012 2. December 16, 1965 3. December 14, 2001 4. December 12, 1946 5. December 10, 2003 The base case is that the closing 10 days of December could turn cooler, though not necessarily cold. Since 1950, there have been 7 cases where the AO averaged +2.000 or above during the first week in December, as has been the case this year. The mean December 21-31 temperature in New York City was 40.2°. The median temperature was 41.5°. The coldest was 35.3° (1951) and the warmest was 44.0° (1979). In short, this historic experience would suggest that there will be no severe Arctic outbreaks in the East this month. It also suggests that New York City will likely have an average temperature of 40° or above this month. Following very wet July-September periods, winter (December-February) precipitation has typically been near or below normal. The most recent exception was winter 2018-19. The ENSO Region 1+2 anomaly was -1.1°C and the Region 3.4 anomaly was -0.9°C for the week centered around December 1. For the past six weeks, the ENSO Region 1+2 anomaly has averaged -0.87°C and the ENSO Region 3.4 anomaly has averaged -0.92°C. La Niña conditions will likely persist into at least late winter. The SOI was +14.79 today. The preliminary Arctic Oscillation (AO) figure was +1.368 today On December 9 the MJO was in Phase 6 at an amplitude of 2.539 (RMM). The December 8-adjusted amplitude was 2.194 (RMM). Based on sensitivity analysis applied to the latest guidance, there is an implied 88% probability that New York City will have a warmer than normal December (1991-2020 normal). December will likely finish with a mean temperature near 42.4° (3.3° above normal).
-
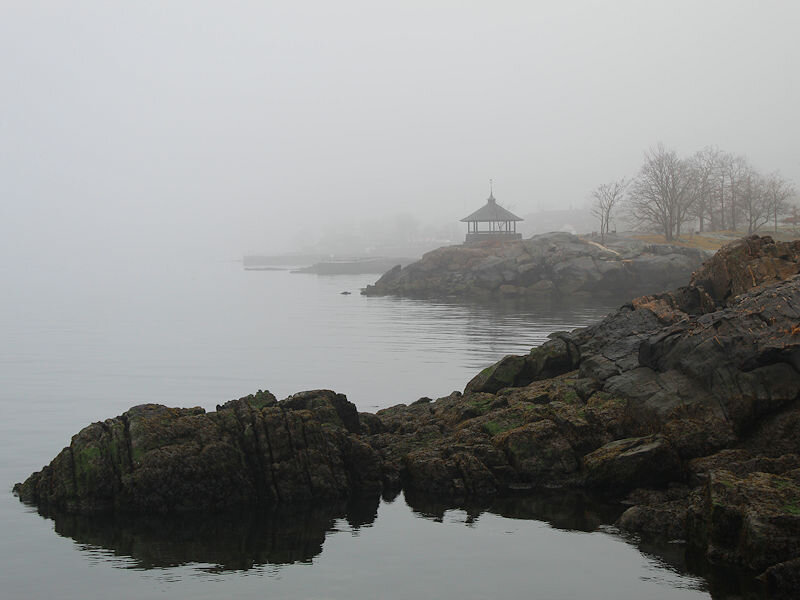
Some photos from this morning’s passage of the warm front:

-
Phone apps, if this is an app, may not necessarily use the Central Park reading.
-
NWS New York NY @NWSNewYorkNY · 16m Central Park has also broken the high temperature record for 12/11 with a 65° reading. This breaks the old record of 64° that was set in 1879. #NYCwx #NYwx
-
It really depends where the warm air is pushing. Usually LGA and JFK respond fairly quickly. Elsewhere, Boston rose 14 degrees in the past hour from 47 to 61.
-
Newark has now reached 66. The old record was 65, which was set in 1966 and tied in 1971.
-
Morning thoughts… Today will be mostly cloudy and very warm. Temperatures will approach or break daily records. Showers and strong to perhaps severe thunderstorms are likely later in the day or at night. It will also become very windy. High temperatures will likely reach the lower and middle 60s in most of the region. Likely high temperatures around the region include: New York City (Central Park): 62° Newark: 66° Philadelphia: 67° Normals: New York City: 30-Year: 45.5°; 15-Year: 46.1° Newark: 30-Year: 46.0°; 15-Year: 46.8° Philadelphia: 30-Year: 47.1°; 15-Year: 48.0° Tomorrow will be partly sunny, breezy and cooler. Daily records for December 11: Allentown: 61°, 1952 and 1979 Baltimore: 69°, 1979 New York City: 64°, 1879 Newark: 65°, 1966 and 1971 Philadelphia: 65°, 1899 and 1971 Washington, DC: 68°, 1897, 1971, and 1979
-
1st measurable snow in Denver and record-tying number of days without measurable snow. https://twitter.com/NWSBoulder/status/1469513290044764160?s=20
-
It’s been a terrible night. A nursing home took a direct hit. Waiting on the news, but there were probably numerous casualties.
-
Temperatures will likely soar to near record and record levels tomorrow in the Middle Atlantic region in advance of another cold front. The air mass that will send temperatures reaching for records resulted in numerous records including: Greenville, MS: 84° (old record: 82°, 1918) ***2nd highest December temperature*** Little Rock: 78° (tied record set in 1889) Shreveport: 84° (old record: 78°, 2020) ***Tied December Record*** Passage of the front could be marked by strong winds and strong to perhaps severe thunderstorms. The front will bring a transient shot of somewhat cooler air to the region. A significant warmup is possible beginning after the middle of next week. No Arctic blasts appear likely for the foreseeable future. Overall, through December 20th, temperatures will likely be warmer than normal in the means with some short-lived cool shots. Afterward, the AO could go negative, increasing the opportunity for colder outcomes. Out West, Denver finally picked up its first measurable snowfall of the season. The previous record latest first measurable snowfall occurred on November 21, 1934. The progression of Denver's latest first measurable snowfall of the season is as follows: November 11, 1882 November 16, 1894 November 19, 1931 November 21, 1934 December 10, 2021 The base case is that the closing 10 days of December could turn cooler, though not necessarily cold. Since 1950, there have been 7 cases where the AO averaged +2.000 or above during the first week in December, as has been the case this year. The mean December 21-31 temperature in New York City was 40.2°. The median temperature was 41.5°. The coldest was 35.3° (1951) and the warmest was 44.0° (1979). In short, this historic experience would suggest that there will be no severe Arctic outbreaks in the East this month. It also suggests that New York City will likely have an average temperature of 40° or above this month. Following very wet July-September periods, winter (December-February) precipitation has typically been near or below normal. The most recent exception was winter 2018-19. The ENSO Region 1+2 anomaly was -1.1°C and the Region 3.4 anomaly was -0.9°C for the week centered around December 1. For the past six weeks, the ENSO Region 1+2 anomaly has averaged -0.87°C and the ENSO Region 3.4 anomaly has averaged -0.92°C. La Niña conditions will likely persist into at least late winter. The SOI was +9.13 today. The preliminary Arctic Oscillation (AO) figure was +1.143 today On December 8 the MJO was in Phase 6 at an amplitude of 2.189 (RMM). The December 7-adjusted amplitude was 2.014 (RMM). Based on sensitivity analysis applied to the latest guidance, there is an implied 84% probability that New York City will have a warmer than normal December (1991-2020 normal). December will likely finish with a mean temperature near 42.3° (3.2° above normal).
-
NWS Boulder: Denver: 0.3” snow
-
IMO, @bluewave's posting top 10 outcomes is useful. It provides historic climate context. For example, if one looks at the 10 warmest first weeks in December at Islip, one finds that 7 of the 12 years (some ties lead to a n>10) have occurred 2000 or later. This information is especially valuable when one is dealing with stations with long periods of record. That such warmth is becoming a "new normal" is a different issue. Looking in greater detail, ISP saw 6/7 days above normal during the first week of December. 2 days had anomalies of +5 or above (1 of which had an anomaly > +10). By any measure, the first week of December was a warm one. Such warmth is becoming more frequent. It is no surprise that the 1991-2020 climate normals are warmer than the 1981-2010 ones given these developments.
-
FYI, it appears that Denver finally saw its first measurable snowfall of the season. NWS will be providing an update soon. That update will confirm whether the light snow was, in fact, measurable.
-
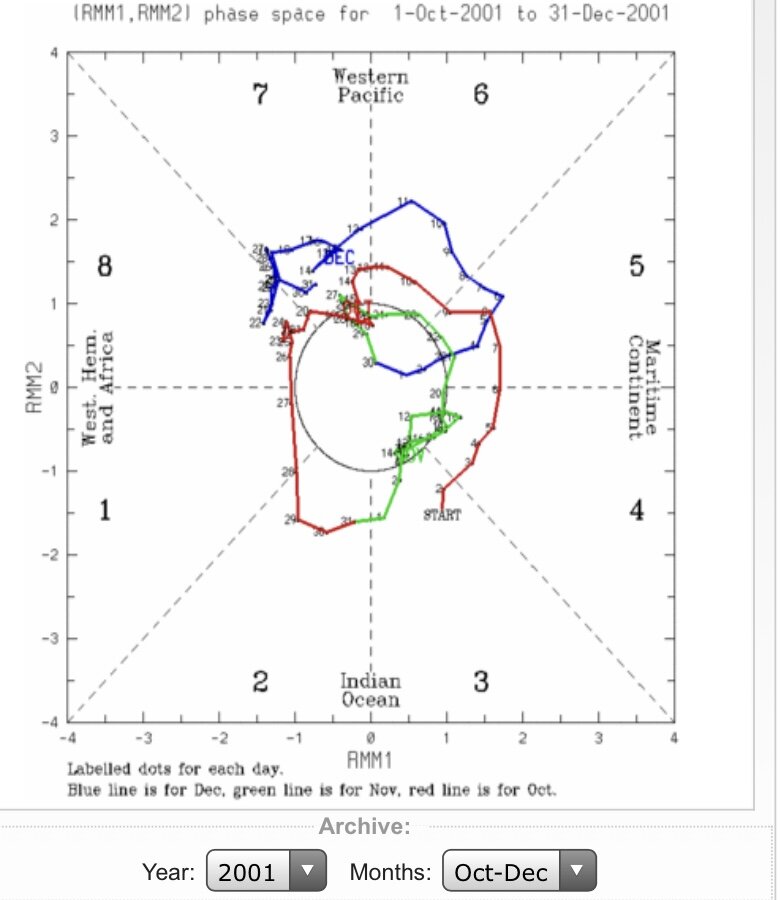
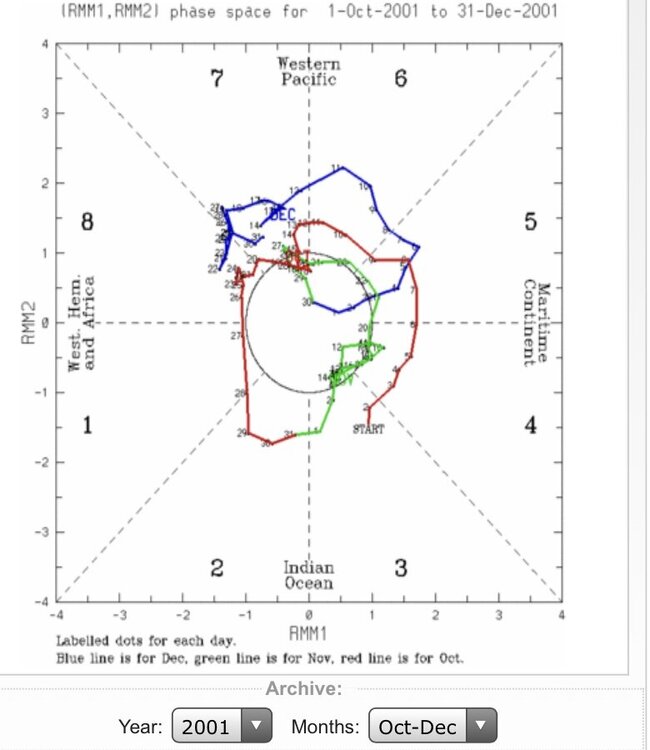
With regard to the MJO, forecasting uncertainty beyond a week notwithstanding, there have been exceptions to what one would typically expect. In December 2001, the MJO moved into Phase 8. The EPO went negative late in the month and then reverted back to predominantly positive values in early January. At present, I still believe the base case is that it will turn cooler during the closing 10 days of the month. Severe cold may not occur in the Middle Atlantic region this month. Afterwards, there will be a risk that the cooler pattern breaks down after two weeks or so, as the predominant EPO+/AO+/PNA- pattern tries to reassert itself. The Gulf of Alaska SSTs and PDO- may make it difficult to sustain a persistently cold pattern. Hopefully, my concerns will prove incorrect. Overall, I still don’t think this will be a variation of the 2001-02 winter. But it will likely be mild (DJF anomaly) and the AO-seasonal snowfall data speaks for itself.
-
Morning thoughts… Today will be partly cloudy milder. High temperatures will likely reach the upper 40s and lower 50s in most of the region. Likely high temperatures around the region include: New York City (Central Park): 50° Newark: 53° Philadelphia: 53° Normals: New York City: 30-Year: 45.8°; 15-Year: 46.4° Newark: 30-Year: 46.3°; 15-Year: 47.1° Philadelphia: 30-Year: 47.4°; 15-Year: 48.3° Near record or perhaps even record warmth is possible in parts of the region tomorrow ahead of a cold front. Strong winds and strong to sever thunderstorms could mark the frontal passage. Daily records for December 11: Allentown: 61°, 1952 and 1979 Baltimore: 69°, 1979 New York City: 64°, 1879 Newark: 65°, 1966 and 1971 Philadelphia: 65°, 1899 and 1971 Washington, DC: 68°, 1897, 1971, and 1979
-
Hopefully, far sooner than that.
-
Yes. That’s where things appear headed.
-
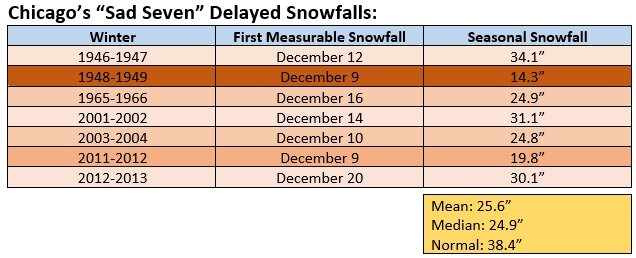
An area of light snow missed Chicago today. As a result, Chicago has joined seven prior years that saw no measurable snowfall through December 9. Those winters wound up with below to much below normal seasonal snowfall.