

donsutherland1
-
Posts
24,103 -
Joined
Content Type
Profiles
Blogs
Forums
American Weather
Media Demo
Store
Gallery
Everything posted by donsutherland1
-
There were 3 tornadoes on June 30, 1998. This was likely a record-tying outbreak for Long Island. https://data.democratandchronicle.com/tornado-archive/
-
Tomorrow will be another unseasonably cool day. Much of the region will again see temperatures rise no higher than the middle and upper 40s. The cool weather will likely continue until midweek. Overall, there remains uncertainty about the temperature anomaly for the second half of November. However, the latest teleconnections forecasts now suggest that the AO will drop sharply to somewhere between -3.000 and -1.000 on or after November 20. Such an outcome favors a period of colder than normal weather (November 20-30, 1991-2020 period): Boston: Normal: 42.2°; AO cases: 38.4° New York City: Normal: 45.5°; AO cases: 41.7° Philadelphia: Normal: 45.4°; AO cases: 41.7° Fall 2021 is well on course to being wetter to much wetter than normal in the northern Middle Atlantic region. Since 1869, there have been 9 August cases where New York City picked up 20.00" or more rainfall during the summer. Two thirds of those cases (and 4/5 of those with summer mean temperatures of 73.0° or above) had 17.00" or more fall precipitation in New York City. 2011 is probably the closest match in terms of precipitation and a nearly identical summer mean temperature. Mean fall precipitation for those 9 cases was 14.86". The median was 17.35". The 1991-2020 normal value is 12.27". Fall rainfall through November 14 4 pm is 16.11". Following very wet July-September periods, winter (December-February) precipitation has typically been near or below normal. The most recent exception was winter 2018-19. The ENSO Region 1+2 anomaly was -0.8°C and the Region 3.4 anomaly was -1.0°C for the week centered around November 3. For the past six weeks, the ENSO Region 1+2 anomaly has averaged -0.27°C and the ENSO Region 3.4 anomaly has averaged -0.78°C. La Niña conditions will likely persist into at least late winter. The SOI was +7.12 today. The preliminary Arctic Oscillation (AO) figure was +0.428 today. On November 12 the MJO was in Phase 5 at an amplitude of 1.104 (RMM). The November 11-adjusted amplitude was 1.135 (RMM). Based on sensitivity analysis applied to the latest guidance, there is an implied 56% probability that New York City will have a cooler than normal November (1991-2020 normal). November will likely finish with a mean temperature near 47.7° (0.3° below normal).
-
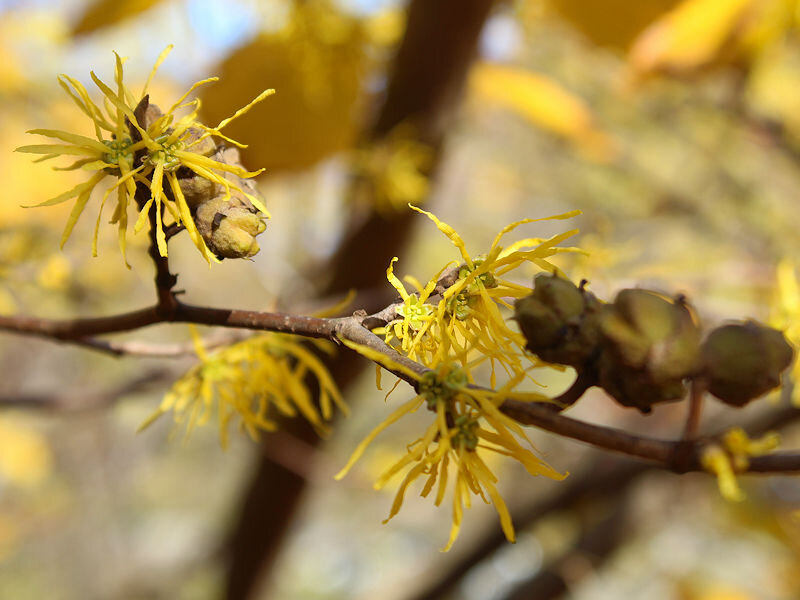
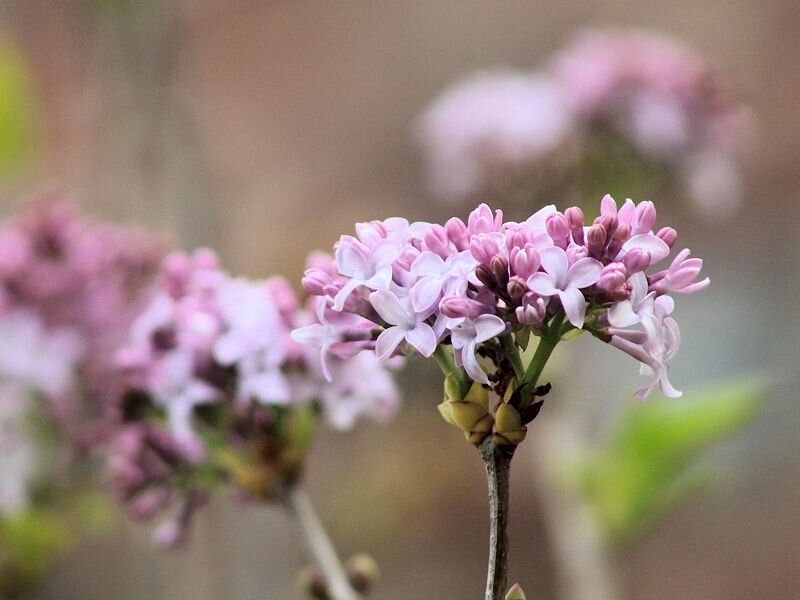
A forecast will bust—either calls for a cold winter or nature’s seemingly warm outlook: Viburnum Witch Hazel Lilac

-
Morning thoughts… Today will be variably cloudy and unseasonably cool. High temperatures will likely reach the middle and upper 40s in most of the region. Likely high temperatures around the region include: New York City (Central Park): 46° Newark: 50° Philadelphia: 48° Normals: New York City: 30-Year: 54.5°; 15-Year: 54.6° Newark: 30-Year: 55.5°; 15-Year: 55.7° Philadelphia: 30-Year: 56.4°; 15-Year: 56.4° Unseasonably cool weather will continue until midweek.
-
Mild and tranquil conditions came to a crashing end as violent thunderstorms with high winds, hail, and heavy downpours moved rapidly across the region. Tornadoes inflicted damage in parts of Long Island. In the wake of the responsible frontal passage, temperatures plummeted into the lower and middle 40s. Tomorrow will be an unseasonably cool day. Much of the region will see temperatures rise no higher than the middle and upper 40s. The cool weather will likely continue until midweek. Overall, there remains uncertainty about the temperature anomaly for the second half of November. With the MJO oscillating between Phases 3 and 4 over the past week, there is little signal for a change from the current back-and-forth pattern. The CFSv2 actually shows a strong warmup during and beyond week 1, but it is currently a warm outlier. However, the risk of that scenario cannot be written off altogether. Fall 2021 is well on course to being wetter to much wetter than normal in the northern Middle Atlantic region. Since 1869, there have been 9 August cases where New York City picked up 20.00" or more rainfall during the summer. Two thirds of those cases (and 4/5 of those with summer mean temperatures of 73.0° or above) had 17.00" or more fall precipitation in New York City. 2011 is probably the closest match in terms of precipitation and a nearly identical summer mean temperature. Mean fall precipitation for those 9 cases was 14.86". The median was 17.35". The 1991-2020 normal value is 12.27". Fall rainfall through November 13 4 pm is 16.11". Following very wet July-September periods, winter (December-February) precipitation has typically been near or below normal. The most recent exception was winter 2018-19. The ENSO Region 1+2 anomaly was -0.8°C and the Region 3.4 anomaly was -1.0°C for the week centered around November 3. For the past six weeks, the ENSO Region 1+2 anomaly has averaged -0.27°C and the ENSO Region 3.4 anomaly has averaged -0.78°C. La Niña conditions will likely persist into at least late winter. The SOI was +13.55 today. The preliminary Arctic Oscillation (AO) figure was -0.195 today. On November 11 the MJO was in Phase 4 at an amplitude of 1.132 (RMM). The November 10-adjusted amplitude was 1.071 (RMM). Based on sensitivity analysis applied to the latest guidance, there is an implied 52% probability that New York City will have a cooler than normal November (1991-2020 normal). November will likely finish with a mean temperature near 47.7° (0.3° below normal).
-
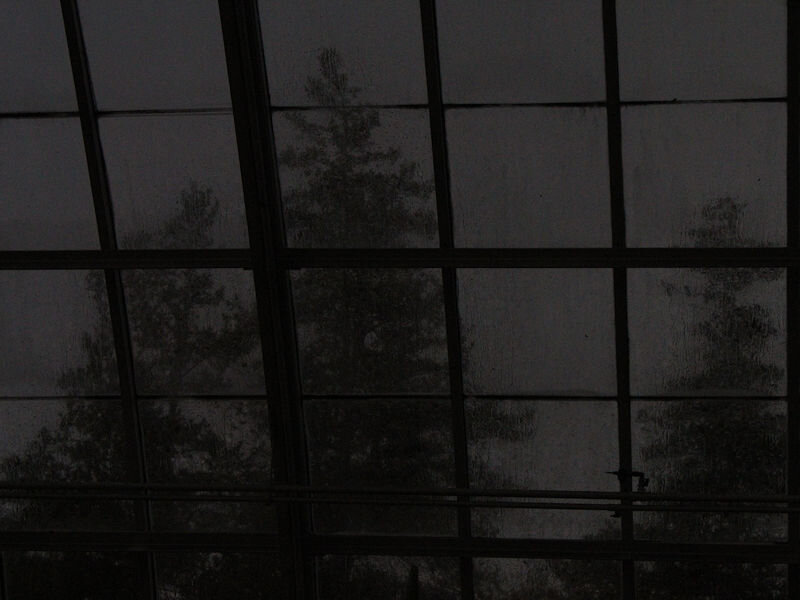
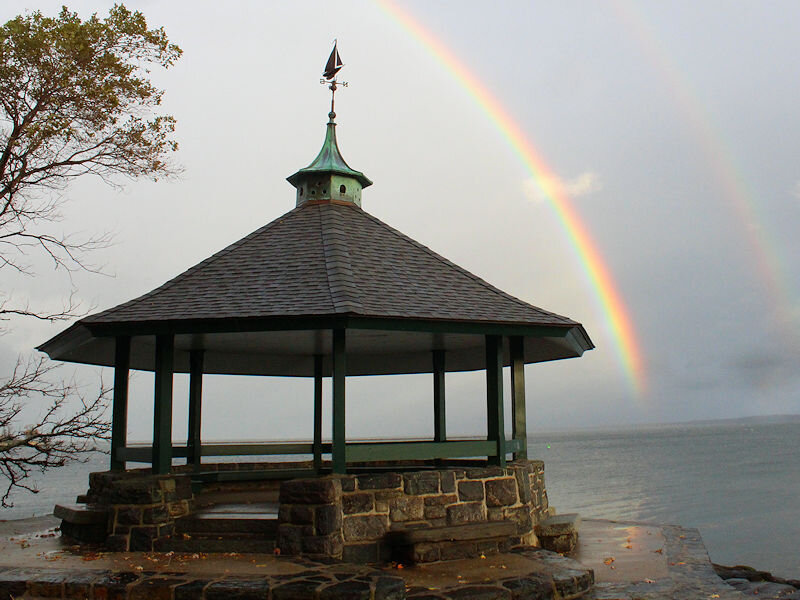
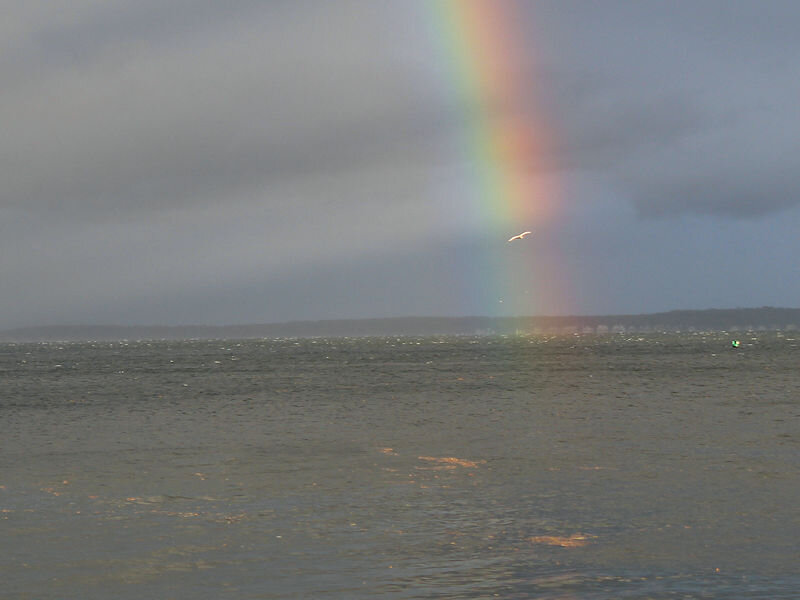
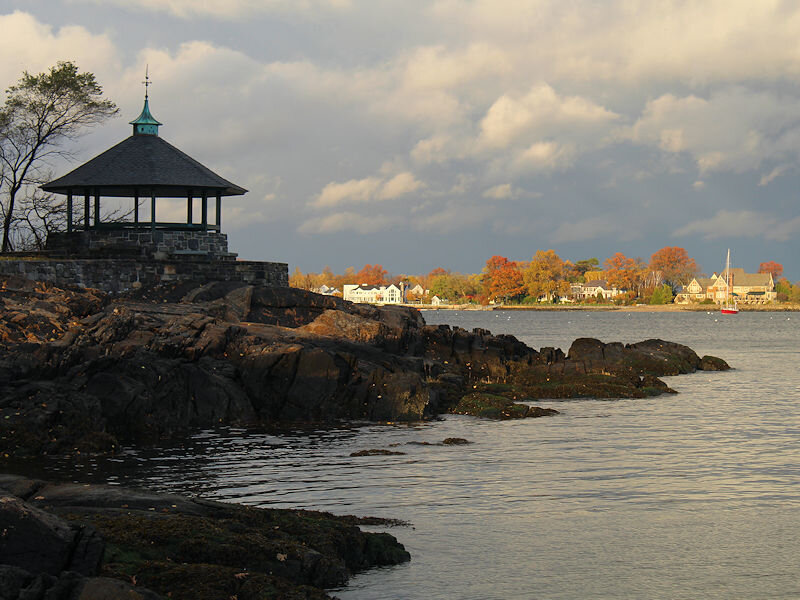
Some photos from today’s severe thunderstorms.
-
Neighbor reported pea-sized hail in Mamaroneck, NY.
-
I live in Larchmont, which isn’t too far from there.
-
Toward the end of the hailstorm. Small hail was still falling at the New York Botanical Garden.
-
Pea sized hail at the New York Botanical Garden.
-
Morning thoughts… Today will be partly sunny, breezy, and cooler. A heavier shower or thundershower is likely. A few locations could even see some pea-sized hail. High temperatures will likely reach the upper 50s and lower 60s in most of the region. Likely high temperatures around the region include: New York City (Central Park): 60° Newark: 64° Philadelphia: 60° Normals: New York City: 30-Year: 54.9°; 15-Year: 54.9° Newark: 30-Year: 55.8°; 15-Year: 56.0° Philadelphia: 30-Year: 56.8°; 15-Year: 56.8° Tomorrow and early next week will feature unseasonably cool weather.
-
An advancing cold front brought some periods of rain and gusty winds to the region. During the afternoon, sunshine returned from west to east. Rainfall totals were generally lighter than 0.50". New York City's year-to-date rainfall increased to 57.71", which ranks 2021 as the 14th wettest year on record. There is an implied 95% probability (1971-2020 base) that New York City will reach 60" or more precipitation for only the 9th time on record. There is an implied 41% probability that New York City could reach 65" or more precipitation for the year. The last time New York City recorded 60" or more annual precipitation was 2018 when 65.55" of precipitation was measured. In the wake of the cold front's passage, it will turn noticeably cooler for the weekend and into next week. Tomorrow could see an afternoon shower or thundershower as lapse rates increase and very cool air moves aloft. Sunday will be even cooler with the temperature staying below 50° in many parts of the region. Overall, there remains considerable uncertainty about the temperature anomaly for the second half of November. With the MJO oscillating between Phases 3 and 4 over the past week, there is little signal for a change from the current back-and-forth pattern. The CFSv2 actually shows a strong warmup during and beyond week 1, but it is currently a warm outlier. However, the risk of that scenario cannot be written off altogether. Fall 2021 is well on course to being wetter to much wetter than normal in the northern Middle Atlantic region. Since 1869, there have been 9 August cases where New York City picked up 20.00" or more rainfall during the summer. Two thirds of those cases (and 4/5 of those with summer mean temperatures of 73.0° or above) had 17.00" or more fall precipitation in New York City. 2011 is probably the closest match in terms of precipitation and a nearly identical summer mean temperature. Mean fall precipitation for those 9 cases was 14.86". The median was 17.35". The 1991-2020 normal value is 12.27". Fall rainfall through November 12 4 pm is 15.78". Following very wet July-September periods, winter (December-February) precipitation has typically been near or below normal. The most recent exception was winter 2018-19. The ENSO Region 1+2 anomaly was -0.8°C and the Region 3.4 anomaly was -1.0°C for the week centered around November 3. For the past six weeks, the ENSO Region 1+2 anomaly has averaged -0.27°C and the ENSO Region 3.4 anomaly has averaged -0.78°C. La Niña conditions will likely persist through at least mid-winter. The SOI was +14.82 today. The preliminary Arctic Oscillation (AO) figure was -0.272 today. On November 10 the MJO was in Phase 4 at an amplitude of 1.070 (RMM). The November 9-adjusted amplitude was 0.892 (RMM). Based on sensitivity analysis applied to the latest guidance, there is an implied 52% probability that New York City will have a cooler than normal November (1991-2020 normal). November will likely finish with a mean temperature near 47.7° (0.3° below normal).
-
Morning thoughts… Today will be rainy, windy, and mild. Thunderstorms are possible. A general 0.50”-1.50” rainfall is likely. Late clearing is likely. High temperatures will likely reach the middle and upper 60s in most of the region. Likely high temperatures around the region include: New York City (Central Park): 65° Newark: 69° Philadelphia: 67° Normals: New York City: 30-Year: 55.2°; 15-Year: 55.2° Newark: 30-Year: 56.2°; 15-Year: 56.4° Philadelphia: 30-Year: 57.2°; 15-Year: 57.1° Tomorrow will mark the start of a noticeably cooler period. A heavy shower or thundershower is possible in some areas.
-
At 5:40 pm, an area of moderate to heavy rain stretched from Alabama to western Ontario and was heading eastward. Rain associated with that front will arrive during the overnight hours and continue into tomorrow. Some of the rain could be heavy. Some areas could even see a thunderstorm. A general 0.50"-1.50" rainfall is likely. Temperatures will hold nearly steady and then rise late at night before rebounding into the lower and middle 60s tomorrow. Afterward, it will turn noticeably cooler for the weekend and into next week. Uncertainty about the overall temperature anomaly for the second half of November has increased. Fall 2021 will likely be wetter to much wetter than normal in the northern Middle Atlantic region. Since 1869, there have been 9 August cases where New York City picked up 20.00" or more rainfall during the summer. Two thirds of those cases (and 4/5 of those with summer mean temperatures of 73.0° or above) had 17.00" or more fall precipitation in New York City. 2011 is probably the closest match in terms of precipitation and a nearly identical summer mean temperature. Mean fall precipitation for those 9 cases was 14.86". The median was 17.35". The 1991-2020 normal value is 12.27". Fall rainfall through November 10 4 pm is 15.29". Following very wet July-September periods, winter (December-February) precipitation has typically been near or below normal. The most recent exception was winter 2018-19. The ENSO Region 1+2 anomaly was -0.8°C and the Region 3.4 anomaly was -1.0°C for the week centered around November 3. For the past six weeks, the ENSO Region 1+2 anomaly has averaged -0.27°C and the ENSO Region 3.4 anomaly has averaged -0.78°C. La Niña conditions will likely persist through at least mid-winter. The SOI was +22.01 today. The preliminary Arctic Oscillation (AO) figure was +0.252 today. On November 9 the MJO was in Phase 3 at an amplitude of 0.895 (RMM). The November 8-adjusted amplitude was 0.963 (RMM). Based on sensitivity analysis applied to the latest guidance, there is an implied 52% probability that New York City will have a cooler than normal November (1991-2020 normal). November will likely finish with a mean temperature near 47.7° (0.3° below normal).
-
Morning thoughts… Clouds will increase this afternoon and rain will arrive during the evening or overnight hours. That rain could fall heavily at times and it will continue into Friday. A general 0.50”-1.50” rainfall is likely. It will be cooler than recent days. High temperatures will likely reach the upper 50s and lower 60s in most of the region. Likely high temperatures around the region include: New York City (Central Park): 59° Newark: 64° Philadelphia: 66° Normals: New York City: 30-Year: 55.6°; 15-Year: 55.6° Newark: 30-Year: 56.6°; 15-Year: 56.8° Philadelphia: 30-Year: 57.6°; 15-Year: 57.5° Tomorrow will be warmer, but it will turn noticeably cooler this weekend.
-
Sunshine will give way to increasing clouds tomorrow afternoon. it will be a bit cooler than today. Rain will arrive during the evening or overnight hours and continue into Friday. Some of the rain could be heavy. A general 0.50"-1.50" rainfall is likely. Temperatures will also rebound on Friday. Afterward, it will turn noticeably cooler for the weekend and into next week. Uncertainty about the overall temperature anomaly for the second half of November has increased. Fall 2021 will likely be wetter to much wetter than normal in the northern Middle Atlantic region. Since 1869, there have been 9 August cases where New York City picked up 20.00" or more rainfall during the summer. Two thirds of those cases (and 4/5 of those with summer mean temperatures of 73.0° or above) had 17.00" or more fall precipitation in New York City. 2011 is probably the closest match in terms of precipitation and a nearly identical summer mean temperature. Mean fall precipitation for those 9 cases was 14.86". The median was 17.35". The 1991-2020 normal value is 12.27". Fall rainfall through November 10 4 pm is 15.29". Following very wet July-September periods, winter (December-February) precipitation has typically been near or below normal. The most recent exception was winter 2018-19. The ENSO Region 1+2 anomaly was -0.8°C and the Region 3.4 anomaly was -1.0°C for the week centered around November 3. For the past six weeks, the ENSO Region 1+2 anomaly has averaged -0.27°C and the ENSO Region 3.4 anomaly has averaged -0.78°C. La Niña conditions will likely persist through at least mid-winter. The SOI was +18.32 today. The preliminary Arctic Oscillation (AO) figure was +0.778 today. On November 8 the MJO was in Phase 3 at an amplitude of 0.964 (RMM). The November 7-adjusted amplitude was 1.112 (RMM). Based on sensitivity analysis applied to the latest guidance, there is an implied 54% probability that New York City will have a cooler than normal November (1991-2020 normal). November will likely finish with a mean temperature near 47.7° (0.3° below normal).
-
There might still be periods of Atlantic blocking to provide snowfall opportunities.
-
This isn’t what one would typically see before sustained EPO- periods:
-
I am hesitant to think this could be the last of the year. There’s still opportunity for more unseasonable warmth before the year ends. In fact, some of the guidance has dramatically backed off the idea of a cold second half of November.
-
Morning thoughts… Today will become mostly sunny and warm. High temperatures will likely reach the middle and upper 60s in most of the region. Likely high temperatures around the region include: New York City (Central Park): 64° Newark: 69° Philadelphia: 68° Normals: New York City: 30-Year: 55.9°; 15-Year: 55.9° Newark: 30-Year: 56.9°; 15-Year: 57.2° Philadelphia: 30-Year: 57.9°; 15-Year: 57.8° It will turn noticeably cooler this weekend.
-
JFK 69 LGA 72 MPO 63
-
Another cold front will be crossing the region on Friday. Ahead of the front, warmer air will push northward. As a result, the temperature will hold nearly steady Thursday night and could begin to rise before sunrise.
-
A weak cold front will move across the region tomorrow. Behind it, Thursday will turn somewhat cooler.
-
Under abundant sunshine, the mercury surged into the upper 60s and lower 70s across much of the region. High temperatures included: Allentown: 69° Baltimore: 75° Boston: 70° Bridgeport: 64° Hartford: 70° Islip: 70° New York City: 68° Newark: 74° Philadelphia: 71° Portland: 66° Providence: 71° Washington, DC: 73° Newark reached 70° for the 176th time this year. The old record was 173 days, which was set in 2010. Four of the five years that saw 170 or more such days have occurred since 2000 and three have occurred since 2010. With the exception of Thursday, the unseasonable warmth will persist through Friday. Nevertheless, the first 10 days of November will average solidly cooler than normal in the Middle Atlantic and southern New England regions. A cold front will bring some rain Thursday night into Friday. A general 0.50"-1.50" rainfall is likely. Afterward, it will turn noticeably cooler for the weekend and into next week. Fall 2021 will likely be wetter to much wetter than normal in the northern Middle Atlantic region. Since 1869, there have been 9 August cases where New York City picked up 20.00" or more rainfall during the summer. Two thirds of those cases (and 4/5 of those with summer mean temperatures of 73.0° or above) had 17.00" or more fall precipitation in New York City. 2011 is probably the closest match in terms of precipitation and a nearly identical summer mean temperature. Mean fall precipitation for those 9 cases was 14.86". The median was 17.35". The 1991-2020 normal value is 12.27". Fall rainfall through November 9 4 pm is 15.29". Following very wet July-September periods, winter (December-February) precipitation has typically been near or below normal. The most recent exception was winter 2018-19. The ENSO Region 1+2 anomaly was -0.8°C and the Region 3.4 anomaly was -1.0°C for the week centered around November 3. For the past six weeks, the ENSO Region 1+2 anomaly has averaged -0.27°C and the ENSO Region 3.4 anomaly has averaged -0.78°C. La Niña conditions will likely persist through at least mid-winter. The SOI was +20.61 today. The preliminary Arctic Oscillation (AO) figure was +1.143 today. On November 7 the MJO was in Phase 4 at an amplitude of 1.113 (RMM). The November 6-adjusted amplitude was 1.184 (RMM). Based on sensitivity analysis applied to the latest guidance, there is an implied 57% probability that New York City will have a cooler than normal November (1991-2020 normal). November will likely finish with a mean temperature near 47.6° (0.4° below normal).
-
Morning thoughts… Today will be mostly sunny and warm. High temperatures will likely reach the upper 60s and lower 70s in most of the region. Likely high temperatures around the region include: New York City (Central Park): 67° Newark: 72° Philadelphia: 70° Normals: New York City: 30-Year: 56.2°; 15-Year: 56.2° Newark: 30-Year: 57.3°; 15-Year: 57.5° Philadelphia: 30-Year: 58.3°; 15-Year: 58.2° Temperatures will average above to much above normal through much of the week.

