

donsutherland1
-
Posts
24,103 -
Joined
Content Type
Profiles
Blogs
Forums
American Weather
Media Demo
Store
Gallery
Everything posted by donsutherland1
-
OBS and nowcast 9PM tonight-8A Wednesday for a general 2-5" rain, isolated 8" possible. 40-60 kt damaging wind likely Tuesday-early Wednesday. Focus for damaging wind and heaviest rain is the I95 corridor to the coasts. Power outages esp CT LI.
donsutherland1 replied to wdrag's topic in New York City Metro
No. 2021 is tied with 1903, 1972, and 2005 for the record of 2 such days.- 228 replies
-
- 1
-

-
- heavy rain
- flash flooding
- (and 2 more)
-
OBS and nowcast 9PM tonight-8A Wednesday for a general 2-5" rain, isolated 8" possible. 40-60 kt damaging wind likely Tuesday-early Wednesday. Focus for damaging wind and heaviest rain is the I95 corridor to the coasts. Power outages esp CT LI.
donsutherland1 replied to wdrag's topic in New York City Metro
NYC’s Central Park has now recorded 3” daily precipitation for the 3rd time this year. The last time that happened was in 2011 when there were also 3 days. 3 of the 7 years with 3 or more such days occurred since 2000 and 6 have occurred after 1970 when the climate abruptly grew wetter.- 228 replies
-
- 5
-

-
- heavy rain
- flash flooding
- (and 2 more)
-
An area of moderate to heavy rain will continue to push westward into the New York City Metro Area this evening. Overnight, a general 0.50"-1.00" with some higher amounts is likely. Through 5 pm today, New York City has picked up 55.28" of rain. As a result, 2021 currently ranks as New York City's 20th wettest year on record. Another significant rainfall, probably along the lines of 0.50"-1.50" with locally higher amounts, is possible late in the week. No sharp cold shots appear likely through the remainder of October. It will likely turn cooler, but not exceptionally cold, during the start of November. The duration of the cooler weather remains uncertain. The following locations are on course to challenge or establish new record high lowest monthly temperatures for October (through October 26 4 pm): Bridgeport: 43° (record: 41°, 2004) Buffalo: 42° (record: 39°, 1971) Islip: 42° (record: 40°, 1971 and 2017) New York City-JFK: 47° (record: 46°, 1971) New York City-LGA: 51° (record: 47°, 1971) New York City-NYC: 47° (record: 45°, 1946 and 1971) Newark: 45° (record: 45°, 1971) Philadelphia: 46° (record: 45°, 1882, 1927 and 1931) Poughkeepsie: 36° (record: 35°, 1971, 1995 and 1996) White Plains: 41° (record: 40°, 1971) The MJO had completed its passage through Phase 5 at a very high amplitude during the first half of October. During the 1991-2020 period, there were 6 cases with passage through Phase 5 with at least three days at an amplitude of 1.500 or above: 1998, 2000, 2004, 2010, 2017, and 2020. There was a strong signal for the second half of October to wind up warmer than normal (83%) cases in the New York City area. However, that signal broke down to a 50-50 split for the first 10 days of November. That hints at possible timing for a pattern transition depending on the pattern evolution and changes in the teleconnections. Fall 2021 will likely be wetter to much wetter than normal in the northern Middle Atlantic region. Since 1869, there have been 9 August cases where New York City picked up 20.00" or more rainfall during the summer. Two thirds of those cases (and 4/5 of those with summer mean temperatures of 73.0° or above) had 17.00" or more fall precipitation in New York City. 2011 is probably the closest match in terms of precipitation and a nearly identical summer mean temperature. Mean fall precipitation for those 9 cases was 14.86". The median was 17.35". The 1991-2020 normal value is 12.27". Following very wet July-September periods, winter (December-February) precipitation has typically been near or below normal. The most recent exception was winter 2018-19. The ENSO Region 1+2 anomaly was -0.7°C and the Region 3.4 anomaly was -0.8°C for the week centered around October 20. For the past six weeks, the ENSO Region 1+2 anomaly has averaged +0.05°C and the ENSO Region 3.4 anomaly has averaged -0.52°C. La Niña conditions will likely persist through at least mid-winter. The SOI was +3.67 today. The preliminary Arctic Oscillation (AO) figure was +1.374 today. On October 24 the MJO was in Phase 2 at an amplitude of 0.761 (RMM). The October 23-adjusted amplitude was 0.782 (RMM). Based on sensitivity analysis applied to the latest guidance, there is an implied near 100% probability that New York City will have a warmer than normal October (1991-2020 normal). October will likely finish with a mean temperature near 62.0° (4.1° above normal).
-
OBS and nowcast 9PM tonight-8A Wednesday for a general 2-5" rain, isolated 8" possible. 40-60 kt damaging wind likely Tuesday-early Wednesday. Focus for damaging wind and heaviest rain is the I95 corridor to the coasts. Power outages esp CT LI.
donsutherland1 replied to wdrag's topic in New York City Metro
000 NOUS41 KOKX 261312 PNSOKX NOUS41 KOKX 261243 PNSOKX CTZ005>012-NJZ002-004-006-103>108- NYZ067>075-078>081-176>179-270036- PUBLIC INFORMATION STATEMENT NATIONAL WEATHER SERVICE NEW YORK NY 911 AM EDT TUE OCT 26 2021 ...RAINFALL REPORTS OVER THE LAST 24 HOURS... LOCATION AMOUNT TIME/DATE PROVIDER ...CONNECTICUT... ...FAIRFIELD COUNTY... ARMONK 1.99 IN 0820 AM 10/26 CWOP GREENWICH 1.73 IN 0815 AM 10/26 CWOP STAMFORD 1.55 IN 0825 AM 10/26 AWS 3 N NEW CANAAN 1.47 IN 0830 AM 10/26 AWS DANBURY 1.36 IN 0815 AM 10/26 CWOP OLD GREENWICH 1.35 IN 0800 AM 10/26 COCORAHS DANBURY 1.26 IN 0819 AM 10/26 CWOP STAMFORD 1.24 IN 0829 AM 10/26 AWS NORWALK 1.22 IN 0800 AM 10/26 COCORAHS WESTPORT 1.20 IN 0815 AM 10/26 CWOP DANBURY AIRPORT 1.18 IN 0753 AM 10/26 ASOS BRIDGEPORT 1.15 IN 0815 AM 10/26 CWOP BETHEL 1.12 IN 0730 AM 10/26 COCORAHS FAIRFIELD 1.11 IN 0815 AM 10/26 CWOP STAMFORD 1.10 IN 0815 AM 10/26 CWOP DARIEN 3.6 N 1.05 IN 0827 AM 10/26 COCORAHS ...MIDDLESEX COUNTY... CHESTER CENTER 2.7 WNW 1.50 IN 0758 AM 10/26 COCORAHS KILLINGWORTH 1.47 IN 0700 AM 10/26 COCORAHS CLINTON 1.47 IN 0816 AM 10/26 CWOP KILLINGWORTH 1.42 IN 0700 AM 10/26 COCORAHS SAYBROOK MANOR 1.41 IN 0830 AM 10/26 AWS ESSEX 1.35 IN 0754 AM 10/26 COCORAHS WESTBROOK 1.32 IN 0815 AM 10/26 CWOP DURHAM 1.24 IN 0825 AM 10/26 AWS SALEM 2.8 WNW 1.23 IN 0700 AM 10/26 COCORAHS HIGGANUM 1.16 IN 0700 AM 10/26 COCORAHS MIDDLETOWN 1.09 IN 0819 AM 10/26 CWOP MIDDLEFIELD 1.07 IN 0829 AM 10/26 AWS ...NEW HAVEN COUNTY... KILLINGWORTH 1.20 IN 0700 AM 10/26 COCORAHS GUILFORD 1.02 IN 0700 AM 10/26 COOP GUILFORD 1.7 W 1.00 IN 0700 AM 10/26 COCORAHS ...NEW LONDON COUNTY... NORWICH 1.56 IN 0700 AM 10/26 COOP OLD LYME 1.7 NNE 1.50 IN 0700 AM 10/26 COCORAHS PRESTON 1.43 IN 0700 AM 10/26 COCORAHS NEW LONDON 1.42 IN 0820 AM 10/26 CWOP GROTON AIRPORT 1.35 IN 0756 AM 10/26 ASOS NORWICH 1.34 IN 0600 AM 10/26 COCORAHS NORWICH 5.2 SE 1.27 IN 0645 AM 10/26 COCORAHS COLCHESTER 0.6 ENE 1.23 IN 0600 AM 10/26 COCORAHS LYME 1.03 IN 0815 AM 10/26 CWOP ...NEW JERSEY... ...BERGEN COUNTY... WALDWICK 3.79 IN 0810 AM 10/26 CWOP NORTH ARLINGTON 3.77 IN 0800 AM 10/26 COCORAHS OAKLAND 3.70 IN 0800 AM 10/26 COCORAHS HASBROUCK HEIGHTS 3.36 IN 0819 AM 10/26 CWOP OAKLAND 3.03 IN 0700 AM 10/26 COCORAHS PARK RIDGE 2.94 IN 0800 AM 10/26 IFLOWS OAKLAND 2.72 IN 0815 AM 10/26 CWOP NEW MILFORD 2.69 IN 0825 AM 10/26 AWS FAIR LAWN 2.60 IN 0820 AM 10/26 CWOP TETERBORO AIRPORT 2.54 IN 0811 AM 10/26 ASOS OAKLAND 2.49 IN 0830 AM 10/26 AWS RIVER VALE 2.47 IN 0830 AM 10/26 AWS PARAMUS 2.43 IN 0830 AM 10/26 AWS 1 SSE FRANKLIN LAKES 2.40 IN 0745 AM 10/26 IFLOWS MAHWAH 2.36 IN 0830 AM 10/26 AWS EMERSON 2.30 IN 0728 AM 10/26 CWOP FAIR LAWN 2.26 IN 0641 AM 10/26 COCORAHS 1 WSW WASHINGTON TOWNSHI 2.24 IN 0700 AM 10/26 TRAINED SPOTTER RIVER EDGE 0.4 NNE 2.23 IN 0700 AM 10/26 COCORAHS LODI 2.20 IN 0745 AM 10/26 IFLOWS MAHWAH 2.15 IN 0830 AM 10/26 AWS LITTLE FERRY 2.12 IN 0830 AM 10/26 AWS CRESSKILL 1.93 IN 0830 AM 10/26 AWS LEONIA 1.91 IN 0830 AM 10/26 AWS 0.6 SW HILLSDALE 1.88 IN 0815 AM 10/26 IFLOWS TENAFLY 1.87 IN 0730 AM 10/26 COCORAHS HACKENSACK 1.84 IN 0815 AM 10/26 CWOP BOGOTA 1.73 IN 0830 AM 10/26 AWS MAYWOOD 0.2 SW 1.12 IN 0700 AM 10/26 COCORAHS ...ESSEX COUNTY... CALDWELL 3.53 IN 0801 AM 10/26 ASOS LIVINGSTON TWP 2.0 NNE 3.51 IN 0755 AM 10/26 COCORAHS WEST CALDWELL 3.02 IN 0815 AM 10/26 CWOP LIVINGSTON 2.95 IN 0815 AM 10/26 CWOP MONTCLAIR 2.94 IN 0700 AM 10/26 COCORAHS MAPLEWOOD 2.92 IN 0754 AM 10/26 COCORAHS WEST CALDWELL 2.92 IN 0830 AM 10/26 AWS BLOOMFIELD 2.84 IN 0815 AM 10/26 CWOP WEST ORANGE 2.81 IN 0819 AM 10/26 CWOP MONTCLAIR 2.69 IN 0830 AM 10/26 AWS MILLBURN 2.61 IN 0815 AM 10/26 CWOP 0.6 SW CALDWELL 2.56 IN 0745 AM 10/26 IFLOWS MILLBURN 2.55 IN 0830 AM 10/26 AWS WEST ORANGE 2.45 IN 0830 AM 10/26 URBANET ORANGE RESERVOIR 2.44 IN 0800 AM 10/26 IFLOWS VERONA 2.29 IN 0805 AM 10/26 COCORAHS ...HUDSON COUNTY... SECAUCUS 3.66 IN 0830 AM 10/26 AWS HARRISON 3.45 IN 0852 AM 10/26 CWOP KEARNY 3.22 IN 0820 AM 10/26 CWOP JERSEY CITY 2.75 IN 0830 AM 10/26 AWS HARRISON 2.68 IN 0700 AM 10/26 COCORAHS 1 SW JERSEY CITY 2.62 IN 0830 AM 10/26 AWS 1 ENE JERSEY CITY 2.19 IN 0830 AM 10/26 AWS HARRISON 2.10 IN 0830 AM 10/26 AWS BAYONNE 1.92 IN 0830 AM 10/26 AWS HOBOKEN 1.65 IN 0816 AM 10/26 CWOP KEARNY 1.30 IN 0815 AM 10/26 CWOP JERSEY CITY 1.26 IN 0830 AM 10/26 AWS ...PASSAIC COUNTY... LITTLE FALLS 3.92 IN 0700 AM 10/26 COCORAHS LITTLE FALLS TWP 0.2 NE 3.83 IN 0800 AM 10/26 COCORAHS WAYNE 3.63 IN 0700 AM 10/26 COCORAHS 0.8 SE POMPTON LAKES 3.61 IN 0730 AM 10/26 HADS 0.8 E WEST PATERSON 3.48 IN 0745 AM 10/26 HADS CHARLOTTESBURG RESERVOIR 3.32 IN 0700 AM 10/26 COOP HAWTHORNE 3.28 IN 0700 AM 10/26 COCORAHS WEST MILFORD 3.19 IN 0819 AM 10/26 CWOP WEST MILFORD TWP 5.7 N 3.12 IN 0740 AM 10/26 COCORAHS 0.9 S WAYNE 3.00 IN 0745 AM 10/26 IFLOWS 2.1 E RINGWOOD 2.76 IN 0745 AM 10/26 IFLOWS 1.5 SW RINGWOOD 2.72 IN 0745 AM 10/26 IFLOWS CLIFTON 2.69 IN 0830 AM 10/26 AWS RINGWOOD 2.63 IN 0710 AM 10/26 RAWS WEST MILFORD 2.56 IN 0745 AM 10/26 IFLOWS HAWTHORNE 2.34 IN 0820 AM 10/26 CWOP HEWITT 1.95 IN 0745 AM 10/26 AWS PASSAIC 1.48 IN 0815 AM 10/26 CWOP OAK RIDGE 1.19 IN 0810 AM 10/26 AWS CLIFTON 1.02 IN 0145 AM 10/26 AWS ...UNION COUNTY... NEW PROVIDENCE 3.95 IN 0730 AM 10/26 COCORAHS MOUNTAINSIDE 3.47 IN 0730 AM 10/26 IFLOWS WESTFIELD 3.35 IN 0745 AM 10/26 COCORAHS CLARK 2.96 IN 0715 AM 10/26 COCORAHS NEWARK AIRPORT 2.70 IN 0751 AM 10/26 ASOS BAYSIDE 2.63 IN 0818 AM 10/26 CWOP WESTFIELD 2.58 IN 0700 AM 10/26 COCORAHS ...NEW YORK... ...BRONX COUNTY... HARLEM 2.00 IN 0830 AM 10/26 AWS ...KINGS COUNTY... BROOKLYN 3.25 IN 0820 AM 10/26 CWOP PROSPECT PARK 3.18 IN 0825 AM 10/26 AWS SOUTH SLOPE 2.70 IN 0820 AM 10/26 CWOP BROOKLYN COLLEGE 2.67 IN 0830 AM 10/26 NYSM SHEEPSHEAD BAY 2.44 IN 0815 AM 10/26 CWOP DYKER HEIGHTS 2.37 IN 0815 AM 10/26 CWOP ...NASSAU COUNTY... GREAT NECK 2.20 IN 0815 AM 10/26 CWOP EAST ROCKAWAY 1.83 IN 0811 AM 10/26 CWOP NORTH MASSAPEQUA 1.70 IN 0816 AM 10/26 CWOP MASSAPEQUA PARK 1.56 IN 0815 AM 10/26 CWOP SYOSSET 1.54 IN 0808 AM 10/26 COOP MUTTONTOWN 1.52 IN 0815 AM 10/26 CWOP ALBERTSON 0.5 SW 1.51 IN 0700 AM 10/26 COCORAHS SEARINGTOWN 1.51 IN 0830 AM 10/26 AWS LYNBROOK 0.6 ENE 1.49 IN 0700 AM 10/26 COCORAHS GLEN HEAD 1.48 IN 0830 AM 10/26 AWS HEWLETT 1.48 IN 0830 AM 10/26 AWS MINEOLA 1.46 IN 0830 AM 10/26 AWS LEVITTOWN 1.45 IN 0816 AM 10/26 CWOP VALLEY STREAM 1.39 IN 0816 AM 10/26 CWOP THOMASTON 1.38 IN 0829 AM 10/26 AWS OYSTER BAY 1.33 IN 0815 AM 10/26 CWOP LEVITTOWN 1.33 IN 0825 AM 10/26 AWS EAST HILLS 1.32 IN 0830 AM 10/26 AWS MASSAPEQUA 1.1 SE 1.30 IN 0700 AM 10/26 COCORAHS WANTAGH 1.29 IN 0830 AM 10/26 NYSM ALBERTSON 0.2 SSE 1.22 IN 0635 AM 10/26 COCORAHS MUTTONTOWN 1.19 IN 0829 AM 10/26 AWS MASSAPEQUA PARK 1.17 IN 0700 AM 10/26 COCORAHS ROCKVILLE CENTRE 1.14 IN 0830 AM 10/26 AWS FREEPORT 1.02 IN 0830 AM 10/26 AWS ...NEW YORK COUNTY... MIDTOWN MANHATTAN 3.00 IN 0825 AM 10/26 AWS BATTERY PARK 2.80 IN 0831 AM 10/26 MESONET MIDTOWN MANHATTAN 2.67 IN 0830 AM 10/26 NYSM MANHATTAN 2.46 IN 0815 AM 10/26 CWOP CENTRAL PARK 2.38 IN 0828 AM 10/26 ASOS BATTERY PARK 2.03 IN 0830 AM 10/26 AWS ...ORANGE COUNTY... GREENWOOD LAKE 3.12 IN 0800 AM 10/26 COCORAHS WARWICK 3.08 IN 0830 AM 10/26 NYSM OTISVILLE 2.72 IN 0830 AM 10/26 NYSM WARWICK 2.56 IN 0700 AM 10/26 COCORAHS 2.6 NW TUXEDO PARK 2.40 IN 0745 AM 10/26 HADS MIDDLETOWN 2.38 IN 0820 AM 10/26 CWOP 0.8 N PORT JERVIS 2.30 IN 0700 AM 10/26 COOP MIDDLETOWN 2.28 IN 0816 AM 10/26 CWOP PORT JERVIS 2.27 IN 0830 AM 10/26 AWS MONTGOMERY AIRPORT 2.13 IN 0754 AM 10/26 AWOS TUXEDO PARK 2.10 IN 0829 AM 10/26 AWS PORT JERVIS 2.07 IN 0630 AM 10/26 COCORAHS MONTGOMERY 2.03 IN 0816 AM 10/26 CWOP WEST POINT 2.00 IN 0830 AM 10/26 AWS US MILITARY ACADEMY 1.99 IN 0755 AM 10/26 RAWS GOSHEN 1.88 IN 0830 AM 10/26 AWS VAILS GATE 1.63 IN 0816 AM 10/26 CWOP HARRIMAN 1.57 IN 0830 AM 10/26 AWS NEWBURGH 1.53 IN 0806 AM 10/26 CWOP WASHINGTONVILLE 1.29 IN 0820 AM 10/26 CWOP CHESTER 1.26 IN 0820 AM 10/26 CWOP MONTGOMERY 1.18 IN 0815 AM 10/26 CWOP ...PUTNAM COUNTY... MAHOPAC 2.74 IN 0830 AM 10/26 AWS CARMEL HAMLET 1.73 IN 0808 AM 10/26 COOP COLD SPRING 1.54 IN 0700 AM 10/26 COCORAHS BREWSTER 1.14 IN 0830 AM 10/26 NYSM ...QUEENS COUNTY... HOWARD BEACH 2.46 IN 0700 AM 10/26 COCORAHS KEW GARDEN HILLS 2.20 IN 0830 AM 10/26 NYSM NYC/JFK AIRPORT 1.76 IN 0751 AM 10/26 ASOS NYC/LA GUARDIA 1.74 IN 0751 AM 10/26 ASOS BELLEROSE 1.51 IN 0811 AM 10/26 CWOP LITTLE NECK 0.3 SE 1.50 IN 0700 AM 10/26 COCORAHS QUEENS 2.1 NE 1.03 IN 0610 AM 10/26 COCORAHS ...RICHMOND COUNTY... STATEN ISLAND 3.48 IN 0816 AM 10/26 CWOP COLLEGE OF STATEN ISLAND 3.15 IN 0830 AM 10/26 NYSM WESTERLEIGH 3.02 IN 0700 AM 10/26 COCORAHS STATEN ISLAND (WILLOWBROOK) 2.56 IN 0700 AM 10/26 COCORAHS ...ROCKLAND COUNTY... SPRING VALLEY 3.24 IN 0814 AM 10/26 CWOP SUFFERN 3.24 IN 0830 AM 10/26 NYSM NANUET 2.72 IN 0830 AM 10/26 AWS 0.9 N MONTEBELLO 2.68 IN 0800 AM 10/26 HADS NANUET 2.55 IN 0730 AM 10/26 IFLOWS POMONA 2.47 IN 0830 AM 10/26 AWS BARDONIA 2.33 IN 0830 AM 10/26 AWS MONTEBELLO 2.29 IN 0819 AM 10/26 CWOP 1 NW STONY POINT 2.25 IN 0700 AM 10/26 TRAINED SPOTTER STONY POINT 2.25 IN 0700 AM 10/26 COCORAHS BLAUVELT 2.19 IN 0815 AM 10/26 CWOP POMONA 2.15 IN 0830 AM 10/26 AWS ...SUFFOLK COUNTY... RIDGE 2.67 IN 0819 AM 10/26 CWOP SOUTHOLD 2.49 IN 0830 AM 10/26 NYSM MATTITUCK 2.32 IN 0800 AM 10/26 COCORAHS STONY BROOK 2.28 IN 0830 AM 10/26 NYSM REMSENBURG 2.22 IN 0816 AM 10/26 CWOP STONY BROOK 1.99 IN 0816 AM 10/26 CWOP SMITHTOWN 2.0 SSW 1.92 IN 0800 AM 10/26 COCORAHS WEST ISLIP 1.90 IN 0814 AM 10/26 CWOP MILLER PLACE 1.87 IN 0815 AM 10/26 CWOP NORTH PATCHOGUE 1.86 IN 0815 AM 10/26 CWOP SHIRLEY 1.86 IN 0815 AM 10/26 CWOP BLUE POINT 1.86 IN 0815 AM 10/26 CWOP ISLIP AIRPORT 1.86 IN 0825 AM 10/26 ASOS EAST SETAUKET 1.85 IN 0817 AM 10/26 CWOP SELDEN 1.83 IN 0815 AM 10/26 CWOP SAINT JAMES 1.81 IN 0814 AM 10/26 CWOP MILLER PLACE 1.81 IN 0815 AM 10/26 CWOP FARMINGVILLE 1.79 IN 0817 AM 10/26 CWOP SMITHTOWN 1.77 IN 0815 AM 10/26 CWOP KINGS PARK 1.77 IN 0815 AM 10/26 CWOP SHIRLEY AIRPORT 1.77 IN 0828 AM 10/26 ASOS SAYVILLE 1.76 IN 0819 AM 10/26 CWOP UPTON 1.73 IN 0700 AM 10/26 COOP GREENLAWN 1.72 IN 0814 AM 10/26 CWOP BAITING HOLLOW 1.72 IN 0820 AM 10/26 CWOP BLUE POINT 1.67 IN 0815 AM 10/26 CWOP PORT JEFFERSON STATION 1.66 IN 0750 AM 10/26 COCORAHS BLUE POINT 0.4 E 1.66 IN 0800 AM 10/26 COCORAHS PATCHOGUE 1.65 IN 0816 AM 10/26 CWOP NORTHPORT 1.6 NNE 1.54 IN 0800 AM 10/26 COCORAHS PATCHOGUE 1.51 IN 0700 AM 10/26 COCORAHS HUNTINGTON 1.51 IN 0815 AM 10/26 CWOP ORIENT POINT 1.50 IN 0800 AM 10/26 COOP SAGTIKOS PARKWAY 1.50 IN 0830 AM 10/26 AWS MATTITUCK 1.49 IN 0819 AM 10/26 CWOP CENTERPORT 1.48 IN 0700 AM 10/26 COOP FORT SALONGA 1.46 IN 0815 AM 10/26 CWOP SAYVILLE 1.45 IN 0700 AM 10/26 COCORAHS PATCHOGUE 0.9 SE 1.43 IN 0712 AM 10/26 COCORAHS ORIENT 1.43 IN 0817 AM 10/26 CWOP SAYVILLE 1.40 IN 0700 AM 10/26 COCORAHS WEST BABYLON 1.40 IN 0817 AM 10/26 CWOP SETAUKET-EAST SETAUKET 0.7 S 1.35 IN 0645 AM 10/26 COCORAHS ORIENT 1.32 IN 0815 AM 10/26 CWOP BAY SHORE 1.30 IN 0700 AM 10/26 COCORAHS WESTHAMPTON AIRPORT 1.23 IN 0800 AM 10/26 ASOS AMITYVILLE 1.21 IN 0750 AM 10/26 COCORAHS EASTPORT 1.21 IN 0759 AM 10/26 CWOP N. BABYLON 1.19 IN 0820 AM 10/26 CWOP 1 NNE WATERMILL 1.13 IN 0830 AM 10/26 AWS BRIGHTWATERS 1.10 IN 0700 AM 10/26 COCORAHS FARMINGDALE AIRPORT 1.06 IN 0753 AM 10/26 ASOS EASTPORT 1.05 IN 0745 AM 10/26 RAWS BROOKHAVEN 1.03 IN 0815 AM 10/26 CWOP BAYPORT 1.0 SSE 1.02 IN 0700 AM 10/26 COCORAHS WEST GILGO BEACH 1.01 IN 0815 AM 10/26 CWOP NORTH BABYLON 1.00 IN 0812 AM 10/26 CWOP ...WESTCHESTER COUNTY... OSSINING 2.68 IN 0816 AM 10/26 CWOP THORNWOOD 2.64 IN 0827 AM 10/26 COCORAHS NEW ROCHELLE 2.61 IN 0825 AM 10/26 AWS TARRYTOWN 2.55 IN 0817 AM 10/26 CWOP MIDLAND PARK 2.48 IN 0745 AM 10/26 IFLOWS SOMERS 2.42 IN 0830 AM 10/26 NYSM KATONAH 2.37 IN 0732 AM 10/26 COCORAHS PEEKSKILL 0.4 N 2.26 IN 0800 AM 10/26 COCORAHS ARMONK 2.25 IN 0818 AM 10/26 CWOP PLEASANTVILLE 2.25 IN 0830 AM 10/26 AWS EASTCHESTER 2.22 IN 0830 AM 10/26 AWS NORTH TARRYTOWN 2.13 IN 0829 AM 10/26 AWS ARMONK 2.09 IN 0815 AM 10/26 CWOP BRIARCLIFF MANOR 2.00 IN 0700 AM 10/26 COCORAHS ELMSFORD 1.84 IN 0830 AM 10/26 AWS YORKTOWN HEIGHTS 1.82 IN 0825 AM 10/26 AWS CHAPPAQUA 1.74 IN 0815 AM 10/26 CWOP WHITE PLAINS AIRPORT 1.63 IN 0756 AM 10/26 ASOS PEEKSKILL 1.37 IN 0818 AM 10/26 CWOP ELMSFORD 1.34 IN 0829 AM 10/26 AWS SHRUB OAK 1.30 IN 0630 AM 10/26 COCORAHS RYE 1.20 IN 0830 AM 10/26 AWS RYE BROOK 1.15 IN 0830 AM 10/26 AWS CROSS RIVER 1.03 IN 0830 AM 10/26 AWS 3 ESE GOLDENS BRIDGE 1.01 IN 0830 AM 10/26 AWS && -
It’s listed as an unnamed hurricane in the records.
- 306 replies
-
- 3
-
-
- heavy rain
- damaging wind
- (and 1 more)
-
OBS and nowcast 9PM tonight-8A Wednesday for a general 2-5" rain, isolated 8" possible. 40-60 kt damaging wind likely Tuesday-early Wednesday. Focus for damaging wind and heaviest rain is the I95 corridor to the coasts. Power outages esp CT LI.
donsutherland1 replied to wdrag's topic in New York City Metro
July-September 1971 and 2021 hold the NYC record for 3 consecutive months with 7” or more precipitation.- 228 replies
-
- 1
-
-
- heavy rain
- flash flooding
- (and 2 more)
-
OBS and nowcast 9PM tonight-8A Wednesday for a general 2-5" rain, isolated 8" possible. 40-60 kt damaging wind likely Tuesday-early Wednesday. Focus for damaging wind and heaviest rain is the I95 corridor to the coasts. Power outages esp CT LI.
donsutherland1 replied to wdrag's topic in New York City Metro
Through 8:15 am, Newark has received a storm total 3.52” of rain.- 228 replies
-
- 1
-
-
- heavy rain
- flash flooding
- (and 2 more)
-
Caribou was not in the tropical air mass at the time. Under clear skies and light winds, the temperature managed to hit freezing.
-
Morning thoughts… Through 6 am, New York City had received 1.50” rain from the ongoing nor’easter. That brought 2021’s total precipitation to 54.04”, which ranks 2021 as the 21st wettest year on record. Today will mostly cloudy, rainy, and increasingly windy as a powerful storm pounds the region. High temperatures will likely reach the lower and middle 60s in most of the region. Likely high temperatures around the region include: New York City (Central Park): 62° Newark: 65° Philadelphia: 64° Normals: New York City: 30-Year: 60.9°; 15-Year: 61.2° Newark: 30-Year: 62.3°; 15-Year: 63.0° Philadelphia: 30-Year: 63.4°; 15-Year: 63.6° Rain will end overnight or early tomorrow. Another significant rainfall is likely later in the week.
-
Ahead of a major storm that will bring a widespread 2"-4" rainfall with local amounts of 6" to the region, temperatures rose into the 70s across much of the region. Several locations reached or exceeded daily record high temperatures including: Baltimore: 80° (old record: 77°, 1975 and 1931) Philadelphia: 78° (old record: 76°, 1993, 2001, and 2010) Sterling, VA: 80° (old record: 77°, 1963) Washington, DC: 80° (tied record set in 1902) Newark reached 70° for the 175th time this year. The old record was 173 days, which was set in 2010. Four of the five years that saw 170 or more such days have occurred since 2000 and three have occurred since 2010. Through 4 pm today, New York City has picked up 52.54" of rain. As a result, 2021 currently ranks as New York City's 31st wettest year on record. By the end of this week, following a second storm, 2021 will very likely rank among New York City's 20 wettest years on record. No sharp cold shots appear likely through the remainder of October. The following locations are on course to challenge or establish new record high lowest monthly temperatures for October (through October 25 4 pm): Bridgeport: 43° (record: 41°, 2004) Buffalo: 42° (record: 39°, 1971) Islip: 42° (record: 40°, 1971 and 2017) New York City-JFK: 47° (record: 46°, 1971) New York City-LGA: 51° (record: 47°, 1971) New York City-NYC: 47° (record: 45°, 1946 and 1971) Newark: 45° (record: 45°, 1971) Philadelphia: 46° (record: 45°, 1882, 1927 and 1931) Poughkeepsie: 36° (record: 35°, 1971, 1995 and 1996) White Plains: 41° (record: 40°, 1971) In northern Maine, Caribou experienced its first freeze of the season earlier today. The prior record latest first freeze occurred on October 17, 1970. The normal first freeze (1991-2020) occurs on September 25th, which was an increase of 2 days over the prior 1981-2010 base period. The MJO had completed its passage through Phase 5 at a very high amplitude during the first half of October. During the 1991-2020 period, there were 6 cases with passage through Phase 5 with at least three days at an amplitude of 1.500 or above: 1998, 2000, 2004, 2010, 2017, and 2020. There was a strong signal for the second half of October to wind up warmer than normal (83%) cases in the New York City area. However, that signal broke down to a 50-50 split for the first 10 days of November. That hints at possible timing for a pattern transition depending on the pattern evolution and changes in the teleconnections. However, there is a chance that one could warmth return after a cooler than normal to near normal first week of November. The October 22-24 period saw a rare case where the AO was +0.75 or above while the NAO was -0.75 or below. There have been only 9 prior days during the second half of October (1950-2020), comprising just 0.8% of the period. Those days occurred during 1961, 1970, 1973, 1975, 2006, and 2008. In five of those six years, the first half of November saw warm anomalies in the Northeast. More than likely, the first half of November will wind up cooler than normal despite the above statistical data. Fall 2021 will likely be wetter to much wetter than normal in the northern Middle Atlantic region. Since 1869, there have been 9 August cases where New York City picked up 20.00" or more rainfall during the summer. Two thirds of those cases (and 4/5 of those with summer mean temperatures of 73.0° or above) had 17.00" or more fall precipitation in New York City. 2011 is probably the closest match in terms of precipitation and a nearly identical summer mean temperature. Mean fall precipitation for those 9 cases was 14.86". The median was 17.35". The 1991-2020 normal value is 12.27". Following very wet July-September periods, winter (December-February) precipitation has typically been near or below normal. The most recent exception was winter 2018-19. The ENSO Region 1+2 anomaly was -0.7°C and the Region 3.4 anomaly was -0.8°C for the week centered around October 20. For the past six weeks, the ENSO Region 1+2 anomaly has averaged +0.05°C and the ENSO Region 3.4 anomaly has averaged -0.52°C. La Niña conditions will likely persist through at least mid-winter. The SOI was -6.38 today. The preliminary Arctic Oscillation (AO) figure was +0.899 today. On October 23 the MJO was in Phase 2 at an amplitude of 0.783 (RMM). The October 22-adjusted amplitude was 0.602 (RMM). Based on sensitivity analysis applied to the latest guidance, there is an implied near 100% probability that New York City will have a warmer than normal October (1991-2020 normal). October will likely finish with a mean temperature near 61.9° (4.0° above normal).
-
I’ve heard unofficial estimates of 4-5 feet, but haven’t seen concrete numbers.
-
Morning thoughts… Caribou finally saw the temperature fall to 32° this morning. That is the latest first freeze on record. The prior record was October 17, 1970. Yesterday, Sacramento picked up an all-time daily record rainfall of 5.41” and San Francisco picked up an autumn record and 3rd highest daily rainfall of 4.02”. Today will mostly cloudy and very warm. High temperatures will likely reach the lower and middle 70s in most of the region. Likely high temperatures around the region include: New York City (Central Park): 71° Newark: 75° Philadelphia: 76° Normals: New York City: 30-Year: 61.2°; 15-Year: 61.6° Newark: 30-Year: 62.7°; 15-Year: 63.4° Philadelphia: 30-Year: 63.8°; 15-Year: 64.0° A storm will bring a widespread 2”-4” rainfall with locally higher amounts tomorrow into Wednesday.
-
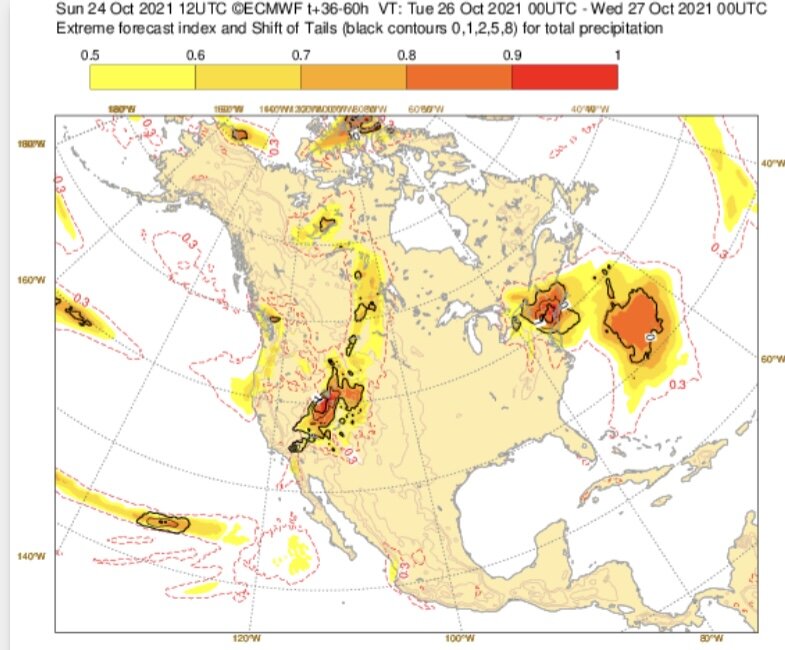
The EPS is increasingly suggesting the potential for a high-end rainfall in and around the NYC Metro Area:
- 306 replies
-
- 4
-
-
- heavy rain
- damaging wind
- (and 1 more)
-
A warm front is pushing across the region. As a result, tomorrow will see brief surge of unseasonable warmth ahead of what will become a stormy pattern. Readings will likely reach the lower and middle 70s in many parts of the region. The warmest spots could see temperatures rise into the upper 70s. Tuesday and again later in the week, storms could bring a significant rainfall to parts of the region. The first storm could bring a general 1.50"-3.50" of rain to much of the region on Tuesday into Wednesday with locally higher amounts. With 52.48" of rain through October 24th, 2021 ranks as New York City's 31st wettest year on record. By the end of this week, 2021 will likely rank as among New York City's 20 wettest years on record. No sharp cold shots appear likely through the remainder of October. Out West, a powerful storm is bringing high winds and heavy rains to northern California into parts of Nevada. As of 5 pm, rainfall totals include: Redding, CA: 2.91" (old record: 2.29", 2010) Reno: 0.90" (old record: 0.86", 1951) Sacramento: 2.42" (old record: 1.08", 2010) The following locations are on course to challenge or establish new record high lowest monthly temperatures for October (through October 24 4 pm): Bridgeport: 43° (record: 41°, 2004) Buffalo: 42° (record: 39°, 1971) Islip: 42° (record: 40°, 1971 and 2017) New York City-JFK: 47° (record: 46°, 1971) New York City-LGA: 51° (record: 47°, 1971) New York City-NYC: 47° (record: 45°, 1946 and 1971) Newark: 46° (record: 45°, 1971) Philadelphia: 46° (record: 45°, 1882, 1927 and 1931) Poughkeepsie: 36° (record: 35°, 1971, 1995 and 1996) White Plains: 41° (record: 40°, 1971) In northern Maine, Caribou has yet to experience its first freeze of autumn. The prior record latest first freeze occurred on October 17, 1970. The normal first freeze (1991-2020) occurs on September 25th, which was an increase of 2 days over the prior 1981-2010 base period. The MJO had completed its passage through Phase 5 at a very high amplitude during the first half of October. During the 1991-2020 period, there were 6 cases with passage through Phase 5 with at least three days at an amplitude of 1.500 or above: 1998, 2000, 2004, 2010, 2017, and 2020. There was a strong signal for the second half of October to wind up warmer than normal (83%) cases in the New York City area. However, that signal broke down to a 50-50 split for the first 10 days of November. That hints at possible timing for a pattern transition depending on the pattern evolution and changes in the teleconnections. However, there is a chance that one could warmth return after a cooler than normal to near normal first week of November. The October 22-24 period saw a rare case where the AO was +0.75 or above while the NAO was -0.75 or below. There have been only 9 prior days during the second half of October (1950-2020), comprising just 0.8% of the period. Those days occurred during 1961, 1970, 1973, 1975, 2006, and 2008. In five of those six years, the first half of November saw warm anomalies in the Northeast. Fall 2021 will likely be wetter to much wetter than normal in the northern Middle Atlantic region. Since 1869, there have been 9 August cases where New York City picked up 20.00" or more rainfall during the summer. Two thirds of those cases (and 4/5 of those with summer mean temperatures of 73.0° or above) had 17.00" or more fall precipitation in New York City. 2011 is probably the closest match in terms of precipitation and a nearly identical summer mean temperature. Mean fall precipitation for those 9 cases was 14.86". The median was 17.35". The 1991-2020 normal value is 12.27". Following very wet July-September periods, winter (December-February) precipitation has typically been near or below normal. The most recent exception was winter 2018-19. The ENSO Region 1+2 anomaly was -0.2°C and the Region 3.4 anomaly was -0.8°C for the week centered around October 13. For the past six weeks, the ENSO Region 1+2 anomaly has averaged +0.15°C and the ENSO Region 3.4 anomaly has averaged -0.43°C. La Niña conditions will likely persist through at least mid-winter. The SOI was -21.08 today. The preliminary Arctic Oscillation (AO) figure was +0.938 today. On October 22 the MJO was in Phase 2 at an amplitude of 0.605 (RMM). The October 21-adjusted amplitude was 0.427 (RMM). Based on sensitivity analysis applied to the latest guidance, there is an implied near 100% probability that New York City will have a warmer than normal October (1991-2020 normal). October will likely finish with a mean temperature near 62.0° (4.1° above normal).
-
Caribou’s lowest temperature so far this fall is 33, which occurred on October 5.
-
Morning thoughts… After the coolest morning so far this season in many parts of the region, it will mostly partly cloudy with near seasonable temperatures. High temperatures will likely reach the upper 50s and lower 60s in most of the region. Likely high temperatures around the region include: New York City (Central Park): 59° Newark: 63° Philadelphia: 62° Normals: New York City: 30-Year: 61.6°; 15-Year: 62.0° Newark: 30-Year: 63.0°; 15-Year: 63.8° Philadelphia: 30-Year: 64.2°; 15-Year: 64.5° Tomorrow will be much warmer ahead of a significant rainfall. Out West, a bomb cyclone and atmospheric river will result in record rainfall at Sacramento and parts of northern California. Select daily rainfall records: Downtown Sacramento: October 24 record: 1.21”, 2010 October daily record: 3.63”, October 13, 1962 All-time daily record: 5.28”, April 20, 1880 Sacramento: October 24 record: 1.08”, 2010 October daily record: 3.77”, October 13, 1962 All-time daily record: 3.77”, October 13, 1962
-
Under mostly cloudy skies with some late-day sunshine, the temperature rose only into the upper 50s and lower 60s. Tomorrow will feature more sunshine, and it will be a bit milder. Monday will see brief surge of warmth ahead of what will become a stormy pattern. Tuesday and again later in the week, storms could bring a significant rainfall to parts of the region. The first storm could bring a general 1"-3" of rain to much of the region on Tuesday into Wednesday. No sharp cold shots appear likely through the remainder of October. The following locations are on course to challenge or establish new record high lowest monthly temperatures for October (through October 21): Allentown: 40° (record: 38°, 1971) Boston: 46° (record: 45°, 1971) Bridgeport: 43° (record: 41°, 2004) Islip: 42° (record: 40°, 1971 and 2017) New York City-JFK: 48° (record: 46°, 1971) New York City-LGA: 51° (record: 47°, 1971) New York City-NYC: 47° (record: 45°, 1946 and 1971) Newark: 46° (record: 45°, 1971) Philadelphia: 46° (record: 45°, 1882, 1927 and 1931) Poughkeepsie: 38° (record: 35°, 1971, 1995 and 1996) White Plains: 44° (record: 40°, 1971) In northern Maine, Caribou has yet to experience its first freeze of autumn. The prior record latest first freeze occurred on October 17, 1970. The normal first freeze (1991-2020) occurs on September 25th, which was an increase of 2 days over the prior 1981-2010 base period. The MJO had completed its passage through Phase 5 at a very high amplitude during the first half of October. During the 1991-2020 period, there were 6 cases with passage through Phase 5 with at least three days at an amplitude of 1.500 or above: 1998, 2000, 2004, 2010, 2017, and 2020. There was a strong signal for the second half of October to wind up warmer than normal (83%) cases in the New York City area. However, that signal broke down to a 50-50 split for the first 10 days of November. That hints at possible timing for a pattern transition depending on the pattern evolution and changes in the teleconnections. Fall 2021 will likely be wetter to much wetter than normal in the northern Middle Atlantic region. Since 1869, there have been 9 August cases where New York City picked up 20.00" or more rainfall during the summer. Two thirds of those cases (and 4/5 of those with summer mean temperatures of 73.0° or above) had 17.00" or more fall precipitation in New York City. 2011 is probably the closest match in terms of precipitation and a nearly identical summer mean temperature. Mean fall precipitation for those 9 cases was 14.86". The median was 17.35". The 1991-2020 normal value is 12.27". Following very wet July-September periods, winter (December-February) precipitation has typically been near or below normal. The most recent exception was winter 2018-19. The ENSO Region 1+2 anomaly was -0.2°C and the Region 3.4 anomaly was -0.8°C for the week centered around October 13. For the past six weeks, the ENSO Region 1+2 anomaly has averaged +0.15°C and the ENSO Region 3.4 anomaly has averaged -0.43°C. La Niña conditions will likely persist through at least mid-winter. The SOI was -22.18 today. The preliminary Arctic Oscillation (AO) figure was +1.087 today. On October 21 the MJO was in Phase 2 at an amplitude of 0.433 (RMM). The October 20-adjusted amplitude was 0.498 (RMM). Based on sensitivity analysis applied to the latest guidance, there is an implied near 100% probability that New York City will have a warmer than normal October (1991-2020 normal). October will likely finish with a mean temperature near 62.0° (4.1° above normal).
-
As the sun broke through the clouds, the mercury pushed toward 60 degrees. There are now growing hints of the seasonal progression despite the unseasonable warmth that has defined much of autumn so far.

-
If Caribou makes it through tonight and tomorrow night without a freeze (models show 33-35), it could see its first freeze in November. Record late first freezes: Mount Pocono: November 1, 1920 Scranton: November 15, 1946
-
Seeing the 10” at Portland is a good reminder that some of Portland’s biggest rainstorms have occurred in October, including the October 20-22, 1996 storm that dumped 14.67” of rain in three days, including 11.74” on October 21st.
- 306 replies
-
- 3
-
-
- heavy rain
- damaging wind
- (and 1 more)
-
Morning thoughts… It will mostly cloudy and noticeably cooler. High temperatures will likely reach the upper 50s and lower 60s in most of the region. Likely high temperatures around the region include: New York City (Central Park): 58° Newark: 63° Philadelphia: 63° Normals: New York City: 30-Year: 61.9°; 15-Year: 62.4° Newark: 30-Year: 63.4°; 15-Year: 64.2° Philadelphia: 30-Year: 64.5°; 15-Year: 64.9° Tomorrow will be another cool day.
-
Cooler air is now spreading across the region. Earlier, temperatures topped out in the upper 60s and lower 70s. Newark reached 70° for the 174th time this year. That broke the record set in 2010. Four of the five years that saw 170 or more such days have occurred since 2000 and three have occurred since 2010. A seasonably cool weekend lies ahead. Early next week and again later in the week, storms could bring a moderate to significant rainfall to parts of the region. No sharp cold shots appear likely through the remainder of October. The following locations are on course to challenge or establish new record high lowest monthly temperatures for October (through October 21): Allentown: 40° (record: 38°, 1971) Boston: 46° (record: 45°, 1971) Bridgeport: 43° (record: 41°, 2004) Islip: 42° (record: 40°, 1971 and 2017) New York City-JFK: 48° (record: 46°, 1971) New York City-LGA: 51° (record: 47°, 1971) New York City-NYC: 47° (record: 45°, 1946 and 1971) Newark: 46° (record: 45°, 1971) Philadelphia: 46° (record: 45°, 1882, 1927 and 1931) Poughkeepsie: 38° (record: 35°, 1971, 1995 and 1996) White Plains: 44° (record: 40°, 1971) In northern Maine, Caribou has yet to experience its first freeze of autumn. The prior record latest first freeze occurred on October 17, 1970. The normal first freeze (1991-2020) occurs on September 25th, which was an increase of 2 days over the prior 1981-2010 base period. The MJO had completed its passage through Phase 5 at a very high amplitude during the first half of October. During the 1991-2020 period, there were 6 cases with passage through Phase 5 with at least three days at an amplitude of 1.500 or above: 1998, 2000, 2004, 2010, 2017, and 2020. There was a strong signal for the second half of October to wind up warmer than normal (83%) cases in the New York City area. However, that signal broke down to a 50-50 split for the first 10 days of November. That hints at possible timing for a pattern transition depending on the pattern evolution and changes in the teleconnections. Fall 2021 will likely be wetter to much wetter than normal in the northern Middle Atlantic region. Since 1869, there have been 9 August cases where New York City picked up 20.00" or more rainfall during the summer. Two thirds of those cases (and 4/5 of those with summer mean temperatures of 73.0° or above) had 17.00" or more fall precipitation in New York City. 2011 is probably the closest match in terms of precipitation and a nearly identical summer mean temperature. Mean fall precipitation for those 9 cases was 14.86". The median was 17.35". The 1991-2020 normal value is 12.27". Following very wet July-September periods, winter (December-February) precipitation has typically been near or below normal. The most recent exception was winter 2018-19. The ENSO Region 1+2 anomaly was -0.2°C and the Region 3.4 anomaly was -0.8°C for the week centered around October 13. For the past six weeks, the ENSO Region 1+2 anomaly has averaged +0.15°C and the ENSO Region 3.4 anomaly has averaged -0.43°C. La Niña conditions will likely persist through at least mid-winter. The SOI was +6.25 today. The preliminary Arctic Oscillation (AO) figure was +0.953 today. On October 20 the MJO was in Phase 1 at an amplitude of 0.504 (RMM). The October 19-adjusted amplitude was 0.337 (RMM). Based on sensitivity analysis applied to the latest guidance, there is an implied near 100% probability that New York City will have a warmer than normal October (1991-2020 normal). October will likely finish with a mean temperature near 62.0° (4.1° above normal).
-
Morning thoughts… It will partly sunny and still warm. High temperatures will likely reach the upper 60s and 70s in most of the region. Likely high temperatures around the region include: New York City (Central Park): 68° Newark: 72° Philadelphia: 68° Normals: New York City: 30-Year: 62.3°; 15-Year: 62.8° Newark: 30-Year: 63.7°; 15-Year: 64.6° Philadelphia: 30-Year: 64.9°; 15-Year: 65.3° A cooler weekend lies ahead.
-
That’s been a persistent theme. It may have something to do with the exceptionally warm SSTs off the northeastern U.S. and eastern Canada.
-
Brilliant sunshine provided for another unseasonably warm October day. Temperatures soared well into the 70s across the region. Newark reached 70° for the 173rd time this year. That tied the record set in 2010. Four of the five years that saw 170 or more such days have occurred since 2000 and three have occurred since 2010. Tomorrow will be a bit cooler but still unseasonably warm. A more seasonably cool weekend lies ahead. Early next week and again later in the week, storms could bring a moderate to significant rainfall to parts of the region. No sharp cold shots appear likely through the remainder of October. The following locations are on course to challenge or establish new record high lowest monthly temperatures for October (through October 20): Allentown: 40° (record: 38°, 1971) Boston: 46° (record: 45°, 1971) Bridgeport: 43° (record: 41°, 2004) Islip: 42° (record: 40°, 1971 and 2017) New York City-JFK: 48° (record: 46°, 1971) New York City-LGA: 51° (record: 47°, 1971) New York City-NYC: 47° (record: 45°, 1971) Newark: 46° (record: 45°, 1971) Philadelphia: 46° (record: 45°, 1882, 1927 and 1931) Poughkeepsie: 38° (record: 35°, 1971, 1995 and 1996) White Plains: 44° (record: 40°, 1971) In northern Maine, Caribou has yet to experience its first freeze of autumn. The prior record latest first freeze occurred on October 17, 1970. The normal first freeze (1991-2020) occurs on September 25th, which was an increase of 2 days over the prior 1981-2010 base period. The MJO has now completed its passage through Phase 5 at a very high amplitude. During the 1991-2020 period, there were 6 cases with passage through Phase 5 with at least three days at an amplitude of 1.500 or above: 1998, 2000, 2004, 2010, 2017, and 2020. There was a strong signal for the second half of October to wind up warmer than normal (83%) cases in the New York City area. However, that signal broke down to a 50-50 split for the first 10 days of November. That hints at possible timing for a pattern transition depending on the pattern evolution and changes in the teleconnections. Fall 2021 will likely be wetter to much wetter than normal in the northern Middle Atlantic region. Since 1869, there have been 9 August cases where New York City picked up 20.00" or more rainfall during the summer. Two thirds of those cases (and 4/5 of those with summer mean temperatures of 73.0° or above) had 17.00" or more fall precipitation in New York City. 2011 is probably the closest match in terms of precipitation and a nearly identical summer mean temperature. Mean fall precipitation for those 9 cases was 14.86". The median was 17.35". The 1991-2020 normal value is 12.27". Following very wet July-September periods, winter (December-February) precipitation has typically been near or below normal. The most recent exception was winter 2018-19. The ENSO Region 1+2 anomaly was -0.2°C and the Region 3.4 anomaly was -0.8°C for the week centered around October 13. For the past six weeks, the ENSO Region 1+2 anomaly has averaged +0.15°C and the ENSO Region 3.4 anomaly has averaged -0.43°C. La Niña conditions will likely persist through at least mid-winter. The SOI was +12.18 today. The preliminary Arctic Oscillation (AO) figure was +0.619 today. On October 19 the MJO was in Phase 2 at an amplitude of 0.334 (RMM). The October 18-adjusted amplitude was 0.312 (RMM). Based on sensitivity analysis applied to the latest guidance, there is an implied 99% probability that New York City will have a warmer than normal October (1991-2020 normal). October will likely finish with a mean temperature near 61.8° (3.9° above normal).