

donsutherland1
-
Posts
24,169 -
Joined
Content Type
Profiles
Blogs
Forums
American Weather
Media Demo
Store
Gallery
Everything posted by donsutherland1
-
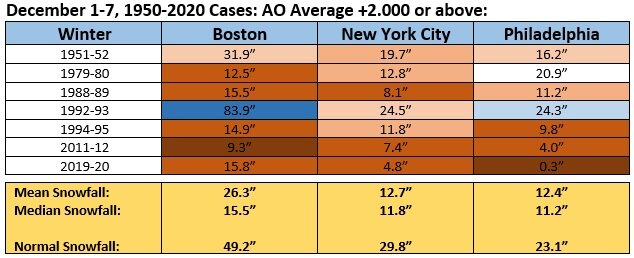
Milder air will begin to overspread the region tomorrow. Afterward, temperatures could soar to near record and record levels on Saturday in the Middle Atlantic region in advance of another cold front. Already, the air mass that will send temperatures reaching for records on Saturday resulted in numerous records falling in parts of Texas and Kansas. Records included: Brownsville: 88° (tied record set in 1919) Galveston: 80° (old record: 78°, 2004, 2007, and 2019) Houston: 85° (old record: 84°, 2009) ***tied December record*** Wichita: 69° (old record: 67°, 1896, 1946, and 2020) Passage of the front could be marked by strong winds and strong to perhaps severe thunderstorms. The front will bring a transient shot of somewhat cooler air to the region. A significant warmup is possible beginning after the middle of next week. No Arctic blasts appear likely for the foreseeable future. Overall, through December 20th, temperatures will likely be warmer than normal in the means with some short-lived cool shots. Out West, Denver has yet to see its first measurable snowfall through December 8. The previous record latest first measurable snowfall occurred on November 21, 1934. The progression of Denver's latest first measurable snowfall of the season is as follows: November 11, 1882 November 16, 1894 November 19, 1931 November 21, 1934 The base case is that the closing 10 days of December could turn cooler, though not necessarily cold. Since 1950, there have been 7 cases where the AO averaged +2.000 or above during the first week in December, as has been the case this year. The mean December 21-31 temperature in New York City was 40.2°. The median temperature was 41.5°. The coldest was 35.3° (1951) and the warmest was 44.0° (1979). In short, this historic experience would suggest that there will be no severe Arctic outbreaks in the East this month. It also suggests that New York City will likely have an average temperature of 40° or above this month. Following very wet July-September periods, winter (December-February) precipitation has typically been near or below normal. The most recent exception was winter 2018-19. The ENSO Region 1+2 anomaly was -1.1°C and the Region 3.4 anomaly was -0.9°C for the week centered around December 1. For the past six weeks, the ENSO Region 1+2 anomaly has averaged -0.87°C and the ENSO Region 3.4 anomaly has averaged -0.92°C. La Niña conditions will likely persist into at least late winter. The SOI was +6.38 today. The preliminary Arctic Oscillation (AO) figure was +2.037 today On December 7 the MJO was in Phase 6 at an amplitude of 2.008 (RMM). The December 6-adjusted amplitude was 1.990 (RMM). Based on sensitivity analysis applied to the latest guidance, there is an implied 84% probability that New York City will have a warmer than normal December (1991-2020 normal). December will likely finish with a mean temperature near 42.3° (3.2° above normal).
-
And the subzero temperature on Valentines Day.
-
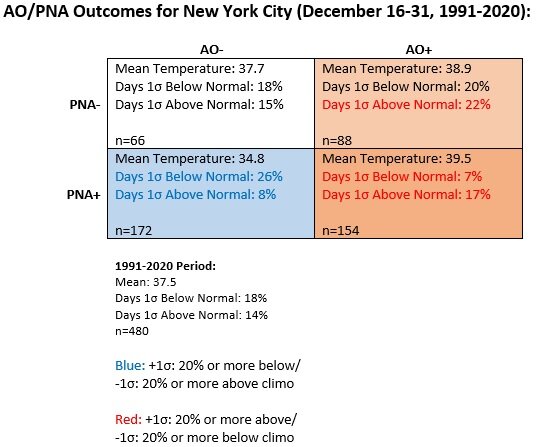
During the December 16-31, 1950-2020 period, 35 storms brought 4" or more snow to at least one of the following cities: Boston, New York City, and Philadelphia. Those storms were almost evenly distributed among AO/PNA cases. However, the larger impact storms (4" or more snow in 2 or more of those cities) occurred when the AO was negative. I constructed a simple index ranging from 1-3 (1=4" or more snow in just one of those cities; 3=4" or more snow in all three of those cities). The simple impact scores were: AO-/PNA-: Average: 1.7; 2 or more cities: 44% (n=9 storms) AO-/PNA+: Average: 2.2; 2 or more cities: 78% (n=9 storms) AO+/PNA-: Average: 1.3; 2 or more cities: 25% (n=8 storms) AO+/PNA+: Average: 1.2; 2 or more cities: 11% (n=9 storms) All cases: Average: 1.6; 2 or more cities: 40% (n=35 storms) The latest ensemble guidance suggests that the period will begin with an AO+/PNA- pattern. Such a pattern would suggest lower impact storms for the Philadelphia-Boston region should sufficiently cold air be present for such events. Finally, the biggest storms (10") or more have typically occurred when the AO was negative. When the AO was positive, Boston saw two such storms and New York City saw only one. None of those storms brought 6" or more snow to any of the other cities in the three-city subset.
-
Morning thoughts… Today will be partly cloudy and cool. High temperatures will likely reach the lower 40s in most of the region. Likely high temperatures around the region include: New York City (Central Park): 40° Newark: 43° Philadelphia: 43° Normals: New York City: 30-Year: 46.1°; 15-Year: 46.7° Newark: 30-Year: 46.6°; 15-Year: 47.3° Philadelphia: 30-Year: 47.7°; 15-Year: 48.5° Milder air will begin to return tomorrow. Near record or perhaps even record warmth is possible in parts of the region on Saturday. Daily records for December 11: Allentown: 61°, 1952 and 1979 Baltimore: 69°, 1979 New York City: 64°, 1879 Newark: 65°, 1966 and 1971 Philadelphia: 65°, 1899 and 1971 Washington, DC: 68°, 1897, 1971, and 1979
-
It should feel more like it than during some recent winters. Severe cold will likely struggle to get out of NW Canada.
-
Tomorrow will be another cool day. Milder air will begin to overspread the region on Friday. Temperatures could soar to near record and record levels on Saturday in the Middle Atlantic region. No Arctic blasts appear likely for the foreseeable future. Overall, through December 20th, temperatures will likely be warmer than normal in the means with some short-lived cool shots. Out West, Denver has yet to see its first measurable snowfall through December 7. The previous record latest first measurable snowfall occurred on November 21, 1934. The progression of Denver's latest first measurable snowfall of the season is as follows: November 11, 1882 November 16, 1894 November 19, 1931 November 21, 1934 The base case is that the closing 10 days of December could turn cooler, though not necessarily cold. Since 1950, there have been 7 cases where the AO averaged +2.000 or above during the first week in December, as has been the case this year. The mean December 21-31 temperature in New York City was 40.2°. The median temperature was 41.5°. The coldest was 35.3° (1951) and the warmest was 44.0° (1979). In short, this historic experience would suggest that there will be no severe Arctic outbreaks in the East this month. It also suggests that New York City will likely have an average temperature of 40° or above this month. Although the MJO moved into Phase 6 at a very high amplitude in recent days, the sample size of cases where the MJO moved into Phase 6 at an amplitude of 1.75 or above during December 1-15 is very small (n=5). Moreover, just a single case occurred during a predominantly EPO+/AO+ pattern and none occurred during a La Niña. Among those five cases, two had a cold or very cold December 21-31 period, one saw near normal conditions, and two had warm conditions. In short, the current high amplitude MJO does not provide a clear signal where things are headed. Following very wet July-September periods, winter (December-February) precipitation has typically been near or below normal. The most recent exception was winter 2018-19. The ENSO Region 1+2 anomaly was -1.1°C and the Region 3.4 anomaly was -0.9°C for the week centered around December 1. For the past six weeks, the ENSO Region 1+2 anomaly has averaged -0.87°C and the ENSO Region 3.4 anomaly has averaged -0.92°C. La Niña conditions will likely persist into at least late winter. The SOI was +10.43 today. The preliminary Arctic Oscillation (AO) figure was +2.262 today On December 6 the MJO was in Phase 6 at an amplitude of 1.977 (RMM). The December 5-adjusted amplitude was 1.930 (RMM). Based on sensitivity analysis applied to the latest guidance, there is an implied 83% probability that New York City will have a warmer than normal December (1991-2020 normal). December will likely finish with a mean temperature near 42.2° (3.1° above normal).
-
This will be a bigger problem in January if it persists. During the second half of December, the AO is more important with regard to the NYC area in terms of temperatures.
-
Morning thoughts… Today will be mostly cloudy and cold. Some flurries are possible in parts of the region. High temperatures will likely reach the lower 40s in most of the region. Likely high temperatures around the region include: New York City (Central Park): 42° Newark: 44° Philadelphia: 43° Normals: New York City: 30-Year: 46.4°; 15-Year: 47.0° Newark: 30-Year: 46.9°; 15-Year: 47.6° Philadelphia: 30-Year: 48.0°; 15-Year: 48.8° Following another cool day, milder air will begin to return on Friday. Near record or perhaps even record warmth is possible in parts of the region on Saturday.
-
Pre-Holiday GTG: 3pm 12/18 Clarke's @ Faneuil hall
donsutherland1 replied to 40/70 Benchmark's topic in New England
Congratulations. -
I suspect that it will begin to turn cooler during the last 10 days of the month, but not severely cold. The PNA looks to stay negative to strongly negative for the foreseeable future. My worry is that the EPO briefly goes negative but then rebounds limiting the opportunity for notable cold (maybe a two week period?) over the next 30 days.
-
Colder air has now moved into place. A system could bring a little light snow or flurries to parts of the region tomorrow. Little or no accumulation is likely. A light accumulation remains possible in eastern New England. Behind the system Thursday will be another cool day. Milder air will begin to overspread the region on Friday. Temperatures could soar to near record and record levels on Saturday. No Arctic blasts appear likely for the foreseeable future. Overall, through December 20th, temperatures will likely be warmer than normal in the means with some short-lived cool shots. Out West, Denver has yet to see its first measurable snowfall through December 6. The previous record latest first measurable snowfall occurred on November 21, 1934. The progression of Denver's latest first measurable snowfall of the season is as follows: November 11, 1882 November 16, 1894 November 19, 1931 November 21, 1934 The base case is that the closing 10 days of December could turn cooler, though not necessarily cold. Since 1950, there have been 7 cases where the AO averaged +2.000 or above during the first week in December, as has been the case this year. The mean December 21-31 temperature in New York City was 40.2°. The median temperature was 41.5°. The coldest was 35.3° (1951) and the warmest was 44.0° (1979). By December 20th, the mean temperature will likely be somewhere between 43.1° and 45.7°. In short, this historic experience would suggest that there will be no severe Arctic outbreaks in the East this month. It also suggests that New York City will likely have an average temperature of 40° or above this month. Although the MJO moved into Phase 6 at a very high amplitude in recent days, the sample size of cases where the MJO moved into Phase 6 at an amplitude of 1.75 or above during December 1-15 is very small (n=5). Moreover, just a single case occurred during a predominantly EPO+/AO+ pattern and none occurred during a La Niña. Among those five cases, two had a cold or very cold December 21-31 period, one saw near normal conditions, and two had warm conditions. In short, the current high amplitude MJO does not provide a clear signal where things are headed. Following very wet July-September periods, winter (December-February) precipitation has typically been near or below normal. The most recent exception was winter 2018-19. The ENSO Region 1+2 anomaly was -1.1°C and the Region 3.4 anomaly was -0.9°C for the week centered around December 1. For the past six weeks, the ENSO Region 1+2 anomaly has averaged -0.87°C and the ENSO Region 3.4 anomaly has averaged -0.92°C. La Niña conditions will likely persist into at least late winter. The SOI was +11.62 today. The preliminary Arctic Oscillation (AO) figure was +2.924 today On December 5 the MJO was in Phase 6 at an amplitude of 1.919 (RMM). The December 4-adjusted amplitude was 2.144 (RMM). Based on sensitivity analysis applied to the latest guidance, there is an implied 79% probability that New York City will have a warmer than normal December (1991-2020 normal). December will likely finish with a mean temperature near 42.0° (2.9° above normal).
-
Hopefully, it will hold to the EPO- idea. Unfortunately, the long-range EPS is often prone to show an EPO- that ultimately does not materialize. We'll probably know more in a few more days.
-
Probably.
-
Yes.
-
FYI, the NWS is looking into the difference. As soon as I learn more, I will post the outcome.
-
Yes, I am aware of it. However, Denver's media outlets have also gone with 232 days (which fits the daily data I noted). That's why I think the site is in error. One example: https://www.9news.com/article/weather/weather-colorado/203-days-no-snow-in-denver/73-5acd5882-1d50-4862-80fa-56b669f25343
-
That seems to be an error. The daily data shows 0.1” on March 4, 1887 and 0.3” on October 23, 1887. That is 232 days without measurable snowfall.
-
The longest stretch between measurable snowfalls is 232 days. Measurable snowfall is likely very late Thursday or on Friday.
-
The preliminary December 1-7 average for the Arctic Oscillation (AO) is +2.570. Historically, that has been an ominous indication that seasonal snowfall in the major cities of the Northeast (from Philadelphia to Boston) would come in below to much below normal.
-
Morning thoughts… Today will be partly to occasionally mostly cloudy and noticeably cooler. High temperatures will likely reach the lower and middle 40s in most of the region. Likely high temperatures around the region include: New York City (Central Park): 42° Newark: 45° Philadelphia: 45° Normals: New York City: 30-Year: 46.7°; 15-Year: 47.2° Newark: 30-Year: 47.2°; 15-Year: 47.9° Philadelphia: 30-Year: 48.4°; 15-Year: 49.1° A system will likely bring some light snow or flurries to the region tomorrow. Little or no accumulation (0.5” or less) is likely in most of the region. Eastern New England could see 1”-3”.
-
Not in 2009-10. DC got more than Denver in 1910-11.
-
That has occurred 10 times. The most recent winter was 2009-10 when Washington, DC received 56.1” of snow and Boston saw 35.7”.
-
It’s rare. Denver has never had to wait so long for its first measurable snowfall, which should finally occur later this week. There is one winter where Washington, DC saw more snowfall than Denver (1910-11).
-
Cooler air will return tonight and tomorrow. Afterward, a system could bring light snow to parts of the region on Wednesday. A coating to an inch is possible even in Newark, New York City, and Philadelphia. Some pockets of 1"-3" amounts are possible. Eastern New England will likely see 1"-3" with some locally higher amounts. No Arctic blasts appear likely for the foreseeable future. Overall, through December 20th, temperatures will likely be warmer than normal in the means with some short-lived cool shots. First measurable snowfall statistics for select cities: Allentown: Normal: December 6; 2020-21: December 9 Bridgeport: Normal: December 3; 2020-21: December 16 Islip: Normal: December 10; 2020-21: December 16 New York City: Normal: December 13; 2020-21: December 16 Newark: Normal: December 9; 2020-21: December 9; 2021-22: November 28 Philadelphia: Normal: December 19; 2020-21: December 16 Out West, Denver has yet to see its first measurable snowfall through December 5. The previous record latest first measurable snowfall occurred on November 21, 1934. The progression of Denver's latest first measurable snowfall of the season is as follows: November 11, 1882 November 16, 1894 November 19, 1931 November 21, 1934 The base case is that the closing 10 days of December could turn cooler, though not necessarily cold. Uncertainty is higher than usual. The evolution of the EPO and AO beyond mid-month will likely determine the outcome for much of the remainder of the month. Although the MJO moved into Phase 6 at a very high amplitude in recent days, the sample size of cases where the MJO moved into Phase 6 at an amplitude of 1.75 or above during December 1-15 is very small (n=5). Moreover, just a single case occurred during a predominantly EPO+/AO+ pattern and none occurred during a La Niña. Among those five cases, two had a cold or very cold December 21-31 period, one saw near normal conditions, and two had warm conditions. In short, the current high amplitude MJO does not provide a clear signal where things are headed. Following very wet July-September periods, winter (December-February) precipitation has typically been near or below normal. The most recent exception was winter 2018-19. The ENSO Region 1+2 anomaly was -1.1°C and the Region 3.4 anomaly was -0.9°C for the week centered around December 1. For the past six weeks, the ENSO Region 1+2 anomaly has averaged -0.87°C and the ENSO Region 3.4 anomaly has averaged -0.92°C. La Niña conditions will likely persist into at least late winter. The SOI was +16.66 today. The preliminary Arctic Oscillation (AO) figure was +3.061 today On December 4 the MJO was in Phase 6 at an amplitude of 2.199 (RMM). The December 3-adjusted amplitude was 2.280 (RMM).


