

donsutherland1
-
Posts
24,169 -
Joined
Content Type
Profiles
Blogs
Forums
American Weather
Media Demo
Store
Gallery
Everything posted by donsutherland1
-
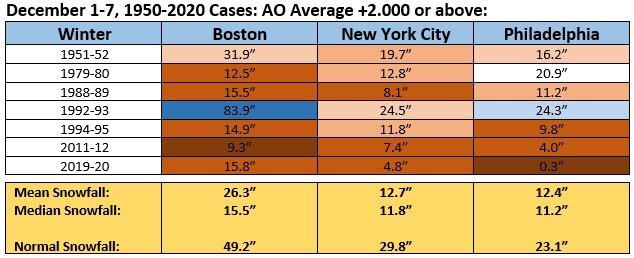
Not during the first week of December. Here’s the list:
-
Historically, winters that start with the kind of AO+ one saw during the first week of December wind up with below to much below normal snowfall.
-
It would probably be very difficult to get a January 1985 outcome given the strongly negative PDO (it was positive during winter 1984-85).
-
Today was another very mild day. Records again fell at some locations including: Burlington: 60° (old record: 56°, 2000) Grand Étang, NS: 47° (old record: 43°, 2005) Montreal: 55° (old record: 51°, 1984) ***record 222nd 50° day*** New Haven: 60° (old recorfd: 55°, 2015) New York City-JFK: 61° (old record: 59°, 1984 and 2015) New York City-LGA: 62° (old record: 61°, 2000) Saguenay, QC: 44° (old record: 40°, 2006) Worcester: 60° (tied record set in 2000) Colder air will begin to return to the region this following a frontal passage tomorrow. A few showers or periods of rain are possible tonight and tomorrow. Parts of the Hudson Valley and northwestern Connecticut could experience some snow and sleet with minor accumulations. Early next week could briefly see the coldest temperatures so far this season before some moderation again sets in. The final week of December could see temperatures shift below normal as the month comes to a close. No severe cold is likely. Afterward, if the small sample of cases where the MJO moved into Phase 7 at a high amplitude (1.75 or above) during the December 10-20 period, as occurred this month, is representative, the first 10 days of January could see below to perhaps much below normal temperatures. Both the magnitude and duration of the cold is uncertain. In the Midwest, Chicago has yet to receive its first measurable snowfall through December 16. Only two prior years saw their first measurable snowfall on December 16 or later: 1. December 20, 2012 2. December 16, 1965 The front that will produce tomorrow's precipitation could bring some measurable snow to Chicago tonight. However, there remains a chance that no accumulations will occur there. Following very wet July-September periods, winter (December-February) precipitation has typically been near or below normal. The most recent exception was winter 2018-19. The ENSO Region 1+2 anomaly was -1.4°C and the Region 3.4 anomaly was -1.1°C for the week centered around December 8. For the past six weeks, the ENSO Region 1+2 anomaly has averaged -1.00°C and the ENSO Region 3.4 anomaly has averaged -0.92°C. La Niña conditions will likely persist into at least late winter. The SOI was +11.05 today. The preliminary Arctic Oscillation (AO) figure was -0.145 today. On December 15 the MJO was in Phase 6 at an amplitude of 1.973 (RMM). The December 14-adjusted amplitude was 2.034 (RMM). Based on sensitivity analysis applied to the latest guidance, there is an implied 90% probability that New York City will have a warmer than normal December (1991-2020 normal). December will likely finish with a mean temperature near 42.2° (3.1° above normal).
-
MJO forecasts beyond day 7 are not very skillful. The SSTAs suggest caution—and the SSTAs, not Rai may be more responsible for the ongoing evolution of the MJO. A push into Phase 8 is not a foregone conclusion. The MJO could well fall into low amplitudes only to re-emerge at a higher amplitude in a warmer phase. Thus, it’s plausible that any colder pattern could fall apart after about 2 weeks (mid-January?).
-
The latest GEFS maps illustrate the need for patience. Some colder air could begin to spill into the region as December concludes, but the odds remain against a full-fledged Arctic blast. The magnitude and duration of a possible cold period in January remains uncertain. It remains possible that the severe cold in Alaska and western Canada may largely avoid the region.
-
JFK Airport has reached 60 degrees. That breaks the daily record of 59 set in 1984 and tied in 2015.
-
Morning thoughts… Today will be partly cloudy and very mild. High temperatures will likely reach the upper 50s and perhaps lower 60s in most of the region. Likely high temperatures around the region include: New York City (Central Park): 59° Newark: 60° Philadelphia: 60° Normals: New York City: 30-Year: 43.8°; 15-Year: 44.6° Newark: 30-Year: 44.3°; 15-Year: 45.2° Philadelphia: 30-Year: 45.5°; 15-Year: 46.5° The unseasonably mild weather will continue into the start of the weekend.
-
Under partly sunny skies, temperatures soared into the 50s and 60s across the region. Numerous records were shattered or tied in parts of the Northeast and southern Canada. Records included: Albany: 61° (old record: 55°, 1971) Allentown: 61° (old record: 60°, 1971) Binghamton: 60° (old record: 54°, 1971) Buffalo: 64° (tied record set in 1984) Burlington: 58° (old record: 54°, 1982) Grand Rapids, MI: 63° (old record: 61°, 1984) Green Bay: 65° (old record: 54°, 1984) ***new December record*** Harrisburg: 66° (old record: 63°, 1971) Hartford: 63° (old record: 60°, 1971) Lansing: 63° (old record: 60°, 1971) Madison: 63° (old record: 57°, 1959) Manchester, NH: 56° (old record: 54°, 2008) Milwaukee: 68° (old record: 58°, 1984) ***new December record*** Montreal: 59° (old record: 50°, 1992) Mount Pocono, PA: 60° (old record: 56°, 1906) New York City-LGA: 63° (old record: 62°, 1971) Newark: 65° (tied record set in 1971) Ottawa: 59° (old record: 45°, 1984) Pittsburgh: 64° (tied record set in 1940) Poughkeepsie: 64° (old record: 59°, 1971) Providence: 65° (old record: 62°, 1971) Rochester: 65° (old record: 62°, 1894) Rockford, IL: 68° (old record: 58°, 1984) Scranton: 65° (old record: 57°, 1971) Syracuse: 67° (old record: 55°, 1971) Toronto: 63° (old record: 60°, 1984) Watertown, NY: 63° (old record: 54°, 1971) Williamsport, PA: 60° (old record: 58°, 1971) Worcester: 58° (tied record set in 1971) Tomorrow will be another very mild day. However, colder air will begin to return to the region this weekend. Early next week could briefly see the coldest temperatures so far this season before some moderation again sets in. There is growing model consensus that the final week of December could see temperatures shift below normal as the AO goes negative. Afterward, if the small sample of cases where the MJO moved into Phase 7 at a high amplitude (1.75 or above) during the December 10-20 period, as occurred this month, is representative, the first 10 days of January could see below to perhaps much below normal temperatures. Both the magnitude and duration of the cold is uncertain. In the Midwest, Chicago has yet to receive its first measurable snowfall through December 15. Only two prior years saw their first measurable snowfall on December 15 or later: 1. December 20, 2012 2. December 16, 1965 Following very wet July-September periods, winter (December-February) precipitation has typically been near or below normal. The most recent exception was winter 2018-19. The ENSO Region 1+2 anomaly was -1.4°C and the Region 3.4 anomaly was -1.1°C for the week centered around December 8. For the past six weeks, the ENSO Region 1+2 anomaly has averaged -1.00°C and the ENSO Region 3.4 anomaly has averaged -0.92°C. La Niña conditions will likely persist into at least late winter. The SOI was +17.23 today. The preliminary Arctic Oscillation (AO) figure was +1.253 today. On December 14 the MJO was in Phase 6 at an amplitude of 2.035 (RMM). The December 13-adjusted amplitude was 2.223 (RMM). Based on sensitivity analysis applied to the latest guidance, there is an implied 86% probability that New York City will have a warmer than normal December (1991-2020 normal). December will likely finish with a mean temperature near 42.2° (3.1° above normal).
-
Through 12 pm, daily record high temperatures have fallen at among the following locations: Binghamton, Mount Pocono, Ottawa, Rochester, Scranton, Syracuse, and Toronto. Daily records have been tied at: Albany and Poughkeepsie
-
We probably won’t know the answer to that for a few more days.
-
I would be somewhat cautious, though I think January 1-10 will be colder than normal. December 21-25 is now colder on the EPS, too. The issue I raise is that Rai will likely have some impact on the pattern evolution. One cannot wholly dismiss it regardless of its skewing some of the MJO measures.
-
Morning thoughts… Early this morning, record highs were smashed in such cities as Chicago, Green Bay, Madison, Milwaukee, and Rockford. The region will be on the fringe of the exceptionally warm air mass responsible for the historic mid-December warmth. Today will be mostly cloudy and very mild. High temperatures will likely reach the upper 50s and lower 60s in most of the region. Likely high temperatures around the region include: New York City (Central Park): 61° Newark: 63° Philadelphia: 64° Normals: New York City: 30-Year: 44.1°; 15-Year: 44.8° Newark: 30-Year: 44.6°; 15-Year: 45.5° Philadelphia: 30-Year: 45.8°; 15-Year: 46.7° The unseasonably mild weather will continue into the start of the weekend.
-
Select records from today included: Boscobel, WI: 72° (old record: 52°, 2011) ***new December record*** Cedar Rapids, IA: 73° (old record: 55°, 1957) ***new December record*** Chicago: 65° (old record: 64°, 1971) Des Moines: 74° (old record: 59°, 1939 and 2002) ***new December record*** Dodge City, KS: 74° (old record: 69°, 1946) Dubuque, IA: 69° (old record: 53°, 1939) Green Bay: 54° (old record: 49°, 1998) La Crosse, WI: 67° (old record: 52°, 1923) ***tied December record*** Madison: 68° (old record: 52°, 2011) ***new December record*** Milwaukee: 67° (old record: 55°, 1891) Minneapolis-St. Paul: 54° (old record: 51°, 2014) Oklahoma City: 77° (old record: 75°, 1948) Oskaloosa, IA: 78° (old record: 60°, 2006) ***new December record*** Ottumwa, IA: 75° (old record: 59°, 2002) ***new December record*** Peoria, IL: 69° (old record: 63°, 1971) Rockford, IL: 69° (old record: 58°, 1971) Sioux City, IA: 70° (old record: 62°, 1939) Waterloo, IA: 74° (old record: 54°, 1923) ***new December record*** Wichita: 77° (old record: 66°, 1939 and 2006)
-
Historic December warmth demolished records throughout the Midwest today. At the same time, powerful winds with gusts past 100 mph in places lashed a large area running from the Rockies to the Central Plains States. Some areas experienced near zero visibility in blowing dust. At present, a line of severe thunderstorms was racing through the region. Damaging winds and tornadoes are likely into this evening. Through 5 pm EST, preliminary records included: Boscobel, WI: 71° (old record: 52°, 2011) ***new December record*** Cedar Rapids, IA: 73° (old record: 55°, 1957) ***new December record*** Chicago: 65° (old record: 64°, 1971) Des Moines: 74° (old record: 59°, 1939 and 2002) ***new December record*** Dodge City, KS: 72° (old record: 69°, 1946) Dubuque, IA: 69° (old record: 53°, 1939) Green Bay: 53° (old record: 49°, 1998) La Crosse, WI: 65° (old record: 52°, 1923) Madison: 67° (old record: 52°, 2011) ***new December record*** Milwaukee: 67° (old record: 55°, 1891) Minneapolis-St. Paul: 54° (old record: 51°, 2014) Oklahoma City: 76° (old record: 75°, 1948) Oskaloosa, IA: 77° (old record: 60°, 2006) ***new December record*** Ottumwa, IA: 75° (old record: 59°, 2002) ***new December record*** Peoria, IL: 68° (old record: 63°, 1971) Rockford, IL: 68° (old record: 58°, 1971) Sioux City, IA: 70° (old record: 62°, 1939) Waterloo, IA: 73° (old record: 54°, 1923) ***new December record*** Wichita: 76° (old record: 66°, 1939 and 2006) Some of that warmth will affect the region on tomorrow into Friday before cooler air again returns. No Arctic blasts appear likely for the foreseeable future. Overall, through December 20th, there will likely be only some relatively short-lived cool shots. Afterward, the AO could go negative, increasing the opportunity for colder outcomes. In the Midwest, Chicago has yet to receive its first measurable snowfall through December 14. Only three prior years saw their first measurable snowfall on December 14 or later: 1. December 20, 2012 2. December 16, 1965 3. December 14, 2001 There is growing model consensus that the final week of December could see temperatures shift below normal as the AO goes negative. Afterward, if the small sample of cases where the MJO moved into Phase 7 at a high amplitude (1.75 or above) during the December 10-20 period, as occurred this month, is representative, the first 10 days of January could see below to perhaps much below normal temperatures. Both the magnitude and duration of the cold is uncertain. Following very wet July-September periods, winter (December-February) precipitation has typically been near or below normal. The most recent exception was winter 2018-19. The ENSO Region 1+2 anomaly was -1.4°C and the Region 3.4 anomaly was -1.1°C for the week centered around December 8. For the past six weeks, the ENSO Region 1+2 anomaly has averaged -1.00°C and the ENSO Region 3.4 anomaly has averaged -0.92°C. La Niña conditions will likely persist into at least late winter. The SOI was not available today. The preliminary Arctic Oscillation (AO) figure was +1.253 today. On December 13 the MJO was in Phase 6 at an amplitude of 2.225 (RMM). The December 12-adjusted amplitude was 2.212 (RMM). Based on sensitivity analysis applied to the latest guidance, there is an implied 87% probability that New York City will have a warmer than normal December (1991-2020 normal). December will likely finish with a mean temperature near 42.3° (3.2° above normal).
-
Morning thoughts… Today will be partly to mostly cloudy and mild. High temperatures will likely reach the lower and middle 50s in most of the region. Likely high temperatures around the region include: New York City (Central Park): 53° Newark: 56° Philadelphia: 57° Normals: New York City: 30-Year: 44.3°; 15-Year: 45.1° Newark: 30-Year: 44.8°; 15-Year: 45.7° Philadelphia: 30-Year: 46.0°; 15-Year: 47.0° The unseasonably mild weather will continue into the start of the weekend.
-
Today was another sun-filled and mild day. Much of the region again basked in high temperatures that topped out in the 50s. Similar warmth is likely tomorrow. Elsewhere, the temperature reached at least 76° at Amarillo, TX (old record: 69°, 1929, 1962, and 1977) with near record highs being reached at Houston, St. Louis, and Wichita. Tomorrow will witness an explosion of record highs in the Midwest. Des Moines could see its first ever 70° December day. Madison could also approach or reach its monthly record. At the same time, high winds will blast a large portion of the western and central U.S. Some of that warmth will affect the region on Thursday into Friday before cooler air again returns. No Arctic blasts appear likely for the foreseeable future. Overall, through December 20th, there will likely be only some relatively short-lived cool shots. Afterward, the AO could go negative, increasing the opportunity for colder outcomes. In the Midwest, Chicago has yet to receive its first measurable snowfall through December 13. Only three prior years saw their first measurable snowfall on December 13 or later: 1. December 20, 2012 2. December 16, 1965 3. December 14, 2001 The base case is that the closing 10 days of December could turn cooler, though not necessarily cold. Since 1950, there have been 7 cases where the AO averaged +2.000 or above during the first week in December, as has been the case this year. The mean December 21-31 temperature in New York City was 40.2°. The median temperature was 41.5°. The coldest was 35.3° (1951) and the warmest was 44.0° (1979). In short, this historic experience would suggest that there will be no severe Arctic outbreaks in the East this month. It also suggests that New York City will likely have an average temperature of 40° or above this month. Afterward, if the small sample of cases where the MJO moved into Phase 7 at a high amplitude (1.75 or above) during the December 10-20 period, as occurred this month, is representative, the first 10 days of January could see below to perhaps much below normal temperatures. Both the magnitude and duration of the cold is uncertain, but the potential pattern change has support on the latest EPS weekly guidance. Following very wet July-September periods, winter (December-February) precipitation has typically been near or below normal. The most recent exception was winter 2018-19. The ENSO Region 1+2 anomaly was -1.4°C and the Region 3.4 anomaly was -1.1°C for the week centered around December 8. For the past six weeks, the ENSO Region 1+2 anomaly has averaged -1.00°C and the ENSO Region 3.4 anomaly has averaged -0.92°C. La Niña conditions will likely persist into at least late winter. The SOI was +16.40 today. The preliminary Arctic Oscillation (AO) figure was +1.127 today. On December 12 the MJO was in Phase 7 at an amplitude of 2.207 (RMM). The December 11-adjusted amplitude was 2.416 (RMM). Based on sensitivity analysis applied to the latest guidance, there is an implied 84% probability that New York City will have a warmer than normal December (1991-2020 normal). December will likely finish with a mean temperature near 42.3° (3.2° above normal).
-
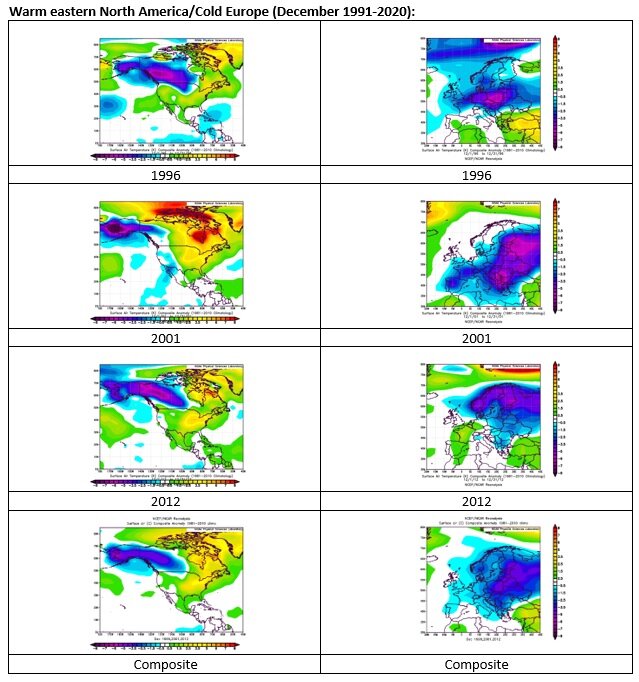
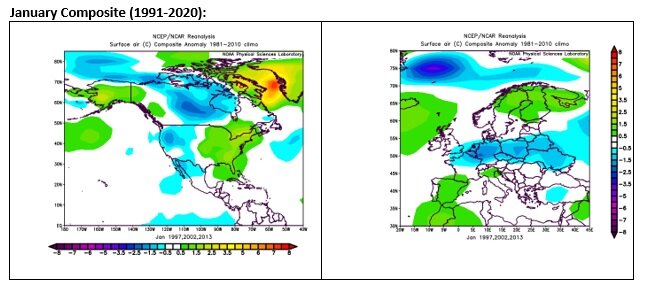
There is some Social Media discussion about the divergent GFS forecasts for North America (warm) and Europe (cold) in the extended range. Such divergence has occurred before during the 1991-2020 base period: The January outcome (composite) is below: December 1998 is arguably another such case, though warm anomalies were a bit more widespread in Europe than during the above three cases.
-
Four quick thoughts on the upcoming pattern change: 1. The MJO's push into Phase 7 (amplitude > 2) should trigger a circulation response that favors cooler than normal temperatures during the January 1-10 period overall. 2. The magnitude of the cold and its duration remains uncertain. MJO forecasts aren't very skillful beyond a week. Additional factors influence the hemispheric circulation. There remains a risk that severe cold remains largely confined to northwestern/central Canada and the U.S. Northwest/Northern Plains and, if it comes eastward, remains largely north of the U.S.-Canada border. One likely won't have a firm idea as to whether the colder pattern will last closer to two weeks or closer to four weeks until late this month. 3. The December 21-31 period should be cooler than the December 11-20 period. It very likely won't be severely cold based on consistent teleconnections forecasts into the start of that period. 4. In January, an AO-/PNA+ pattern has accounted for a disproportionate share of significant Mid-Atlantic snowstorms. Teleconnections can't be reliably forecast beyond two weeks.
-
The data is only for December. Yes, as you noted, big storms have occurred as the NAO was rising. During January, an AO-/PNA+ pattern is most favorable for significant snowfalls. I always welcome any snow. Hopefully, we’ll have one or two before December ends.
-
One caveat concerning the NAO when the PNA is negative in December. Once the NAO falls to or below -1, snowfalls tend to be smaller (biggest daily snowfall: 2.7”, December 27, 1976). Measurable snow fell on 7.3% of days. Between-0.999 and -0.001, nearly 60% of daily snowfalls were 2” or more. The December 26-27, 2010 blizzard was the biggest such storm with 20.0”. This blizzard produced the only days with 6” or more snowfall for this NAO subset. Measurable snow fell on 8.6% of days. Data was from 1950-2020. There were 137 days in the earlier subset (NAO -1 or below) and 267 days in the latter one. Snowfall was from Central Park.
-
We had more than 3” of snow in December 2020.
-
Morning thoughts… Today will be mostly sunny, breezy, and mild. High temperatures will likely reach the lower and middle 50s in most of the region. Likely high temperatures around the region include: New York City (Central Park): 53° Newark: 55° Philadelphia: 57° Normals: New York City: 30-Year: 44.9°; 15-Year: 45.6° Newark: 30-Year: 45.4°; 15-Year: 46.2° Philadelphia: 30-Year: 46.6°; 15-Year: 47.5° The unseasonably mild weather will continue into the start of the weekend.
-
Temperatures rose into the 50s today across most of the region. Similar warmth is likely tomorrow. Parts of the Midwest could see daily and December-record temperatures. Des Moines has a shot at seeing its first ever 70° December day. Some of that warmth will affect the region late in the week before cooler air again returns. No Arctic blasts appear likely for the foreseeable future. Overall, through December 20th, there will likely be only some relatively short-lived cool shots. Afterward, the AO could go negative, increasing the opportunity for colder outcomes. In the Midwest, Chicago has yet to receive its first measurable snowfall through December 12. Only four prior years saw their first measurable snowfall on December 12 or later: 1. December 20, 2012 2. December 16, 1965 3. December 14, 2001 4. December 12, 1946 The base case is that the closing 10 days of December could turn cooler, though not necessarily cold. Since 1950, there have been 7 cases where the AO averaged +2.000 or above during the first week in December, as has been the case this year. The mean December 21-31 temperature in New York City was 40.2°. The median temperature was 41.5°. The coldest was 35.3° (1951) and the warmest was 44.0° (1979). In short, this historic experience would suggest that there will be no severe Arctic outbreaks in the East this month. It also suggests that New York City will likely have an average temperature of 40° or above this month. Afterward, if the small sample of cases where the MJO moved into Phase 7 at a high amplitude (1.75 or above) during the December 10-20 period, as occurred this month, is representative, the first 10 days of January could see below to perhaps much below normal temperatures. Both the magnitude and duration of the cold is uncertain, but the potential pattern change as support on the latest EPS weekly guidance. Following very wet July-September periods, winter (December-February) precipitation has typically been near or below normal. The most recent exception was winter 2018-19. The ENSO Region 1+2 anomaly was -1.4°C and the Region 3.4 anomaly was -1.1°C for the week centered around December 8. For the past six weeks, the ENSO Region 1+2 anomaly has averaged -1.00°C and the ENSO Region 3.4 anomaly has averaged -0.92°C. La Niña conditions will likely persist into at least late winter. The SOI was +12.92 today. The preliminary Arctic Oscillation (AO) figure was +0.395 today. On December 11 the MJO was in Phase 7 at an amplitude of 2.411 (RMM). The December 10-adjusted amplitude was 2.425 (RMM). Based on sensitivity analysis applied to the latest guidance, there is an implied 87% probability that New York City will have a warmer than normal December (1991-2020 normal). December will likely finish with a mean temperature near 42.4° (3.3° above normal).
-
I believe we will probably see a cooler period during the first 10 days of January given the atmospheric response to the MJO’s move into Phase 7 at a very high amplitude. I am not sure whether there will be severe cold nor whether such a pattern would persist more than 2 weeks. It’s possible most of the severe cold will remain confined to the west.

