

donsutherland1
-
Posts
24,171 -
Joined
Content Type
Profiles
Blogs
Forums
American Weather
Media Demo
Store
Gallery
Everything posted by donsutherland1
-
Morning thoughts… It will be mostly cloudy and mild today. There will be some showers and periods of light rain. High temperatures will likely reach mainly the upper 40s and lower 50s in most of the region. Likely high temperatures around the region include: New York City (Central Park): 49° Newark: 53° Philadelphia: 59° Normals: New York City: 30-Year: 41.9°; 15-Year: 42.8° Newark: 30-Year: 42.4°; 15-Year: 43.5° Philadelphia: 30-Year: 43.7°; 15-Year: 44.7° The remainder of December will see generally above normal temperatures.
-
Earlier today, Bridgeport, Islip, and New York City received their first measurable snowfall of the season. First measurable snowfall statistics for select cities: Allentown: Normal: December 6; 2020-21: December 9 Bridgeport: Normal: December 3; 2020-21: December 16; 2021-22: December 24 Islip: Normal: December 10; 2020-21: December 16; 2021-22: December 24 New York City: Normal: December 13; 2020-21: December 16; 2021-22: December 24 Newark: Normal: December 9; 2020-21: December 9; 2021-22: November 28 Philadelphia: Normal: December 19; 2020-21: December 16 A very warm December is now nearing its conclusion. The remaining days of the month will be generally mild with only some modestly cooler days. It will be a different story in the Pacific Northwest. Near record to record cold, along with snowfall, is possible during the closing days of December in such cities as Portland, Seattle, and Vancouver. In the South, near record and record warmth will prevail. Today, Houston reached 80° for a December record 11th day. The old record of 10 days was set in 2012. January will likely commence with an AO-/PNA- pattern. That typically favors somewhat cooler than normal readings in the East. For NYC, the January 1-10, 1991-2020 mean temperature for such cases was 33.5° (normal: 34.8°). The latest guidance suggests that temperatures could head toward seasonal levels and then periodically below seasonal levels as the first week of January progresses. The coldest air will likely remain confined to the Pacific Northwest, Northern Plains, and western and central Canada. No severe cold is likely through at least the first week of January. There are some hints that a milder pattern could begin to develop around mid-January. In the Midwest, through 4 pm CST today, Chicago has yet to receive its first measurable snowfall. The old record latest first measurable snowfall was December 20, 2012. Following very wet July-September periods, winter (December-February) precipitation has typically been near or below normal. The most recent exception was winter 2018-19. The ENSO Region 1+2 anomaly was -1.7°C and the Region 3.4 anomaly was -1.1°C for the week centered around December 15. For the past six weeks, the ENSO Region 1+2 anomaly has averaged -1.15°C and the ENSO Region 3.4 anomaly has averaged -0.93°C. La Niña conditions will likely persist through meteorological winter. The SOI was +29.22 today. The preliminary Arctic Oscillation (AO) figure was -1.420 today. On December 22 the MJO was in Phase 7 at an amplitude of 2.514 (RMM). The December 21-adjusted amplitude was 2.342 (RMM). Based on sensitivity analysis applied to the latest guidance, there is an implied near 100% probability that New York City will have a warmer than normal December (1991-2020 normal). December will likely finish with a mean temperature near 43.2° (4.1° above normal). That would rank 2021 as the 6th warmest December on record.
-
000 NOUS41 KOKX 241531 PNSOKX CTZ005>012-NJZ002-004-006-103>108-NYZ067>075-078>081-176>179-250331- Public Information Statement National Weather Service New York NY 1031 AM EST Fri Dec 24 2021 ...SNOWFALL REPORTS... Location Amount Time/Date Provider ...Connecticut... ...Fairfield County... New Canaan 1.0 in 0700 AM 12/24 Trained Spotter Norwalk 1.0 in 0700 AM 12/24 COCORAHS Darien 1.0 in 0700 AM 12/24 COCORAHS Norwalk 1.0 in 0800 AM 12/24 COCORAHS Sandy Hook 1.0 in 0930 AM 12/24 COCORAHS Redding 0.7 in 0700 AM 12/24 COCORAHS Stratford 0.5 in 0600 AM 12/24 COCORAHS Monroe 0.5 in 0600 AM 12/24 COCORAHS Bethel 0.5 in 0700 AM 12/24 COCORAHS Fairfield 0.5 in 0700 AM 12/24 COCORAHS Brookfield 0.5 in 0700 AM 12/24 COCORAHS Ridgefield 0.5 in 0730 AM 12/24 COCORAHS Old Greenwich 0.5 in 0800 AM 12/24 COCORAHS Fairfield 1.1 SSE 0.5 in 0819 AM 12/24 COCORAHS Bridgeport 0.2 in 0700 AM 12/24 CO-OP Observer Bethel 4.5 SSE 0.1 in 0700 AM 12/24 COCORAHS ...Middlesex County... Clinton 1.2 in 0752 AM 12/24 Broadcast Media Killingworth 1.0 in 0700 AM 12/24 COCORAHS Higganum 0.8 in 0800 AM 12/24 COCORAHS Salem 2.8 WNW 0.3 in 0700 AM 12/24 COCORAHS ...New Haven County... Guilford 1.1 in 0700 AM 12/24 CO-OP Observer Hamden 0.7 in 0600 AM 12/24 COCORAHS Yalesville 0.6 in 0810 AM 12/24 COCORAHS Wallingford 0.5 in 0700 AM 12/24 COCORAHS Naugatuck 0.5 in 0700 AM 12/24 COCORAHS Prospect 0.5 in 0730 AM 12/24 COCORAHS Guilford Center 2.7 WSW 0.3 in 0830 AM 12/24 COCORAHS ...New London County... Colchester 0.6 ENE 1.5 in 0600 AM 12/24 COCORAHS Old Lyme 1.0 in 0700 AM 12/24 COCORAHS Oakdale 1.0 in 0700 AM 12/24 COCORAHS Norwich 1.0 in 0700 AM 12/24 COOP Griswold 1.0 in 0730 AM 12/24 COCORAHS New London 0.9 in 0900 AM 12/24 COCORAHS Preston 0.7 in 0700 AM 12/24 COCORAHS Norwich 5.2 SE 0.6 in 0745 AM 12/24 COCORAHS Stonington 0.6 in 0900 AM 12/24 COCORAHS East Lyme 0.5 in 0600 AM 12/24 COCORAHS Niantic 0.5 in 0600 AM 12/24 COCORAHS Waterford 0.4 in 0700 AM 12/24 COCORAHS Groton 0.4 in 0700 AM 12/24 COCORAHS Pawcatuck 0.3 in 0600 AM 12/24 COCORAHS Mystic 0.2 in 0700 AM 12/24 COCORAHS ...New Jersey... ...Bergen County... Ridgewood 1.9 in 0730 AM 12/24 Trained Spotter Oakland 1.0 in 0800 AM 12/24 COCORAHS Tenafly 0.3 in 0730 AM 12/24 COCORAHS ...Essex County... Verona 1.4 in 0830 AM 12/24 COCORAHS Livingston Twp 2.0 NNE 1.0 in 0700 AM 12/24 COCORAHS Montclair 0.9 in 0800 AM 12/24 COCORAHS Livingston 0.9 in 0900 AM 12/24 Public Maplewood 0.2 in 0800 AM 12/24 COCORAHS ...Hudson County... Harrison 0.5 in 0400 AM 12/24 CO-OP Observer ...Passaic County... Little Falls 1.0 in 0700 AM 12/24 COCORAHS Hawthorne 0.6 in 0700 AM 12/24 COCORAHS ...Union County... Westfield 0.2 in 0715 AM 12/24 COCORAHS New Providence 0.2 in 0730 AM 12/24 COCORAHS Newark Airport 0.1 in 0700 AM 12/24 Official NWS Obs ...New York... ...Nassau County... Manhasset Hills 0.5 in 0915 AM 12/24 Cocorahs Albertson 0.2 SSE 0.4 in 0730 AM 12/24 COCORAHS Syosset 0.2 in 0815 AM 12/24 COOP Hicksville 0.1 in 0626 AM 12/24 COCORAHS ...New York County... Central Park 0.2 in 0700 AM 12/24 Official NWS Obs ...Orange County... 0.8 N Port Jervis 2.0 in 0700 AM 12/24 COOP Port Jervis 1.5 in 0630 AM 12/24 COCORAHS Monroe 1.0 in 0655 AM 12/24 Trained Spotter Walden 0.7 in 0700 AM 12/24 COCORAHS ...Putnam County... Cold Spring 0.4 in 0715 AM 12/24 COCORAHS Carmel Hamlet 0.4 in 0810 AM 12/24 COOP ...Queens County... NYC/La Guardia 0.6 in 0700 AM 12/24 Official NWS Obs Whitestone 0.5 in 0700 AM 12/24 Public Little Neck 0.3 SE 0.5 in 0700 AM 12/24 COCORAHS NYC/JFK 0.2 in 0700 AM 12/24 Official NWS Obs ...Suffolk County... Mattituck 0.8 in 0857 AM 12/24 Trained Spotter 1 S Deer Park 0.5 in 0630 AM 12/24 Public Sayville 0.5 in 0700 AM 12/24 COCORAHS Brightwaters 0.5 in 0800 AM 12/24 COCORAHS Orient Point 0.5 in 0800 AM 12/24 COOP Centereach 0.4 in 0600 AM 12/24 COCORAHS Fishers Island 0.4 in 0700 AM 12/24 COCORAHS Upton 0.4 in 0700 AM 12/24 COOP Riverhead 0.4 in 0800 AM 12/24 COCORAHS Port Jefferson Station 0.4 in 0830 AM 12/24 COCORAHS Islip Airport 0.3 in 0700 AM 12/24 Official NWS Obs Amityville 0.3 in 0800 AM 12/24 COCORAHS Nesconset 0.3 in 0816 AM 12/24 COCORAHS Center Moriches 0.2 in 0600 AM 12/24 COCORAHS ...Westchester County... Armonk 1.1 in 0830 AM 12/24 Public Shrub Oak 0.7 in 0600 AM 12/24 COCORAHS White Plains 0.4 in 0830 AM 12/24 Trained Spotter &&
-
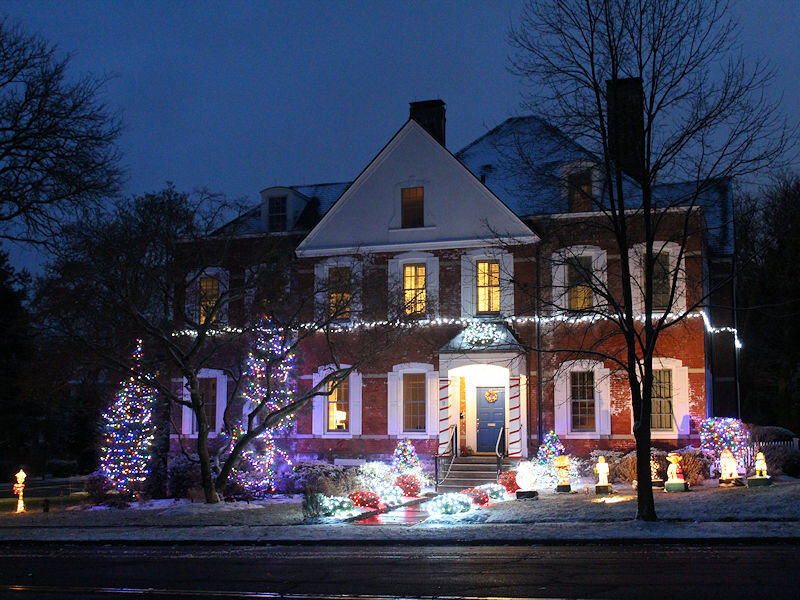
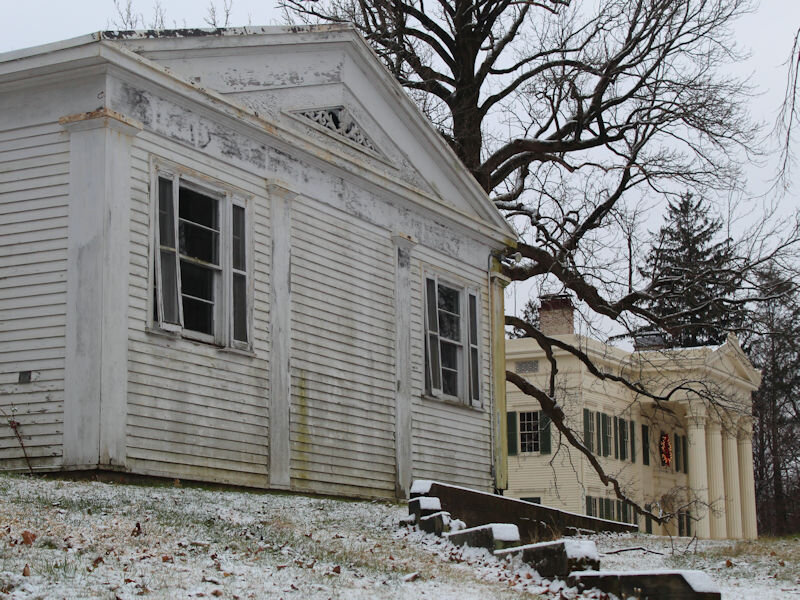
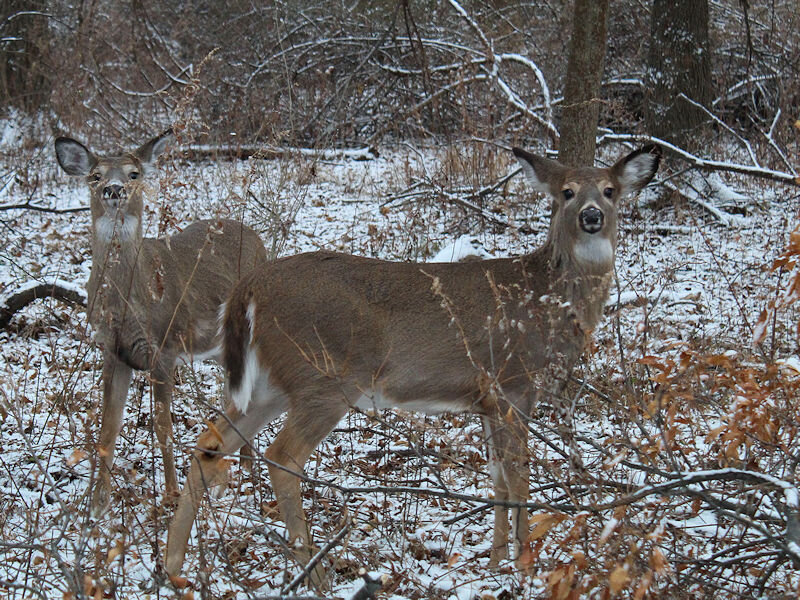
Three photos from this morning’s light snowfall:
-
Morning thoughts… It will be mostly cloudy today. It will turn milder. High temperatures will likely reach mainly the middle and upper 40s in most of the region. Likely high temperatures around the region include: New York City (Central Park): 44° Newark: 48° Philadelphia: 52° Normals: New York City: 30-Year: 42.1°; 15-Year: 43.0° Newark: 30-Year: 42.6°; 15-Year: 43.7° Philadelphia: 30-Year: 43.9°; 15-Year: 44.9° The remainder of December will see generally above normal temperatures.
-
I wish everyone a quick recovery.
-
Overnight, a system could bring a coating of snow north and west of Philadelphia, Newark and New York City. There is a small chance that one of these cities could pick up a measurable amount. It will then turn milder tomorrow. Afterward, a generally mild remainder of December lies ahead. It will be a different story in the Pacific Northwest. Near record to record cold, along with snowfall, is possible during the closing days of December in such cities as Portland, Seattle, and Vancouver. January will likely commence with an AO-/PNA- pattern. That typically favors somewhat cooler than normal readings in the East. For NYC, the January 1-10, 1991-2020 mean temperature for such cases was 33.5° (normal: 34.8°). The latest guidance suggests that temperatures could head toward seasonal levels and then periodically below seasonal levels as the first week of January progresses. The coldest air will likely remain confined to the Pacific Northwest, Northern Plains, and western and central Canada. No severe cold is likely through at least the first week of January. There are some hints that a milder pattern could begin to develop around mid-January. In the Midwest, through 4 pm CST today, Chicago has yet to receive its first measurable snowfall. The old record latest first measurable snowfall was December 20, 2012. Following very wet July-September periods, winter (December-February) precipitation has typically been near or below normal. The most recent exception was winter 2018-19. The ENSO Region 1+2 anomaly was -1.7°C and the Region 3.4 anomaly was -1.1°C for the week centered around December 15. For the past six weeks, the ENSO Region 1+2 anomaly has averaged -1.15°C and the ENSO Region 3.4 anomaly has averaged -0.93°C. La Niña conditions will likely persist through meteorological winter. The SOI was +8.46 today. The preliminary Arctic Oscillation (AO) figure was -1.419 today. On December 21 the MJO was in Phase 7 at an amplitude of 2.341 (RMM). The December 20-adjusted amplitude was 2.099 (RMM). Based on sensitivity analysis applied to the latest guidance, there is an implied near 100% probability that New York City will have a warmer than normal December (1991-2020 normal). December will likely finish with a mean temperature near 43.1° (4.0° above normal). That would tie 2021 with 1998 as the 6th warmest December on record.
-
There is some possibility. Some of the underlying drivers e.g., strong PDO- have remained relatively intact. The wave lengths have shortened. A La Niña has developed. A La Niña combined with a PNA- has often seen significant cold and snowy outcomes in the Pacific Northwest.
-
Morning thoughts… It will be partly sunny and cool today. High temperatures will likely reach mainly the middle and upper 30s and lower 40s in most of the region. Likely high temperatures around the region include: New York City (Central Park): 37° Newark: 40° Philadelphia: 40° Normals: New York City: 30-Year: 42.3°; 15-Year: 43.2° Newark: 30-Year: 42.8°; 15-Year: 43.9° Philadelphia: 30-Year: 44.1°; 15-Year: 45.1° Overnight, a weak system could bring a coating of snow to the north and west of Philadelphia, Newark, and New York City. There is a small chance that each of these cities could also pick up a measurable snowfall. Milder air will return afterward.
-
Another push of modestly colder air will bring down temperatures tomorrow, but a generally mild remainder of December lies ahead. It will be a different story in the Pacific Northwest. Near record to record cold, along with snowfall, is possible during the closing days of December in such cities as Portland, Seattle, and Vancouver. January will likely commence with an AO-/PNA- pattern. That typically favors somewhat cooler than normal readings in the East. For NYC, the January 1-10, 1991-2020 mean temperature for such cases was 33.5° (normal: 34.8°). The latest guidance suggests that temperatures could head toward seasonal levels and then below seasonal levels as the first week of January progresses. The coldest air will likely remain confined to the Pacific Northwest, Northern Plains, and western and central Canada. No severe cold is likely through at least the first week of January. There are some hints that a milder pattern could begin to develop around mid-January. In the Midwest, through 4 pm today, Chicago has yet to receive its first measurable snowfall. The old record latest first measurable snowfall was December 20, 2012. Following very wet July-September periods, winter (December-February) precipitation has typically been near or below normal. The most recent exception was winter 2018-19. The ENSO Region 1+2 anomaly was -1.7°C and the Region 3.4 anomaly was -1.1°C for the week centered around December 15. For the past six weeks, the ENSO Region 1+2 anomaly has averaged -1.15°C and the ENSO Region 3.4 anomaly has averaged -0.93°C. La Niña conditions will likely persist through meteorological winter. The SOI was -12.87 today. The preliminary Arctic Oscillation (AO) figure was -1.704 today. On December 20 the MJO was in Phase 7 at an amplitude of 2.096 (RMM). The December 19-adjusted amplitude was 1.615 (RMM). Based on sensitivity analysis applied to the latest guidance, there is an implied 99% probability that New York City will have a warmer than normal December (1991-2020 normal). December will likely finish with a mean temperature near 42.9° (3.8° above normal).
-
Morning thoughts… Light rain will give way to sunshine. It will become windy. High temperatures will likely reach mainly the middle and upper 40s in most of the region. Likely high temperatures around the region include: New York City (Central Park): 46° Newark: 50° Philadelphia: 48° Normals: New York City: 30-Year: 42.5°; 15-Year: 43.4° Newark: 30-Year: 43.0°; 15-Year: 44.1° Philadelphia: 30-Year: 44.3°; 15-Year: 45.3° Tomorrow will be sunny but cold. Milder air will return afterward.
-
It’s looking less promising, but some cold could still sink southward into the region. Severe cold isn’t likely. Tomorrow’s EPS weeklies will provide further insight.
-
Seattle had its wettest fall (19.04”) on record. Climate change is a function of forcings, not internal variability. The persistent NAO- would not change the ongoing energy imbalance that is resulting from an enhanced greenhouse effect.
-
Temperatures rose into the 40s today. Tomorrow will be another mild day before a brief push of modestly colder air knocks down temperatures on Thursday. Overall, temperatures will generally be near or above normal throughout much of the remainder of December. No severe cold is likely through the remainder of December. It will be a different story in the Pacific Northwest. Near record to record cold, along with snowfall, is possible during the closing days of December in such cities as Portland, Seattle, and Vancouver. Afterward, if the small sample of cases where the MJO moved into Phase 7 at a high amplitude (1.75 or above) during the December 10-20 period, as occurred this month, is representative, the first 10 days of January could see below to perhaps much below normal temperatures. However, the coldest air will likely remain confined to the Pacific Northwest, Northern Plains, and western and central Canada for much of this period. January will likely commence with an AO-/PNA- pattern. That typically favors somewhat cooler than normal readings in the East. For NYC, the January 1-10, 1991-2020 mean temperature for such cases was 33.5° (normal: 34.8°). There are some hints that a milder pattern could begin to develop around mid-January. In the Midwest, through 4 pm today, Chicago has yet to receive its first measurable snowfall. The old record latest first measurable snowfall was December 20, 2012. Following very wet July-September periods, winter (December-February) precipitation has typically been near or below normal. The most recent exception was winter 2018-19. The ENSO Region 1+2 anomaly was -1.4°C and the Region 3.4 anomaly was -1.1°C for the week centered around December 8. For the past six weeks, the ENSO Region 1+2 anomaly has averaged -1.00°C and the ENSO Region 3.4 anomaly has averaged -0.92°C. La Niña conditions will likely persist into at least late winter. The SOI was -27.14 today. That is the lowest value since June 20, 2020 when the SOI was -33.95. The preliminary Arctic Oscillation (AO) figure was -1.453 today. On December 19 the MJO was in Phase 7 at an amplitude of 1.611 (RMM). The December 18-adjusted amplitude was 1.677 (RMM). Based on sensitivity analysis applied to the latest guidance, there is an implied 98% probability that New York City will have a warmer than normal December (1991-2020 normal). December will likely finish with a mean temperature near 42.7° (3.6° above normal).
-
Morning thoughts… It will be partly sunny and milder today. High temperatures will likely reach mainly the lower and middle 40s in most of the region. Likely high temperatures around the region include: New York City (Central Park): 44° Newark: 47° Philadelphia: 46° Normals: New York City: 30-Year: 42.8°; 15-Year: 43.6° Newark: 30-Year: 43.3°; 15-Year: 44.3° Philadelphia: 30-Year: 44.5°; 15-Year: 45.6° Another brief push of cooler air is likely on Thursday before readings again warm up.
-
Almost certainly, the 1870-71 date is incorrect. On December 28, 1870, the high temperature was 32 and 0.10” precipitation fell. On December 30, the temperature range was 30-10 and 0.05” precipitation was recorded. The NWS .pdf shows 3.0” snow in December 1870. https://www.weather.gov/media/okx/Climate/CentralPark/monthlyseasonalsnowfall.pdf
-
Despite ample sunshine, readings were held much below normal today. But following another cold night, winter will lose its grip on the region, yet again. Temperatures will begin to moderate tomorrow. There will be one additional brief push of modestly colder air on Thursday. Overall, temperatures will generally be near or above normal throughout much of the remainder of December. The final week of December could still see temperatures begin to turn colder as month ends. No severe cold is likely. Afterward, if the small sample of cases where the MJO moved into Phase 7 at a high amplitude (1.75 or above) during the December 10-20 period, as occurred this month, is representative, the first 10 days of January could see below to perhaps much below normal temperatures. However, the coldest air will likely remain confined to the Pacific Northwest, Northern Plains, and western and central Canada for much of this period. January will likely commence with an AO-/PNA- pattern. That typically favors somewhat cooler than normal readings in the East. For NYC, the January 1-10, 1991-2020 mean temperature for such cases was 33.5° (normal: 34.8°). There are some hints that a milder pattern could begin to develop around mid-January. In the Midwest, Chicago has yet to receive its first measurable snowfall through 4 pm CST on December 20, 2021 has now tied the record for Chicago's latest first measurable snowfall. The existing record was set on December 20, 2012. That record is all but certain to be broken tomorrow. Following very wet July-September periods, winter (December-February) precipitation has typically been near or below normal. The most recent exception was winter 2018-19. The ENSO Region 1+2 anomaly was -1.4°C and the Region 3.4 anomaly was -1.1°C for the week centered around December 8. For the past six weeks, the ENSO Region 1+2 anomaly has averaged -1.00°C and the ENSO Region 3.4 anomaly has averaged -0.92°C. La Niña conditions will likely persist into at least late winter. The SOI was -9.81 today. The preliminary Arctic Oscillation (AO) figure was -1.950 today. On December 18 the MJO was in Phase 6 at an amplitude of 1.681 (RMM). The December 17-adjusted amplitude was 1.867 (RMM). Based on sensitivity analysis applied to the latest guidance, there is an implied 98% probability that New York City will have a warmer than normal December (1991-2020 normal). December will likely finish with a mean temperature near 42.6° (3.5° above normal).
-
Morning thoughts… It will be mostly sunny and unseasonably cold today. High temperatures will likely reach mainly the middle and upper 30s with perhaps a few lower 40s in most of the region. Likely high temperatures around the region include: New York City (Central Park): 37° Newark: 40° Philadelphia: 41° Normals: New York City: 30-Year: 43.0°; 15-Year: 43.8° Newark: 30-Year: 43.5°; 15-Year: 44.5° Philadelphia: 30-Year: 44.8°; 15-Year: 45.8° Milder air will return on tomorrow.
-
A stiff wind was drilling colder air into the region this evening creating mid-winter wind chills. Tomorrow morning could see the coldest readings so far this season. And then, winter will lose its grip on the region. Temperatures will moderate beginning on Tuesday. Temperatures will generally be near or above normal through much of the remainder of December. The final week of December could still see temperatures begin to turn colder as month comes to a close. No severe cold is likely. Afterward, if the small sample of cases where the MJO moved into Phase 7 at a high amplitude (1.75 or above) during the December 10-20 period, as occurred this month, is representative, the first 10 days of January could see below to perhaps much below normal temperatures. Support for such an outcome has increased on the recent guidance. Currently, the risk of severe cold at the start of January remains relatively low. There remains uncertainty concerning the magnitude and duration of the cold during the first 10 days of January. In the Midwest, Chicago has yet to receive its first measurable snowfall through 4 pm CST on December 19. Only December 2012 saw saw its first measurable snowfall after December 19 (December 20). Following very wet July-September periods, winter (December-February) precipitation has typically been near or below normal. The most recent exception was winter 2018-19. The ENSO Region 1+2 anomaly was -1.4°C and the Region 3.4 anomaly was -1.1°C for the week centered around December 8. For the past six weeks, the ENSO Region 1+2 anomaly has averaged -1.00°C and the ENSO Region 3.4 anomaly has averaged -0.92°C. La Niña conditions will likely persist into at least late winter. The SOI was -2.13 today. The preliminary Arctic Oscillation (AO) figure was -1.250 today. On December 17 the MJO was in Phase 6 at an amplitude of 1.867 (RMM). The December 16-adjusted amplitude was 2.010 (RMM). Based on sensitivity analysis applied to the latest guidance, there is an implied 97% probability that New York City will have a warmer than normal December (1991-2020 normal). December will likely finish with a mean temperature near 42.6° (3.5° above normal).
-
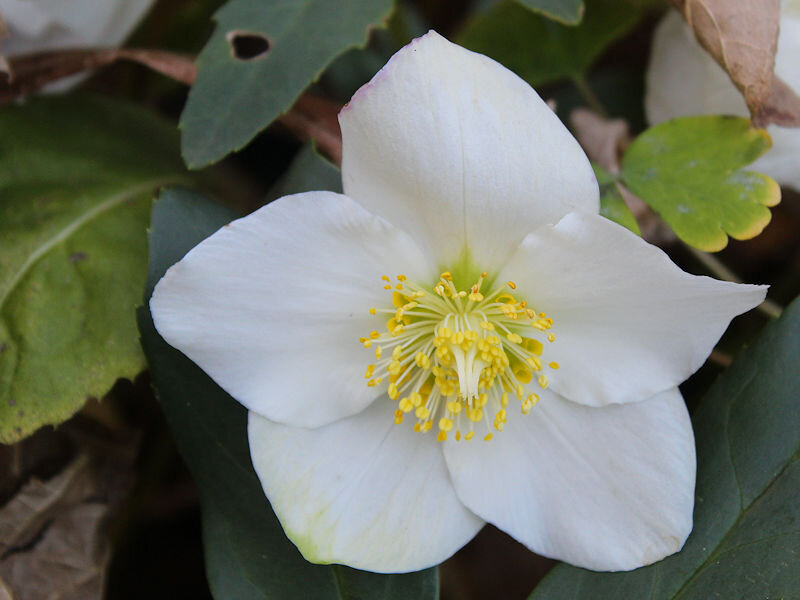
It’s now past mid-December. Yet, a lot still remains in bloom at the New York Botanical Garden:


-
I agree with you. I remain hopeful that we’ll have some snowfall opportunities.
-
Here’s what I could find:
-
Yes.
-
Morning thoughts… Clouds will break from west to east as the day progresses. Temperatures will only rise slightly as colder air pours into the region. High temperatures will likely reach the upper 30s and perhaps lower 40s in most of the region. Likely high temperatures around the region include: New York City (Central Park): 42° Newark: 44° Philadelphia: 45° Normals: New York City: 30-Year: 43.3°; 15-Year: 44.1° Newark: 30-Year: 43.8°; 15-Year: 44.8° Philadelphia: 30-Year: 45.0°; 15-Year: 46.0° Tomorrow will be fair but unseasonably cold. Milder air will likely return on Tuesday.
-
Colder air will begin to return to the region tonight and tomorrow. Monday morning could see the coldest readings so far this season, but the cold shot will be a brief one. Temperatures will likely moderate beginning on Tuesday. The final week of December could see temperatures begin to turn colder as month comes to a close. No severe cold is likely. Afterward, if the small sample of cases where the MJO moved into Phase 7 at a high amplitude (1.75 or above) during the December 10-20 period, as occurred this month, is representative, the first 10 days of January could see below to perhaps much below normal temperatures. Support for such an outcome has increased on the recent guidance. Currently, the risk of severe cold at the start of January remains relatively low. There remains uncertainty concerning the magnitude and duration of the cold during the first 10 days of January. In the Midwest, Chicago has yet to receive its first measurable snowfall through 4 pm CST on December 18. Only December 2012 saw saw its first measurable snowfall after December 16 (December 20). Following very wet July-September periods, winter (December-February) precipitation has typically been near or below normal. The most recent exception was winter 2018-19. The ENSO Region 1+2 anomaly was -1.4°C and the Region 3.4 anomaly was -1.1°C for the week centered around December 8. For the past six weeks, the ENSO Region 1+2 anomaly has averaged -1.00°C and the ENSO Region 3.4 anomaly has averaged -0.92°C. La Niña conditions will likely persist into at least late winter. The SOI was +8.93 today. The preliminary Arctic Oscillation (AO) figure was -0.889 today. On December 16 the MJO was in Phase 6 at an amplitude of 2.005 (RMM). The December 15-adjusted amplitude was 1.974 (RMM). Based on sensitivity analysis applied to the latest guidance, there is an implied 94% probability that New York City will have a warmer than normal December (1991-2020 normal). December will likely finish with a mean temperature near 42.4° (3.3° above normal).

