donsutherland1
-
Posts
24,181 -
Joined
Content Type
Profiles
Blogs
Forums
American Weather
Media Demo
Store
Gallery
Everything posted by donsutherland1
-
Probably right. I suspect that there have been some recent cases where a measurement wasn’t made when the snow stopped falling.
-
I heard that there was more than 0.1” at Rego Park.
-
Snow flurries in Larchmont, NY.
-
A strong storm will bring a period of snow or freezing rain changing to rain to much of the region late tonight into tomorrow. A moderate to significant snowfall is likely across central and upstate New York into central and northern New England. Western and Upstate New York, along with parts of Ontario and Quebec could see a significant snowfall. Some of those areas could pick up a foot or more of snow. Eastern New England and much of Long Island will likely experience mostly or all rain. High winds will produce coastal flooding especially during high tide tomorrow morning. Snowfall estimates: Allentown: 1"-3" Baltimore: 1"-3" Bridgeport: 1" or less New York City: 0.5" or less Newark: 1" or less Philadelphia: 1" or less Poughkeepsie: 2"-4" Washington, DC: 1"-3" The PNA is positive and is likely to remain positive through at least January 27th. A positive PNA is associated with more frequent snowfalls in the Middle Atlantic region. However, big snowfalls typically occur when the AO is negative. Some of the guidance suggests that the AO could go negative around or just after January 20th for a time. Overall, the cold pattern currently in place will likely last into at least the closing days of the month. The ENSO Region 1+2 anomaly was -0.9°C and the Region 3.4 anomaly was -1.1°C for the week centered around January 5. For the past six weeks, the ENSO Region 1+2 anomaly has averaged -1.32°C and the ENSO Region 3.4 anomaly has averaged -1.05°C. La Niña conditions will likely persist through meteorological winter. The SOI was -14.46 today. The preliminary Arctic Oscillation (AO) was +0.870. On January 14 the MJO was in Phase 8 at an amplitude of 1.312 (RMM). The January 13-adjusted amplitude was 1.697 (RMM). Based on sensitivity analysis applied to the latest guidance, there is an implied 90% probability that New York City will have a colder than normal January (1991-2020 normal). January will likely finish with a mean temperature near 30.9° (2.8° below normal).
-
I love your posts. There’s always something to learn from seeing the thinking and reading the insights of someone who is truly exceptional in his field.
-
Morning thoughts… Clouds will increase during the afternoon. Snow changing to rain or rain will arrive tonight. High temperatures will likely reach upper 30s and lower 40s in most of the region. Likely high temperatures around the region include: New York City (Central Park): 39° Newark: 40° Philadelphia: 45° Normals: New York City: 30-Year: 39.1°; 15-Year: 39.9° Newark: 30-Year: 39.6°; 15-Year: 40.6° Philadelphia: 30-Year: 40.9°; 15-Year: 41.7° Tomorrow will be very windy as rain ends across the region. Coastal flooding is likely during the morning high tide.
-
Clouds will increase tomorrow. After a cold start, temperatures will rise through the 20s into the 30s. A strong storm could bring snow changing to rain to much of the region late tomorrow night into Monday. A moderate to significant snowfall is likely across central and upstate New York into central and northern New England. Western and Upstate New York into Quebec could see a significant snowfall. Parts of those areas could pick up a foot or more of snow. Eastern New England and much of Long Island will likely experience mostly or all rain. High winds could produce coastal flooding especially during high tide on Monday morning. Initial snowfall estimates: Allentown: 1"-3" Baltimore: 1"-3" Bridgeport: 1" or less New York City: 0.5" or less Newark: 1" or less Philadelphia: 1" or less Poughkeepsie: 2"-4" Washington, DC: 1"-3" January commenced with an AO-/PNA- pattern. That typically favors somewhat cooler than normal readings in the East. For NYC, the January 1-10, 1991-2020 mean temperature for such cases was 33.5° (normal: 34.8°). The cold pattern developed during the opening week of the month. In New York City, the January 1-15 mean temperature was 32.9°. Based on the latest guidance, it appears that the colder pattern that is now in place could last until late in the month. The PNA is positive and is likely to remain positive through at least January 24th. A positive PNA is associated with more frequent snowfalls in the Middle Atlantic region. However, big snowfalls typically occur when the AO is negative. Some of the guidance suggests that the AO could go negative around or just after January 18th for a time. The ENSO Region 1+2 anomaly was -0.9°C and the Region 3.4 anomaly was -1.1°C for the week centered around January 5. For the past six weeks, the ENSO Region 1+2 anomaly has averaged -1.32°C and the ENSO Region 3.4 anomaly has averaged -1.05°C. La Niña conditions will likely persist through meteorological winter. The SOI was -24.40 today. The preliminary Arctic Oscillation (AO) was +1.087. On January 13 the MJO was in Phase 8 at an amplitude of 1.698 (RMM). The January 12-adjusted amplitude was 2.069 (RMM). Based on sensitivity analysis applied to the latest guidance, there is an implied 90% probability that New York City will have a colder than normal January (1991-2020 normal). January will likely finish with a mean temperature near 31.1° (2.6° below normal).
-
As the wave lengths continue to shorten in March, snowstorms are more widely dispersed. The large scale patterns suggested by the teleconnections become relatively less important than smaller scale features.
-
I wouldn’t compare it to December. Shorter wave lengths can lead to troughs in the East.
-
One has to be careful how one uses the teleconnections. A given combination e.g., AO-/PNA+ may have resulted in X% days with measurable snowfall, while an AO+/PNA- resulted in Y% days with measurable snowfall (much less, in this case than X%). In neither case is the percentage 0%. So, one has a quick idea—a starting point—that one pattern typically sees more frequent measurable snowfall than another. Existence of a given pattern does not guarantee any outcomes. The error many make is that they place too much certainty on outcomes (deterministic thinking over probabilistic thinking). One can proceed further to break each general scenario into clusters (500 mb, etc.) for further insight. Again, even if one cluster has had a high percentage of measurable snowfall outcomes, nothing is assured. Without a storm system, there is no precipitation. Without sufficient cold (atmosphere and near surface), there is no snowfall. Without a good alignment of synoptic features, one can see scenarios ranging from rainfall to no precipitation at all. One sees similar issues in thinking when it comes to other widely-cited variables such as the MJO. There are cases where a high amplitude MJO passage through one of the Phases leads to outcomes that differ markedly from the more typical outcomes. The same also applies to ENSO. Seasonal and sub-seasonal outcomes may well vary widely from the so-called canonical outcomes. No one variable—ENSO, MJO, SSTA distributions, teleconnections—explains more than a small piece of the overall picture. The deterministic line of reasoning—if variable is in X state then expect Y outcome—oversimplifies things and can create forecasting blind spots. These forecasting blind spots can be especially large when one is relying on analogs. Sometimes things work out well, but just because one case evolved into a given outcome over a 1-3 month timeframe, there is no assurance that a similar case will do so. If one recalls, Social Media was abuzz with the 1995-1996 analog back in early December. Nothing remotely like that exceptional winter season has played out (and given differing states of the PDO, among other things, the probability of such an evolution was always low). One needs to look deeper. The models and ensembles make this possible. Even then, one should beware of model limitations and the reality that there remains a degree of uncertainty.
-
Second half of February when the wave lengths shorten.
-
Morning thoughts… This morning, the temperature fell to 11° in New York City. That was the coldest temperature since February 1, 2019 when the thermometer also dipped to 11°. Washington, DC had a preliminary low temperature of 23° amidst a record streak of 1,077 consecutive days on which the temperature had not fallen below 20°. It will be partly sunny, breezy, and very cold. High temperatures will likely reach lower and middle 20s in most of the region. Likely high temperatures around the region include: New York City (Central Park): 21° Newark: 23° Philadelphia: 27° Normals: New York City: 30-Year: 39.2°; 15-Year: 39.9° Newark: 30-Year: 39.6°; 15-Year: 40.6° Philadelphia: 30-Year: 40.9°; 15-Year: 41.7° A storm will likely bring snow changing to rain late Sunday night or Monday. A small accumulation of snow and sleet is possible in Philadelphia, Newark and New York City.
-
It should be more promising, but favorable patterns don’t always produce. Next weekend (1/22-23) might provide one snowfall opportunity.
-
Another frigid air mass is currently overspreading the region. Tomorrow will be very cold despite partly sunny skies. Temperatures will struggle to reach the lower 20s. After a dry weekend, a strong storm could bring snow changing to rain to much of the region late Sunday night and Monday. A small accumulation of snow and sleet appears likely in Philadelphia, Newark, and New York City. A moderate to significant snowfall is likely across central and upstate New York into central and northern New England. Western and Upstate New York into Quebec could see a significant snowfall. Eastern New England and much of Long Island will likely experience mostly or all rain. High winds could produce coastal flooding especially during high tide on Monday morning. January commenced with an AO-/PNA- pattern. That typically favors somewhat cooler than normal readings in the East. For NYC, the January 1-10, 1991-2020 mean temperature for such cases was 33.5° (normal: 34.8°). This time around, the average will be warmer, but the transition toward colder weather has occurred. By mid-month, New York City's temperature anomaly will very likely be below normal. Based on the latest guidance, it appears that the colder pattern that is now in place could last 3-4 weeks until late in the month. The PNA is positive and is likely to remain positive through at least January 24th. A positive PNA is associated with more frequent snowfalls in the Middle Atlantic region. However, big snowfalls typically occur when the AO is negative. Some of the guidance suggests that the AO could go negative around or just after January 18th for a time. The ENSO Region 1+2 anomaly was -0.9°C and the Region 3.4 anomaly was -1.1°C for the week centered around January 5. For the past six weeks, the ENSO Region 1+2 anomaly has averaged -1.32°C and the ENSO Region 3.4 anomaly has averaged -1.05°C. La Niña conditions will likely persist through meteorological winter. The SOI was -9.70 today. The preliminary Arctic Oscillation (AO) was +0.500. On January 12 the MJO was in Phase 8 at an amplitude of 2.069 (RMM). The January 11-adjusted amplitude was 2.338 (RMM). Based on sensitivity analysis applied to the latest guidance, there is an implied 85% probability that New York City will have a colder than normal January (1991-2020 normal). January will likely finish with a mean temperature near 31.3° (2.4° below normal).
-
Morning thoughts… Today will see clouds break and a gusty wind develop. Temperatures will fall during the afternoon. High temperatures will likely reach lower and middle 40s in most of the region. Likely high temperatures around the region include: New York City (Central Park): 42° Newark: 44° Philadelphia: 47° Tomorrow will be a fair but vey cold day. Afterward, a storm will likely bring snow changing to rain late Sunday night or Monday. A small accumulation of snow and sleet is possible in Philadelphia, Newark and New York City.
-
Colder air will begin to return to the region for this weekend. Tomorrow could see some rain or snow showers as an Arctic cold front moves across the region. Saturday will be very cold despite ample sunshine. Temperatures will struggle to reach the lower 20s. After a dry weekend, a strong storm could bring snow changing to rain to much of the region. Details remain to be resolved. But a small accumulation of snow and sleet appears likely in Philadelphia, Newark, and New York City. A moderate to significant snowfall is likely across central and upstate New York into central and northern New England. Western and Upstate New York into Quebec could see a significant snowfall. Eastern New England and much of Long Island will likely experience mostly or all rain. High winds could produce coastal flooding. January commenced with an AO-/PNA- pattern. That typically favors somewhat cooler than normal readings in the East. For NYC, the January 1-10, 1991-2020 mean temperature for such cases was 33.5° (normal: 34.8°). This time around, the average will be warmer, but the transition toward colder weather has occurred. By mid-month, New York City's temperature anomaly will very likely be below normal. Based on the latest guidance, it appears that the colder pattern that is now in place could last 3-4 weeks until late in the month. The PNA is positive and is likely to remain positive through at least January 24th. A positive PNA is associated with more frequent snowfalls in the Middle Atlantic region. However, big snowfalls typically occur when the AO is negative. Some of the guidance suggests that the AO could go negative around or just after January 18th for a short period of time. The ENSO Region 1+2 anomaly was -0.9°C and the Region 3.4 anomaly was -1.1°C for the week centered around January 5. For the past six weeks, the ENSO Region 1+2 anomaly has averaged -1.32°C and the ENSO Region 3.4 anomaly has averaged -1.05°C. La Niña conditions will likely persist through meteorological winter. The SOI was +5.14 today. The preliminary Arctic Oscillation (AO) was +1.753. On January 11 the MJO was in Phase 8 at an amplitude of 2.337 (RMM). The January 10-adjusted amplitude was 2.059 (RMM). Based on sensitivity analysis applied to the latest guidance, there is an implied 83% probability that New York City will have a colder than normal January (1991-2020 normal). January will likely finish with a mean temperature near 31.5° (2.2° below normal).
-
To avoid confusion, I was referring to Central Park. Other parts of the region could reach 15”.
-
Probably under 15” but above where things currently stand.
-
Morning thoughts… Today will be partly to mostly cloudy and mild High temperatures will likely reach lower and middle 40s in most of the region. Likely high temperatures around the region include: New York City (Central Park): 43° Newark: 45° Philadelphia: 46° Normals: New York City: 30-Year: 39.2°; 15-Year: 40.1° Newark: 30-Year: 39.7°; 15-Year: 40.8° Philadelphia: 30-Year: 41.1°; 15-Year: 41.9° Another shot of cold air is likely this weekend. Afterward, a storm will likely bring snow changing to rain late Sunday night or Monday.
-
Tomorrow will be another mild day. Much of the region will see temperatures rise into the lower 40s. However, the mild period will be shortlived. Another shot of Arctic air will move in during the weekend. Its arrival could be preceded by some snow or rain showers late Friday or Friday night. After a dry weekend, a strong storm could bring snow changing to rain to much of the region. Details remain to be resolved. January commenced with an AO-/PNA- pattern. That typically favors somewhat cooler than normal readings in the East. For NYC, the January 1-10, 1991-2020 mean temperature for such cases was 33.5° (normal: 34.8°). This time around, the average will be warmer, but the transition toward colder weather has occurred. By mid-month, New York City's temperature anomaly will very likely be below normal. Based on the latest guidance, it appears that the colder pattern that is now in place could last 3-4 weeks until late in the month. The PNA is now positive and is likely to remain positive through at least January 24th. A positive PNA is associated with more frequent snowfalls in the Middle Atlantic region. However, big snowfalls typically occur when the AO is negative. Some of the guidance suggests that the AO could go negative around or just after January 18th. The ENSO Region 1+2 anomaly was -0.9°C and the Region 3.4 anomaly was -1.1°C for the week centered around January 5. For the past six weeks, the ENSO Region 1+2 anomaly has averaged -1.32°C and the ENSO Region 3.4 anomaly has averaged -1.05°C. La Niña conditions will likely persist through meteorological winter. The SOI was -0.32 today. The preliminary Arctic Oscillation (AO) was +1.816. On January 10 the MJO was in Phase 8 at an amplitude of 2.056 (RMM). The January 9-adjusted amplitude was 1.886 (RMM). Based on sensitivity analysis applied to the latest guidance, there is an implied 76% probability that New York City will have a colder than normal January (1991-2020 normal). January will likely finish with a mean temperature near 31.6° (2.1° below normal).
-
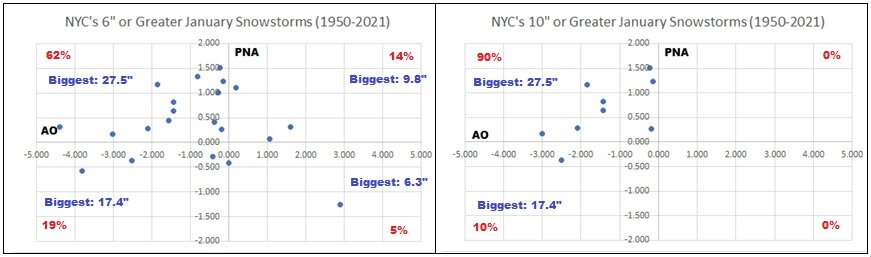
Scatter Diagrams for NYC’s 6”+ and 10”+ January snowstorms for the AO and PNA.