

donsutherland1
-
Posts
24,169 -
Joined
Content Type
Profiles
Blogs
Forums
American Weather
Media Demo
Store
Gallery
Everything posted by donsutherland1
-
January 28/29 Blizzard Observations/Discussion/Nowcasting
donsutherland1 replied to Northof78's topic in New York City Metro
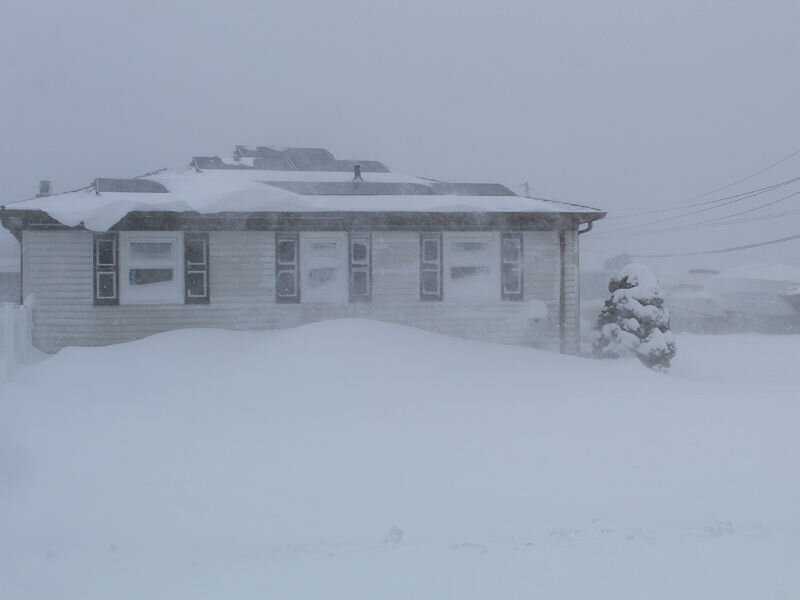
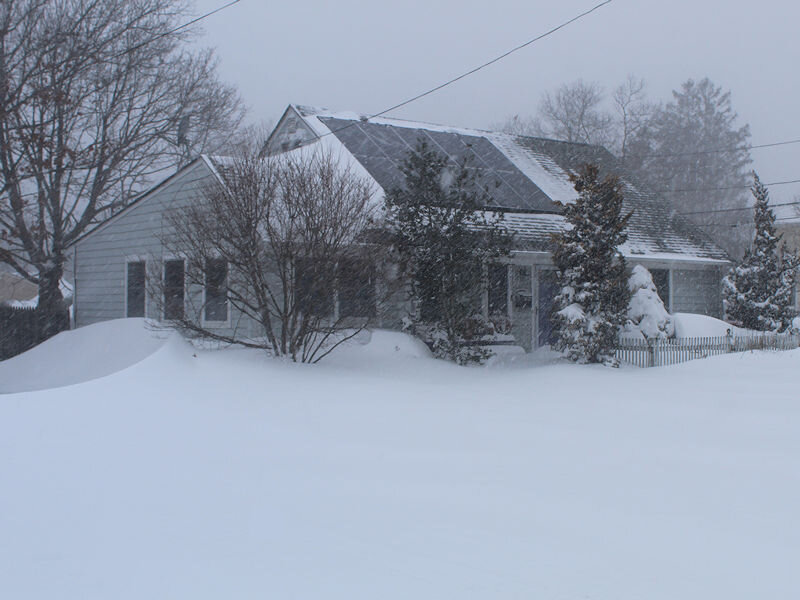
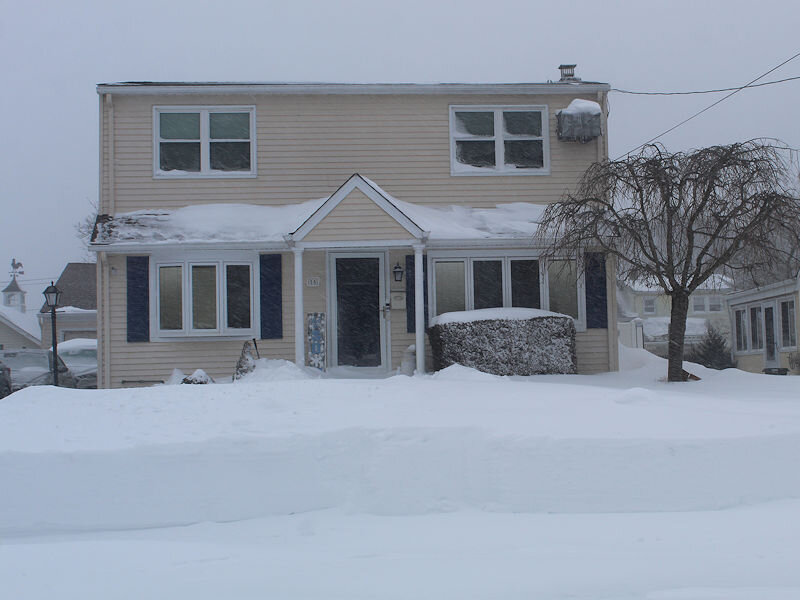
The snow grew heavier as I headed East. It was extremely heavy from Islip to Holbrook to Patchogue. -
January 28/29 Blizzard Observations/Discussion/Nowcasting
donsutherland1 replied to Northof78's topic in New York City Metro
I had planned to see my sister and the visit coincided nicely with the storm. -
January 28/29 Blizzard Observations/Discussion/Nowcasting
donsutherland1 replied to Northof78's topic in New York City Metro
The snow was noticeably heavier as I drove eastward across Queens. -
January 28/29 Blizzard Observations/Discussion/Nowcasting
donsutherland1 replied to Northof78's topic in New York City Metro
Final amount was 8.3”. -
January 28/29 Blizzard Observations/Discussion/Nowcasting
donsutherland1 replied to Northof78's topic in New York City Metro
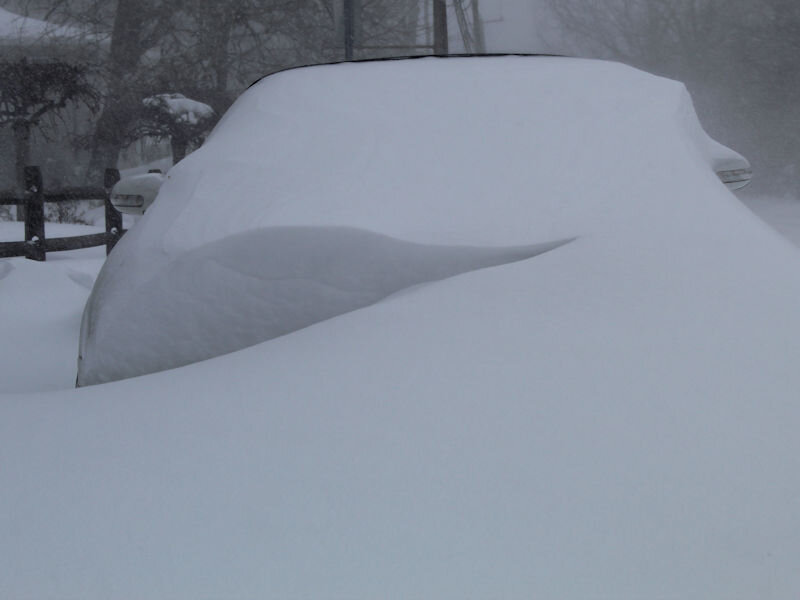
Some photos from Patchogue, NY: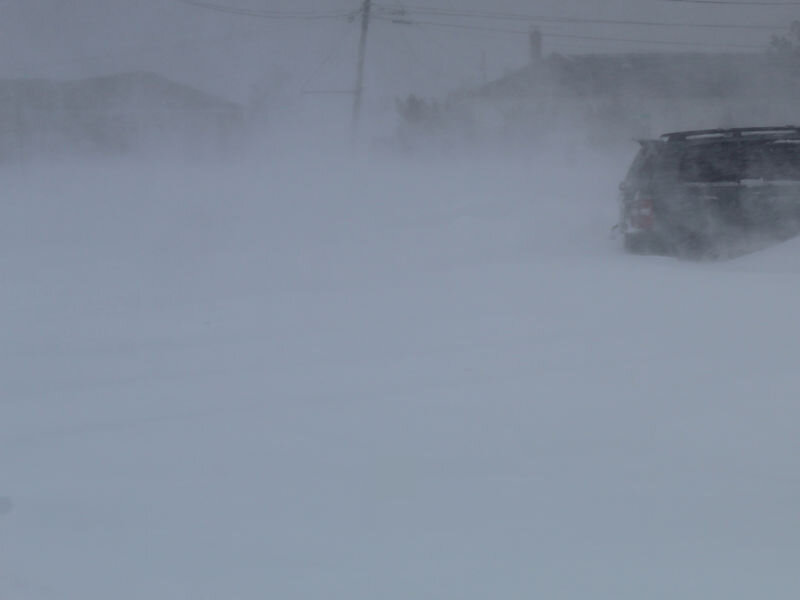
-
January 28/29 Blizzard Observations/Discussion/Nowcasting
donsutherland1 replied to Northof78's topic in New York City Metro
From Patchogue late this morning: -
January 28/29 Blizzard Observations/Discussion/Nowcasting
donsutherland1 replied to Northof78's topic in New York City Metro
Thanks. I will be safe and will enjoy the storm. -
January 28/29 Blizzard Observations/Discussion/Nowcasting
donsutherland1 replied to Northof78's topic in New York City Metro
That was near exit 50. -
January 28/29 Blizzard Observations/Discussion/Nowcasting
donsutherland1 replied to Northof78's topic in New York City Metro
I am now in Patchogue visiting my sister. -
January 28/29 Blizzard Observations/Discussion/Nowcasting
donsutherland1 replied to Northof78's topic in New York City Metro
Long Island Expressway: -
HREF was around 12”-13” at JFK with 15” near the Nassau County-Queens border.
-
Morning thoughts… Snow from a powerful offshore storm will gradually end from west to east today. It will be windy and unseasonably cold. High temperatures will likely reach the upper teens and lower 20s in most of the region. Likely high temperatures around the region include: New York City (Central Park): 20° Newark: 22° Philadelphia: 24° Tomorrow will be fair but cold.
-
Also, there was a modest increase in snowfall in NYC and just north and west of the City.
-
It is. Hopefully, the storm will come a little farther west than modeled.
-
It looks like the 6” line is maybe 10-15 miles west of the Hudson River and the 10” line is just east of the East River.
-
1/29 0z HREF:
-
January 28/29 Blizzard Observations/Discussion/Nowcasting
donsutherland1 replied to Northof78's topic in New York City Metro
Just after 10 pm: -
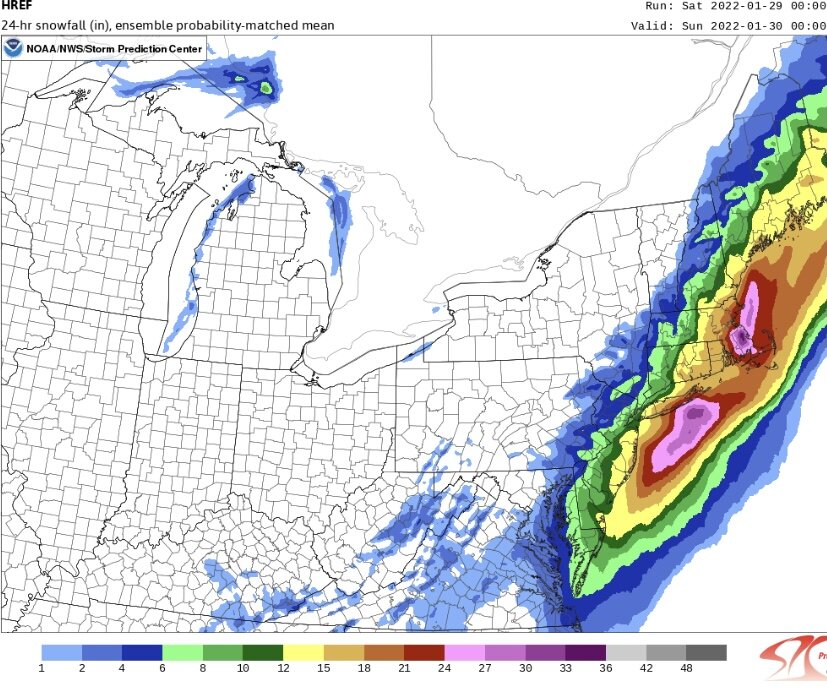
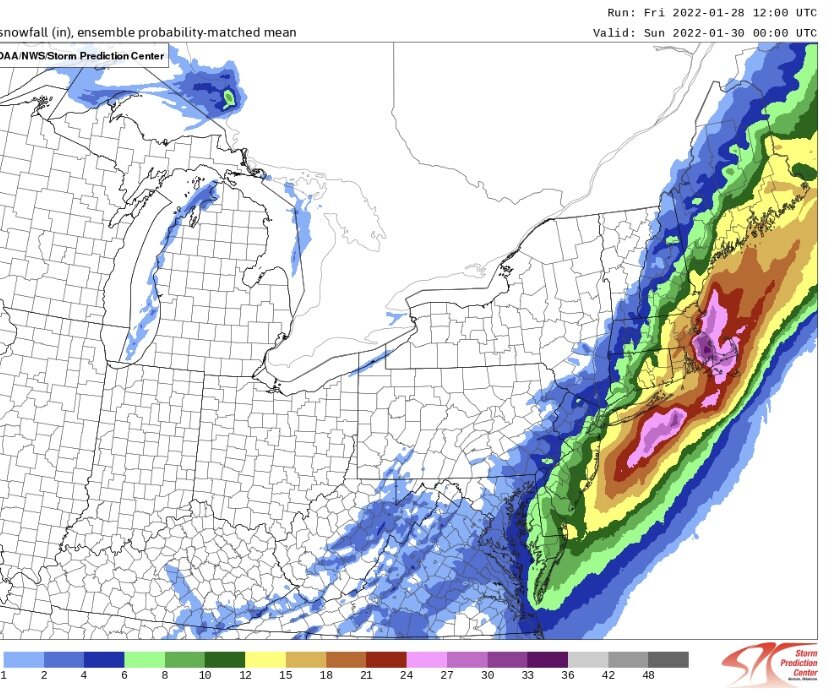
A negative AO often translates into a wavier, more meridional jet stream. This allows storms to track more northward rather than eastward during zonal situations. The upcoming storm has some upper air similarities to the January 2015 storm.
-
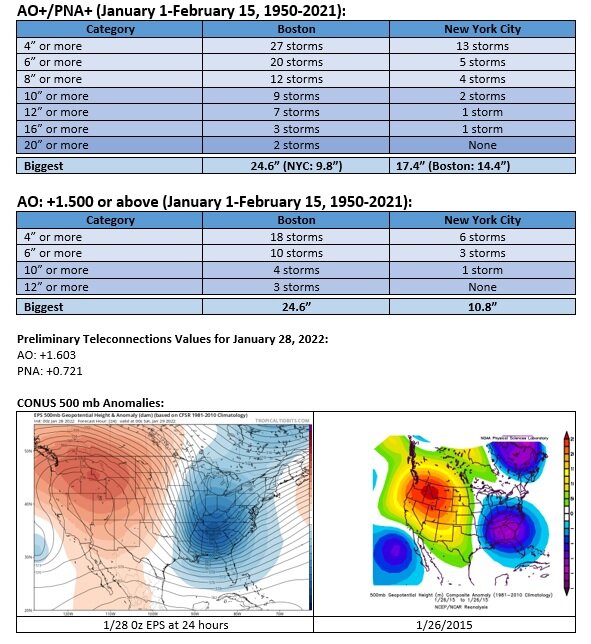
A rapidly intensifying storm will move northward off the Atlantic coast bringing blizzard conditions to parts of Long Island and eastern New England. During the height of the storm, winds could gust past 60 mph in that region with temperatures falling into the teens. Visibilities will decrease to 1/8 mile or less. Moderate to heavy snow will reach Newark and New York City for a time, but the heaviest amounts will fall east of those areas. Snowfall estimates: Boston: 16"-24" Bridgeport: 7"-14" Islip: 14"-20" New York City: 6"-12" Newark: 5"-10" Philadelphia: 4"-8" Poughkeepsie: 2"-4" During the January 15-February 15, 1950-2021 period, 37% of Boston's 10" or greater snowstorms have occurred during an AO+/PNA+ pattern. In contrast, just 12% of New York City's and 10% of Philadelphia's 10" or greater snowstorms have occurred with such a pattern. Not surprisingly, for New York City and Newark to reach 10" or more, one will need the storm to phase somewhat farther to the west than is currently modeled. The ENSO Region 1+2 anomaly was -0.5°C and the Region 3.4 anomaly was -0.8°C for the week centered around January 19. For the past six weeks, the ENSO Region 1+2 anomaly has averaged -1.05°C and the ENSO Region 3.4 anomaly has averaged -0.98°C. La Niña conditions will likely persist through meteorological winter. The SOI was +23.65 today. The preliminary Arctic Oscillation (AO) was +1.603. On January 26 the MJO was in Phase 8 at an amplitude of 0.847 (RMM). The January 25-adjusted amplitude was 0.910 (RMM). Based on sensitivity analysis applied to the latest guidance, there is an implied near 100% probability that New York City will have a colder than normal January (1991-2020 normal). January will likely finish with a mean temperature near 30.2° (3.5° below normal).
-
The HREF:
-
I agree. FWIW, below are Suffolk County's amounts from that storm: ...SUFFOLK COUNTY... ORIENT 30.0 807 PM 1/27 TRAINED SPOTTER SOUTHAMPTON 29.0 615 PM 1/27 PUBLIC MATTITUCK 26.9 404 PM 1/27 TRAINED SPOTTER MEDFORD 25.6 100 PM 1/27 PUBLIC ISLIP AIRPORT 24.9 100 PM 1/27 FAA CONTRACT OBSERVER NORTH PATCHOGUE 24.1 1235 PM 1/27 PUBLIC WEST BABYLON 24.0 600 PM 1/27 PUBLIC OAKDALE 23.5 120 PM 1/27 PUBLIC MILLER PLACE 22.0 130 PM 1/27 PUBLIC FLANDERS 22.0 204 PM 1/27 TRAINED SPOTTER PORT JEFFERSON STATI 22.0 600 PM 1/27 PUBLIC LINDENHURST 21.6 530 PM 1/27 TRAINED SPOTTER FARMINGVILLE 21.5 330 PM 1/27 TRAINED SPOTTER HOLBROOK 21.5 100 PM 1/27 PUBLIC EAST NORTHPORT 21.0 715 PM 1/27 PUBLIC SHOREHAM 21.0 413 PM 1/27 PUBLIC COMMACK 20.0 1030 AM 1/27 PUBLIC DEER PARK 20.0 1230 PM 1/27 PUBLIC SMITHTOWN 20.0 1240 PM 1/27 PUBLIC UPTON 17.1 100 PM 1/27 NWS OFFICE BAY SHORE 16.5 1110 AM 1/27 TRAINED SPOTTER TERRYVILLE 16.5 1202 PM 1/27 PUBLIC ST. JAMES 16.0 1100 AM 1/27 PUBLIC YAPHANK 15.7 220 PM 1/27 PUBLIC LAKE RONKONKOMA 14.0 1120 AM 1/27 TRAINED SPOTTER OLD FIELD 9.2 212 PM 1/27 TRAINED SPOTTER
-
While waiting for additional model runs, some info. regarding snowstorms with an AO+/PNA+ pattern. The 500 mb pattern over the U.S. is similar to that of January 26, 2015 leading up to a storm that brought 24.6" snow to Boston, 10.7” to JFK, 11.0”, to LGA and 9.8" to NYC. There were widespread 12”-20” amounts in Suffolk County. The synoptic evolution and details will drive the outcomes for the upcoming storm.
-
January 28/29 Blizzard Observations/Discussion/Nowcasting
donsutherland1 replied to Northof78's topic in New York City Metro
Light snow in the Bronx. Surfaces are dusted. -
Morning thoughts… It will be mostly cloudy with some snow flurries and snow showers. High temperatures will likely reach the lower and middle 30s in most of the region. Likely high temperatures around the region include: New York City (Central Park): 33° Newark: 33° Philadelphia: 36° A rapidly intensifying storm will bring heavy snow with blizzard conditions to parts of the region late tonight and tomorrow. The worst of the storm will occur on Long Island and in eastern New England where blizzard conditions are likely to occur. The 6z NAM likely illustrates the top-end case that is possible from the storm, not the most likely scenario right now. The situation remains complex and modest adjustments can still lead to large changes in snowfall amounts. Snowfall estimates: Boston: 16”-24” Bridgeport: 7”-14” Islip: 14”-20” New York City: 6”-12” Newark: 5”-10” Philadelphia: 4”-8” Poughkeepsie: 2”-4” Normals: New York City: 30-Year: 39.5°; 15-Year: 39.8° Newark: 30-Year: 40.0°; 15-Year: 40.5° Philadelphia: 30-Year: 41.3°; 15-Year: 41.6°
-
You have my fullest condolences. I’m very sorry to learn of your father’s passing.

