donsutherland1
-
Posts
24,013 -
Joined
Content Type
Profiles
Blogs
Forums
American Weather
Media Demo
Store
Gallery
Everything posted by donsutherland1
-
Mountain West Discussion
donsutherland1 replied to mayjawintastawm's topic in Central/Western States
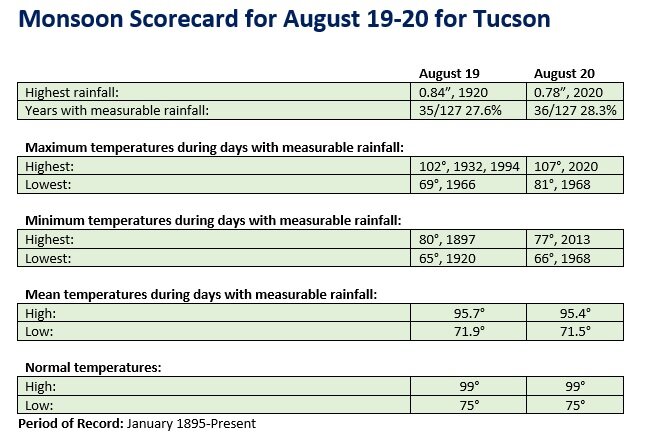
August 19-20 could feature heavy monsoonal rains in Phoenix and Tucson. The potential exists for 1" or more daily rainfall at both cities on at least one day. Monsoon Scorecards for both cities are below.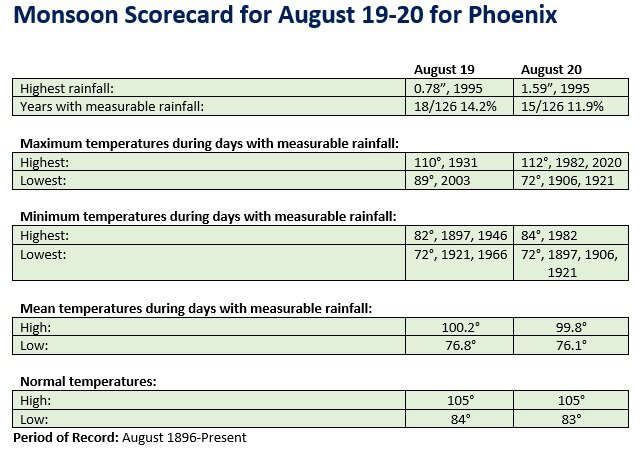
-
Occasional Thoughts on Climate Change
donsutherland1 replied to donsutherland1's topic in Climate Change
Summer 1936 and Summer 2021 are currently tied for hottest summer according to the NOAA's most recent ranking. In the larger scheme of things, most of the hot summers (mean temperature of 73° or above) have occurred since 2000. 10/13 (77%) have occurred since 2000, including 7/13 (54%) have occurred since 2010. Only 1934, 1936, and 1988 had mean temperatures of 73° or above prior to 2000. Ongoing climate change is leading to an outcome where such summers are becoming the new "normal." Summer 2022 could join that list.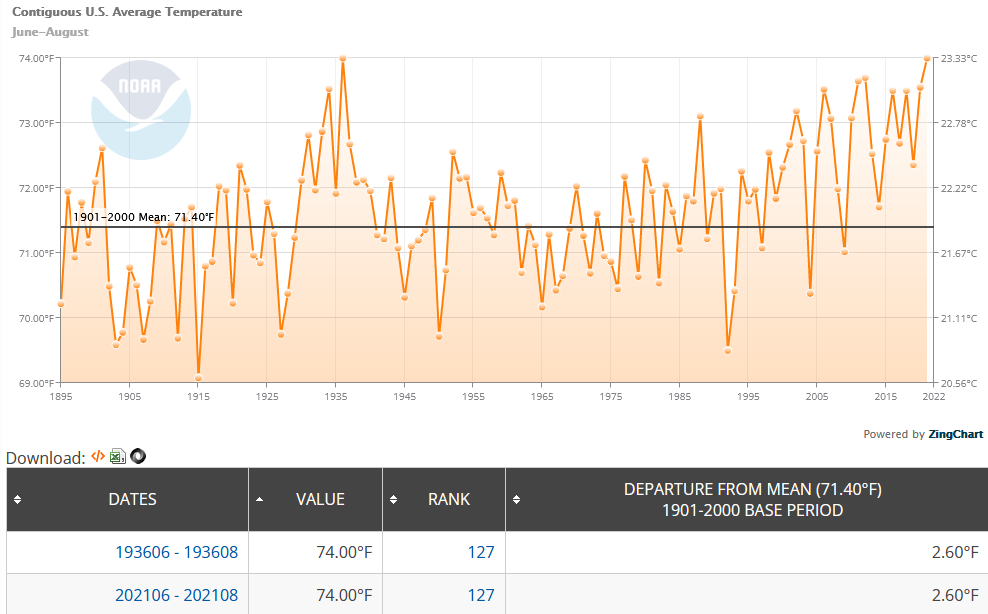
-
Morning thoughts… It will be partly sunny and warmer. High temperatures will reach the middle and upper 80s in most of the region. Likely high temperatures around the region include: New York City (Central Park): 84° Newark: 90° Philadelphia: 88° Warmer than normal readings will continue into the start of the weekend before cooler air returns on Sunday. Normals: New York City: 30-Year: 83.3°; 15-Year: 83.1° Newark: 30-Year: 84.6°; 15-Year: 84.8° Philadelphia: 30-Year: 85.8°; 15-Year: 85.5°
-
An offshore storm brought plenty of clouds to the region today. A few locations saw some drizzle or showers. Out West, Boise recorded its 20th 100° day of the year. That tied the record set in 2003. 9 of Boise's 10 warmest summers have occurred since 2000. Records go back to 1875. Salt Lake City further extended its annual record of 100° days to 23 days. Generally cooler than normal conditions will persist through tomorrow. Afterward, a warmup is likely, though no excessive heat will occur through at least the weekend. Much of the second half of August could see above to much above normal temperatures in the Pacific Northwest. The ECMWF seasonal forecast indicates that the summer will be warmer than normal throughout the region and across much of North America. Based on how the pattern has been evolving during the spring transition to summer, it is more likely than not that the warmest anomalies of the summer will likely occur in July and August with June being the coolest of the three months in the Northeast. In addition, in the 6 past cases when the June AO averaged +0.750 or above (1950-2021), 67% of the following August and September cases featured above normal temperatures. The August ECMWF forecast shows a warmer than normal September in the Northeast. This warmth would be consistent with the ongoing warming that has been occurring in September. The ENSO Region 1+2 anomaly was -0.5°C and the Region 3.4 anomaly was -1.1°C for the week centered around August 10. For the past six weeks, the ENSO Region 1+2 anomaly has averaged -0.90°C and the ENSO Region 3.4 anomaly has averaged -0.77°C. La Niña conditions will likely persist through the fall. The SOI was -6.74 today. The preliminary Arctic Oscillation (AO) was -1.036 today. On August 15 the MJO was in Phase 1 at an amplitude of 0.074 (RMM). The August 14-adjusted amplitude was 0.294 (RMM). Based on sensitivity analysis applied to the latest guidance, there is an implied 81% probability that New York City will have a warmer than normal August (1991-2020 normal). August will likely finish with a mean temperature near 78.0° (1.9° above normal).
-
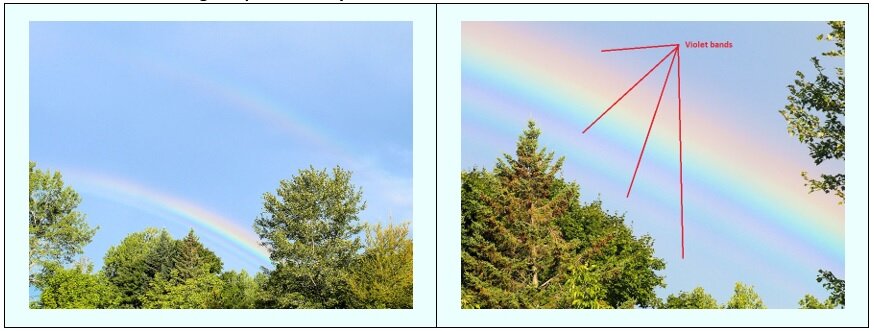
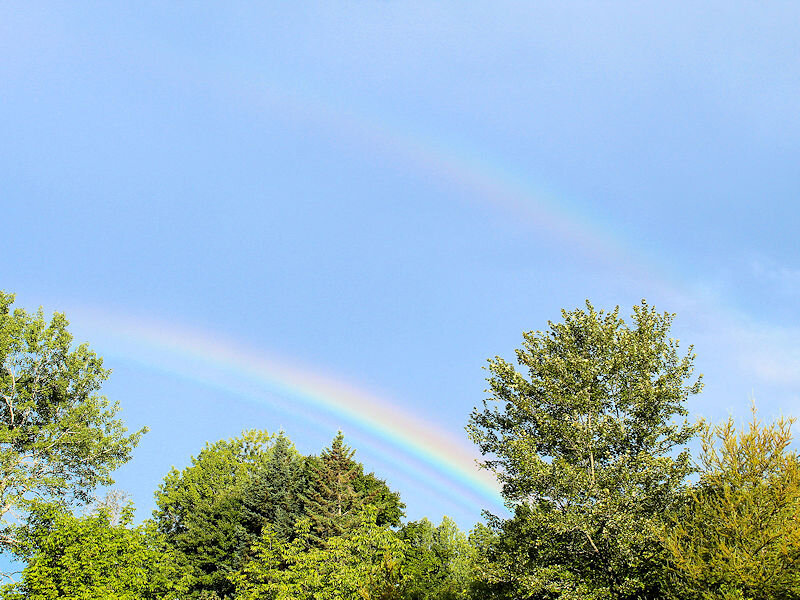
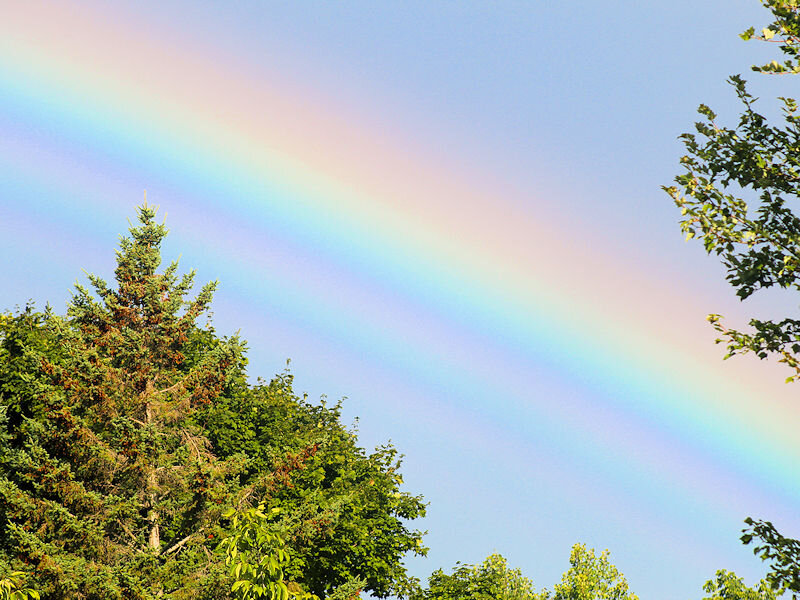
During a recent trip to Maine, I encountered a double rainbow. The lower rainbow was a supernumerary rainbow.
-
Morning thoughts… It will be variably cloudy and somewhat cooler than normal. A few places could see some showers. High temperatures will reach the upper 70s and lower 80s in most of the region. Likely high temperatures around the region include: New York City (Central Park): 79° Newark: 82° Philadelphia: 84° Cooler than normal conditions will persist through tomorrow before near normal and somewhat above normal temperatures return. Normals: New York City: 30-Year: 83.4°; 15-Year: 83.3° Newark: 30-Year: 84.7°; 15-Year: 85.0° Philadelphia: 30-Year: 85.9°; 15-Year: 85.7°
-
Today featured bright sunshine and pleasant temperatures in the lower and middle 80s. In the West, Salt Lake City recorded its 22nd 100° day. That broke the annual record of 21 days, which was set in 1960 and tied in 1994 and 2021. Generally cooler than normal conditions will persist through Thursday. Afterward, a warmup is likely, though no excessive heat will occur through at least the weekend. Much of the second half of August could see above to much above normal temperatures in the Pacific Northwest. The ECMWF seasonal forecast indicates that the summer will be warmer than normal throughout the region and across much of North America. Based on how the pattern has been evolving during the spring transition to summer, it is more likely than not that the warmest anomalies of the summer will likely occur in July and August with June being the coolest of the three months in the Northeast. In addition, in the 6 past cases when the June AO averaged +0.750 or above (1950-2021), 67% of the following August and September cases featured above normal temperatures. The August ECMWF forecast shows a warmer than normal September in the Northeast. The ENSO Region 1+2 anomaly was -0.5°C and the Region 3.4 anomaly was -1.1°C for the week centered around August 10. For the past six weeks, the ENSO Region 1+2 anomaly has averaged -0.90°C and the ENSO Region 3.4 anomaly has averaged -0.77°C. La Niña conditions will likely persist through the fall. The SOI was +9.04 today. The preliminary Arctic Oscillation (AO) was -1.291 today. On August 14 the MJO was in Phase 2 at an amplitude of 0.296 (RMM). The August 13-adjusted amplitude was 0.337 (RMM). Based on sensitivity analysis applied to the latest guidance, there is an implied 77% probability that New York City will have a warmer than normal August (1991-2020 normal). August will likely finish with a mean temperature near 77.8° (1.7° above normal).
-
Morning thoughts… It will be partly cloudy and somewhat cooler than normal. High temperatures will reach the lower and middle 80s in most of the region. Likely high temperatures around the region include: New York City (Central Park): 81° Newark: 85° Philadelphia: 83° Cooler than normal conditions will persist through Thursday before near normal and somewhat above normal temperatures return. Normals: New York City: 30-Year: 83.5°; 15-Year: 83.4° Newark: 30-Year: 84.9°; 15-Year: 85.1° Philadelphia: 30-Year: 86.0°; 15-Year: 85.8°
-
Rainbows at Stetson, ME on the morning of August 14 during a brief shower.
-
Generally cooler than normal conditions will persist through the week. Afterward, a warmup is likely, though no excessive heat will occur through at least the weekend. Much of the second half of August could see above to much above normal temperatures in the Pacific Northwest. The ECMWF seasonal forecast indicates that the summer will be warmer than normal throughout the region and across much of North America. Based on how the pattern has been evolving during the spring transition to summer, it is more likely than not that the warmest anomalies of the summer will likely occur in July and August with June being the coolest of the three months in the Northeast. In addition, in the 6 past cases when the June AO averaged +0.750 or above (1950-2021), 67% of the following August and September cases featured above normal temperatures. The August ECMWF forecast shows a warmer than normal September in the Northeast. The ENSO Region 1+2 anomaly was -0.5°C and the Region 3.4 anomaly was -1.1°C for the week centered around August 10. For the past six weeks, the ENSO Region 1+2 anomaly has averaged -0.90°C and the ENSO Region 3.4 anomaly has averaged -0.77°C. La Niña conditions will likely persist through the fall. The SOI was +13.96 today. The preliminary Arctic Oscillation (AO) was -1.021 today. On August 13 the MJO was in Phase 2 at an amplitude of 0.345 (RMM). The August 12-adjusted amplitude was 0.213 (RMM). Based on sensitivity analysis applied to the latest guidance, there is an implied 74% probability that New York City will have a warmer than normal August (1991-2020 normal). August will likely finish with a mean temperature near 77.7° (1.6° above normal).
-
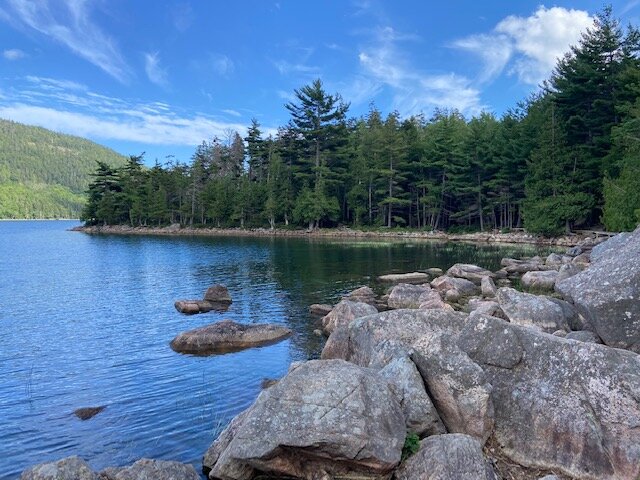
High temperatures in central Maine have been running similar to those in NYC during the past few days (upper 70s and lower 80s). Nights have been cooler (upper 50s and lower 60s). From Acadia National Park:
-
Seattle's Record Heatwave
donsutherland1 replied to donsutherland1's topic in Central/Western States
Seattle's annual number of 90° days is also rising. Through August 10, 2022, Seattle had 10 such days, which ranks as third highest.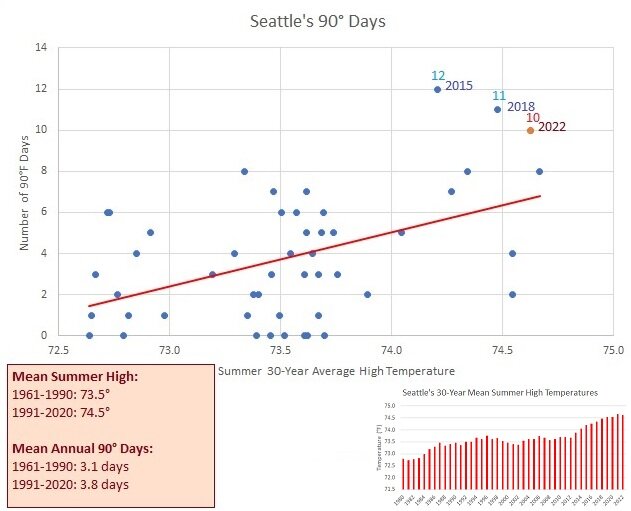
-
Morning thoughts… It will be partly cloudy and cooler. High temperatures will reach the middle and upper 80s in most of the region. Likely high temperatures around the region include: New York City (Central Park): 84° Newark: 89° Philadelphia: 90° Cooler than normal conditions will develop tomorrow and will likely persist through much of next week. Normals: New York City: 30-Year: 84.1°; 15-Year: 84.4° Newark: 30-Year: 85.5°; 15-Year: 86.1° Philadelphia: 30-Year: 86.5°; 15-Year: 86.7°
-
Mountain West Discussion
donsutherland1 replied to mayjawintastawm's topic in Central/Western States
Denver recorded its 26th 95F day of the year today. That tied 2018 for 4th highest number on record. Denver's warming summers have led to an increase in the number of such days and a recent development of cases with 25 or more such days.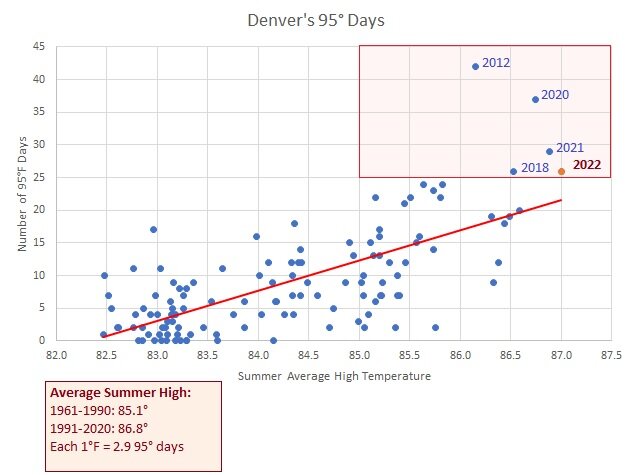
-
The heatwave that sent temperatures into the upper 90s into southern New England is now concluding. High temperatures today included: Allentown: 95° Atlantic City: 98° Baltimore: 97° Boston: 98° Bridgeport: 94° Concord: 91° Hartford: 95° Islip: 94° Manchester: 94° New York City-JFK: 93° New York City-LGA: 98° New York City-NYC: 97° Newark: 101° Philadelphia: 98° Poughkeepsie: 94° Providence: 98° Washington, DC: 97° Wilmington, DE: 97° Cooler air will begin to arrive overnight. Even cooler air will move into the region late in the week with the weekend featuring unseasonably cool weather. Outside of the Philadelphia and New York City urban areas, the potential exists for low temperatures to fall into the 50s at some locations. Across the Atlantic Ocean, parts of the UK, including London, could see another round of withering heat. Temperatures could top out near or above 95° on Thursday and Friday. The ECMWF seasonal forecast indicates that the summer will be warmer than normal throughout the region and across much of North America. Based on how the pattern has been evolving during the spring transition to summer, it is more likely than not that the warmest anomalies of the summer will likely occur in July and August with June being the coolest of the three months in the Northeast. In addition, in the 6 past cases when the June AO averaged +0.750 or above (1950-2021), 67% of the following August and September cases featured above normal temperatures. The August ECMWF forecast shows a warmer than normal September in the Northeast. The ENSO Region 1+2 anomaly was -0.6°C and the Region 3.4 anomaly was -1.0°C for the week centered around August 3. For the past six weeks, the ENSO Region 1+2 anomaly has averaged -1.05°C and the ENSO Region 3.4 anomaly has averaged -0.68°C. La Niña conditions will likely persist into the fall. The SOI was -0.67 today. The preliminary Arctic Oscillation (AO) was +0.675 today. On August 7 the MJO was in Phase 5 at an amplitude of 1.128 (RMM). The August 6-adjusted amplitude was 1.270 (RMM). Based on sensitivity analysis applied to the latest guidance, there is an implied 61% probability that New York City will have a warmer than normal August (1991-2020 normal). August will likely finish with a mean temperature near 77.3° (1.2° above normal).
-
Correct regarding 90- and 95-degree days.
-
That's an old map.
-
Morning thoughts… It will be partly cloudy and hot. Showers and thunderstorms are possible. High temperatures will reach the lower and middle 90s in most of the region. Likely high temperatures around the region include: New York City (Central Park): 93° Newark: 98° Philadelphia: 96° It will turn cooler starting tomorrow. Normals: New York City: 30-Year: 84.2°; 15-Year: 84.5° Newark: 30-Year: 85.6°; 15-Year: 86.3° Philadelphia: 30-Year: 86.6°; 15-Year: 86.9°
-
Probably.
-
Under mainly sunny skies, temperatures again rose into the 90s across the northern Middle Atlantic and southern New England areas. A few locations experienced cooling thundershowers. High temperatures included: Albany: 95° (tied record set in 1909 and tied in 1983) Allentown: 94° Atlantic City: 92° Baltimore: 94° Boston: 98° (old record: 96°, 1983) Bridgeport: 90° Concord: 96° (old record: 95°, 1870 and 2001) Hartford: 94° Manchester, NH: 99° (old record: 95°, 1949) New York City: 93° Newark: 99° Philadelphia: 97° Portland: 95° (tied record set in 1949) Poughkeepsie: 94° Providence: 95° (tied record set in 1909) Scranton: 94° (tied record set in 1918 and tied in 1930 and 2001) Washington, DC: 93° Wilmington, DE: 94° Worcester: 92° Boston recorded its 5th consecutive 95° day. That is tied for the second longest such streak with July 2-6, 1911. Tomorrow will see the conclusion of the current round of hot weather. Temperatures will reach the lower and middle 90s in many parts of the region. Showers and thundershowers are likely. Cooler air will begin to arrive by midweek. The weekend could feature unseasonably cool weather. Outside of the Philadelphia and New York City urban areas, the potential exists for low temperatures to fall into the 50s at some locations. Across the Atlantic Ocean, parts of the UK, including London, could see another round of withering heat. Temperatures could top out near or above 95° on Thursday and Friday. The ECMWF seasonal forecast indicates that the summer will be warmer than normal throughout the region and across much of North America. Based on how the pattern has been evolving during the spring transition to summer, it is more likely than not that the warmest anomalies of the summer will likely occur in July and August with June being the coolest of the three months in the Northeast. In addition, in the 6 past cases when the June AO averaged +0.750 or above (1950-2021), 67% of the following August and September cases featured above normal temperatures. The August ECMWF forecast shows a warmer than normal September in the Northeast. The ENSO Region 1+2 anomaly was -0.6°C and the Region 3.4 anomaly was -1.0°C for the week centered around August 3. For the past six weeks, the ENSO Region 1+2 anomaly has averaged -1.05°C and the ENSO Region 3.4 anomaly has averaged -0.68°C. La Niña conditions will likely persist into the fall. The SOI was +4.19 today. The preliminary Arctic Oscillation (AO) was +0.741 today. On August 6 the MJO was in Phase 5 at an amplitude of 1.270 (RMM). The August 5-adjusted amplitude was 1.211 (RMM). Based on sensitivity analysis applied to the latest guidance, there is an implied 62% probability that New York City will have a warmer than normal August (1991-2020 normal). August will likely finish with a mean temperature near 77.4° (1.3° above normal).
-
Yes. 1944 is first place. 1911 and 2022 share second place.
-
As of 1 PM EDT, Boston has a high temperature of 97. That breaks the daily record of 96 from 1983. It is also Boston’s 5th consecutive 95 or above reading, which is tied for second place with July 2-6, 1911.
-
Morning thoughts… It will be partly cloudy and hot. Scattered showers and thunderstorms are possible. High temperatures will reach the lower and middle 90s in most of the region. Likely high temperatures around the region include: New York City (Central Park): 91° Newark: 97° Philadelphia: 96° Cooler air will begin to arrive by midweek. Normals: New York City: 30-Year: 84.2°; 15-Year: 84.7° Newark: 30-Year: 85.7°; 15-Year: 86.4° Philadelphia: 30-Year: 86.7°; 15-Year: 87.0°
-
Under mainly sunny skies, temperatures again rose into the 90s across the northern Middle Atlantic and southern New England areas. Some places experienced cooling thundershowers. High temperatures included: Albany: 91° Allentown: 92° Atlantic City: 92° Baltimore: 93° Bangor: 93° Boston: 98° (tied record set in 1924) Bridgeport: 91° Burlington: 92° Caribou: 89° (tied record set in 1947 and tied in 2001) Concord: 93° Hartford: 96° Manchester, NH: 96° (tied record set in 2001) New York City: 92° Newark: 96° Philadelphia: 94° Portland: 96° (old record: 93°, 2001 and 2018) Providence: 95° (tied record set in 1931 and tied in 2001) Poughkeepsie: 97° (tied record set in 2001) Washington, DC: 90° Wilmington, DE: 93° Worcester: 93° Tomorrow and Tuesday will see a continuation of hot weather. Temperatures will reach the lower and middle 90s in many parts of the region. Cooler air will begin to arrive by midweek. The weekend could get off to a cool start. Across the Atlantic Ocean, parts of the UK, including London, could see another round of withering heat. Temperatures could top out near or above 95° on Thursday and Friday. The ECMWF seasonal forecast indicates that the summer will be warmer than normal throughout the region and across much of North America. Based on how the pattern has been evolving during the spring transition to summer, it is more likely than not that the warmest anomalies of the summer will likely occur in July and August with June being the coolest of the three months in the Northeast. In addition, in the 6 past cases when the June AO averaged +0.750 or above (1950-2021), 67% of the following August and September cases featured above normal temperatures. The August ECMWF forecast shows a warmer than normal September in the Northeast. The ENSO Region 1+2 anomaly was -0.9°C and the Region 3.4 anomaly was -0.7°C for the week centered around July 27. For the past six weeks, the ENSO Region 1+2 anomaly has averaged -1.18°C and the ENSO Region 3.4 anomaly has averaged -0.62°C. La Niña conditions will likely persist into the fall. The SOI was +14.38 today. The preliminary Arctic Oscillation (AO) was +1.051 today. On August 5 the MJO was in Phase 5 at an amplitude of 1.207 (RMM). The August 4-adjusted amplitude was 0.910 (RMM). Based on sensitivity analysis applied to the latest guidance, there is an implied 63% probability that New York City will have a warmer than normal August (1991-2020 normal). August will likely finish with a mean temperature near 77.5° (1.4° above normal).
-
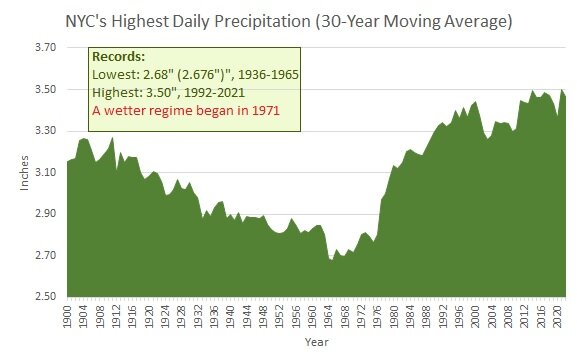
Through August 6th, New York City's highest daily precipitation is 1.85". If that holds, that would be the lowest figure since 2019 when the maximum daily amount was 1.83". Since New York City moved into a much wetter regime beginning in 1971, the maximum figure has generally been increasing. With potential tropical cyclone-enhanced moisture later this summer into the fall (assuming the EPS seasonal map's risk assessment is reasonably on course), the 1.85" figure could be washed away. Below is a chart showing the 30-year moving average for highest daily precipitation since 1900.