donsutherland1
-
Posts
23,765 -
Joined
Content Type
Profiles
Blogs
Forums
American Weather
Media Demo
Store
Gallery
Everything posted by donsutherland1
-
January 30th- Feb 1st ULL and coastal storm obs
donsutherland1 replied to JoshM's topic in Southeastern States
Sublimation. -
February 2026 OBS & Discussion
donsutherland1 replied to Stormlover74's topic in New York City Metro
Today, Islip recorded its third high < 20° this winter. That's the most such days since Winter 2017-18 when there were five such days. -
Yes. That’s correct.
-
Newark had a low of -8 on February 7, 1855.
-
January 30th- Feb 1st ULL and coastal storm obs
donsutherland1 replied to JoshM's topic in Southeastern States
Updated PNS: 083 NOUS42 KMHX 011814 PNSMHX NCZ029-044>047-079>081-090>092-094-193>196-198-199-203>205-020614- Public Information Statement National Weather Service Newport/Morehead City NC 114 PM EST Sun Feb 1 2026 ...Total SNOWFALL REPORTS Through Noon... Location Amount Time/Date Provider ...North Carolina... ...Beaufort County... 1 ESE Bath 17.0 in 1043 AM 02/01 Public 1 ESE Bayview 15.0 in 0947 AM 02/01 Public 3 S Old Ford 13.5 in 1015 AM 02/01 Public 3 E Belhaven 13.0 in 0939 AM 02/01 Public 1 NNW Belhaven 13.0 in 0947 AM 02/01 Public 4 N Cox Crossing 13.0 in 1133 AM 02/01 Public 2 SW Long Acre VFD 11.9 in 0900 AM 02/01 Trained Spotter 1 SW Washington 11.0 in 0850 AM 02/01 Public 3 SSE Blounts Creek 11.0 in 0943 AM 02/01 Public 5 SW Aurora 11.0 in 1000 AM 02/01 Fire Dept/Rescue ...Carteret County... 1 SE Peletier 19.5 in 1004 AM 02/01 Public Cedar Point 0.9 WSW 16.0 in 0500 AM 02/01 COCORAHS 2 ENE Broad Creek 16.0 in 0631 AM 02/01 Public 1 SW Newport 15.2 in 0700 AM 02/01 Official NWS Obs Otway 15.0 in 0827 AM 02/01 Public 1 WSW Broad Creek 15.0 in 0900 AM 02/01 NWS Employee Beaufort 15.0 in 0900 AM 02/01 Public 2 SSE Newport 14.5 in 0944 AM 02/01 Public 2 ESE Stella 14.2 in 1140 AM 02/01 NWS Employee 2 E Stella 14.0 in 1055 AM 02/01 Public 1 WNW Harkers Island 14.0 in 1123 AM 02/01 Public 1 SSE North River 14.0 in 1140 AM 02/01 Public Cape Carteret 1.5 NE 13.6 in 0700 AM 02/01 COOP Morehead City 13.0 in 0456 AM 02/01 Public Morehead City 2.9 WNW 13.0 in 0750 AM 02/01 COCORAHS 1 S Otway 13.0 in 0923 AM 02/01 Public 1 E Harkers Island 13.0 in 1020 AM 02/01 Trained Spotter Morehead City 5.7 W 12.5 in 0700 AM 02/01 COCORAHS Emerald Isle 2.1 E 10.0 in 0700 AM 02/01 COCORAHS 1 W Mitchell Village 10.0 in 0800 AM 02/01 Trained Spotter 1 W North River 10.0 in 0845 AM 02/01 NWS Employee Beaufort 3.8 N 8.5 in 0700 AM 02/01 COCORAHS ...Craven County... James City 2.5 S 18.0 in 0700 AM 02/01 COCORAHS 4 E James City 17.5 in 1104 AM 02/01 Public New Bern 7.3 ESE 17.0 in 0730 AM 02/01 COCORAHS 5 SSE Minnesott Beach 16.0 in 1049 AM 02/01 Public Trent Woods 1.2 ENE 15.5 in 0600 AM 02/01 COCORAHS 1 S New Bern 15.0 in 0918 AM 02/01 Public Bridgeton 14.2 in 0909 AM 02/01 Trained Spotter 1 ENE Trent Woods 14.0 in 0629 AM 02/01 Public 3 NNW Riverdale 14.0 in 0804 AM 02/01 Public Vanceboro 14.0 in 1120 AM 02/01 Public 1 SE Riverdale 13.5 in 0952 AM 02/01 Public 2 NNW Riverdale 13.5 in 1050 AM 02/01 Public New Bern 1.3 NNE 13.0 in 0700 AM 02/01 COCORAHS Trent Woods 1.3 WNW 13.0 in 0725 AM 02/01 COCORAHS 1 WNW Coastal Carolina Regio 12.5 in 0700 AM 02/01 COCORAHS Havelock 1.9 SSE 12.2 in 0800 AM 02/01 COCORAHS ...Dare County... 1 SSW Southern Shores 11.0 in 0730 AM 02/01 COCORAHS Duck 7.0 in 0730 AM 02/01 Trained Spotter 1 SSE Wright Brothers Nation 6.0 in 0929 AM 02/01 Trained Spotter Wanchese 2.8 in 0730 AM 02/01 COCORAHS Frisco 2.0 in 1140 AM 02/01 Public ...Duplin County... Beulaville 13.0 in 0700 AM 02/01 Broadcast Media Potters Hill 12.0 in 0823 AM 02/01 Public 1 WNW Albertson 12.0 in 0925 AM 02/01 Broadcast Media Potters Hill 12.0 in 0942 AM 02/01 Trained Spotter Wallace 14.8 E 11.0 in 0700 AM 02/01 COCORAHS Faison 3.3 SSE 11.0 in 0900 AM 02/01 COCORAHS 1 E Rose Hill 10.0 in 1044 AM 02/01 Public Rose Hill 10.0 in 1135 AM 02/01 Public Magnolia 7.0 in 0715 AM 02/01 Trained Spotter ...Hyde County... Scranton 5.6 SW 12.0 in 0700 AM 02/01 COCORAHS Sladesville 12.0 in 0957 AM 02/01 Trained Spotter Ocracoke 0.2 ESE 3.0 in 0800 AM 02/01 COCORAHS ...Jones County... Trenton 16.5 in 0706 AM 02/01 Public Trenton 15.0 in 0839 AM 02/01 Broadcast Media Wise Forks 13.0 in 0930 AM 02/01 Public ...Lenoir County... Pink Hill 16.0 in 0648 AM 02/01 Public Kinston 5.1 WNW 15.0 in 0700 AM 02/01 COCORAHS Kinston 14.0 in 0703 AM 02/01 Trained Spotter 4 ENE Sandy Bottom 13.5 in 0728 AM 02/01 Trained Spotter 1 NE Kinston 13.0 in 0820 AM 02/01 Kinston 4.6 ESE 11.5 in 0700 AM 02/01 COCORAHS La Grange 5.5 NE 10.5 in 0720 AM 02/01 COCORAHS Pink Hill 2.5 NE 10.0 in 0810 AM 02/01 COCORAHS ...Martin County... 3 W Williamston 13.0 in 0951 AM 02/01 Public Williamston 9.5 in 0741 AM 02/01 Public Williamston 8.9 SSE 6.5 in 0741 AM 02/01 COCORAHS ...Onslow County... Swansboro 17.0 in 0718 AM 02/01 Public 2 NW Hammocks Beach State Pa 16.0 in 0730 AM 02/01 Public 3 S Silverdale 16.0 in 0900 AM 02/01 NWS Employee Half Moon 14.0 in 0922 AM 02/01 Public 1 SSW Holly Ridge 13.0 in 0646 AM 02/01 Public 2 NW Midway Park 13.0 in 0720 AM 02/01 Public Jacksonville 3.3 W 13.0 in 0800 AM 02/01 COCORAHS 3 NW Half Moon 13.0 in 1021 AM 02/01 Public 1 S Camp Lejeune Center 13.0 in 1121 AM 02/01 Public Holly Ridge 3.7 E 12.5 in 0700 AM 02/01 COCORAHS Richlands 12.5 in 1119 AM 02/01 Public 4 SE Cypress Creek 12.5 in 1201 PM 02/01 Trained Spotter 2 SE Jacksonville 12.3 in 0630 AM 02/01 Trained Spotter 2 SSE Pumpkin Center 12.0 in 0907 AM 02/01 Trained Spotter Kellum 11.0 in 0700 AM 02/01 Trained Spotter ...Pamlico County... Reelsboro 19.0 in 0727 AM 02/01 Public Grantsboro 18.0 in 0639 AM 02/01 Public 1 SE Minnesott Beach 17.0 in 0631 AM 02/01 Public Bayboro 14.0 in 0728 AM 02/01 Public Bayboro 3 SW 13.0 in 0700 AM 02/01 COOP Merritt 1.5 WSW 13.0 in 0700 AM 02/01 COCORAHS ...Pitt County... 4 WSW Greenville 15.0 in 0830 AM 02/01 Public 4 WNW Falkland 14.0 in 0956 AM 02/01 Trained Spotter Grifton 13.5 in 0923 AM 02/01 Public 1 W Shelmerdine 12.5 in 0730 AM 02/01 Public 1 SE Winterville 12.2 in 0900 AM 02/01 Public 1 SE Winterville 12.1 in 0921 AM 02/01 Public Greenville 5.7 NW 12.0 in 0700 AM 02/01 COCORAHS 1 S Dowdy Ficklen Stadium 12.0 in 0729 AM 02/01 Public Farmville 0.8 ESE 11.7 in 0700 AM 02/01 COCORAHS 1 NNE Bell Arthur 11.5 in 0755 AM 02/01 Public 1 N Ayden 11.0 in 0912 AM 02/01 Greenville 5.0 SE 10.5 in 0800 AM 02/01 COCORAHS 2 N Winterville 10.0 in 1031 AM 02/01 Public 4 SE Winterville 9.0 in 0914 AM 02/01 Public 2 NNE Winterville 7.5 in 1025 AM 02/01 Trained Spotter ...Tyrrell County... Gum Neck (COOP) 16.1 in 0700 AM 02/01 COOP Columbia 4.9 W 11.0 in 0700 AM 02/01 COCORAHS 1 NNW Alligator 10.0 in 0554 AM 02/01 Public && -
February 2026 OBS & Discussion
donsutherland1 replied to Stormlover74's topic in New York City Metro
The January 24-February 1 period has had a mean temperature of 16.9°. That is the coldest nine-day period since December 30, 2017-January 7, 2018 when the nine-day average temperature was 16.6°. Temperatures should begin to moderate tomorrow through Wednesday. One or two days could briefly rise to or above freezing. A few flurries are possible on Wednesday as a weak system brings a cold front across the region. Colder air should return on Thursday. A even stronger surge of Arctic air could arrive for the weekend, possibly accompanied by some snow flurries or snow showers. Overall, January 20th-February 3rd will likely be the coldest and perhaps snowiest two-week period this winter. The forecast WPO-/EPO-/AO-/PNA+ pattern is typically the coldest pattern in January and among the coldest during the first half of February. A persistently positive PNA will have above climatological risk of moderate or significant snowfalls. For perspective, the coldest two-week period this winter prior to January 20th was January 3-16, 2026 and January 4-17, 2026 with a mean temperature of 30.3°. The snowiest two-week period was December 14-27, 2025 when 7.2" of snow fell. Already, snowfall since January 20th has surpassed that figure. The ENSO Region 1+2 anomaly was -0.3°C and the Region 3.4 anomaly was -0.7°C for the week centered around January 14. For the past six weeks, the ENSO Region 1+2 anomaly has averaged -0.48°C and the ENSO Region 3.4 anomaly has averaged -0.68°C. La Niña conditions will likely continue into at least late winter. The SOI was +26.51 today. The preliminary Arctic Oscillation (AO) was -2.273 today. -
January 30th- Feb 1st ULL and coastal storm obs
donsutherland1 replied to JoshM's topic in Southeastern States
The Airport also measured 0.5”. All in all, it was a nice outcome for Savannah. -
February 2026 OBS & Discussion
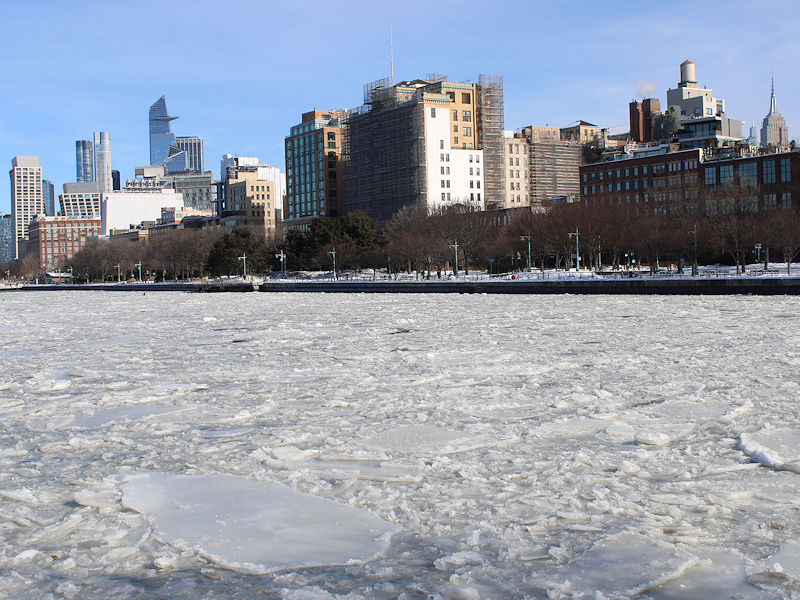
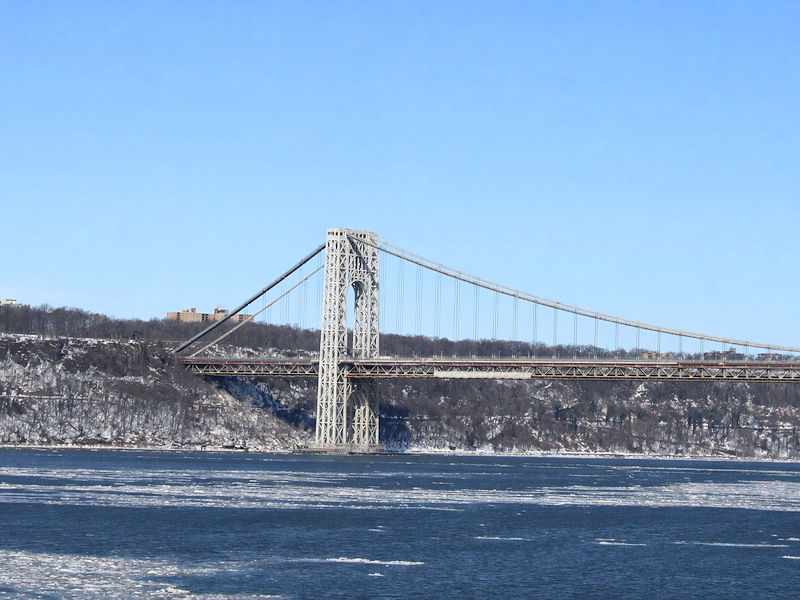
donsutherland1 replied to Stormlover74's topic in New York City Metro
Some photos of the Hudson River this morning. Note: I edited out the intrusive light posts from the Henry Hudson Parkway on the photo looking toward the George Washington Bridge.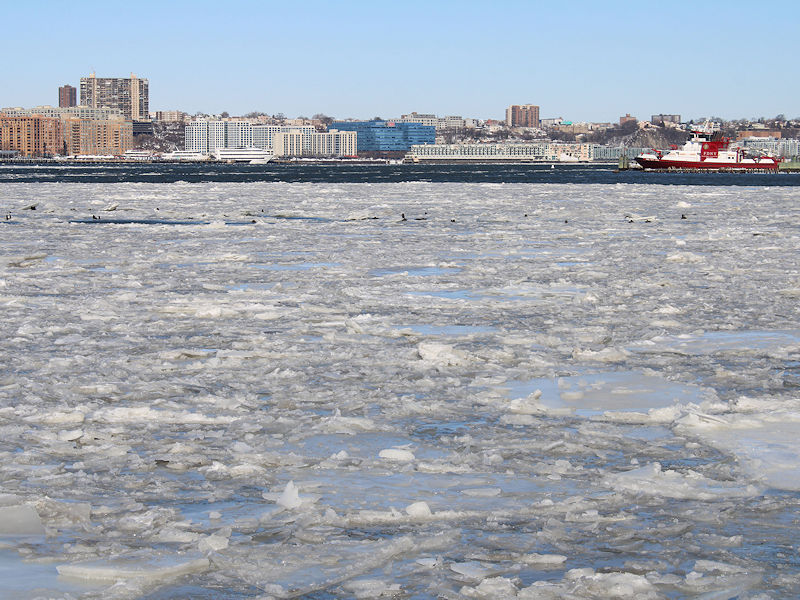
-
January 30th- Feb 1st ULL and coastal storm obs
donsutherland1 replied to JoshM's topic in Southeastern States
651 NOUS42 KILM 011754 PNSILM NCZ087-096-099-105>110-SCZ017-023-024-032-033-039-054>056-058-059-020554- Public Information Statement National Weather Service Wilmington NC 1254 PM EST Sun Feb 1 2026 ...SNOWFALL TOTALS FOR JANUARY 31 - FEBRUARY 1 WINTER STORM... Location Amount Time/Date Lat/Lon ...North Carolina... ...Bladen County... Bladenboro 9.0 in 0740 AM 02/01 34.54N/78.80W Jerome 6.0 in 1014 AM 02/01 34.83N/78.73W White Lake 6.0 in 0542 AM 02/01 34.64N/78.50W ...Brunswick County... Longwood 17.7 in 0730 AM 02/01 34.00N/78.55W Ocean Isle Beach 15.0 in 0540 AM 02/01 33.89N/78.43W 4 NE Calabash 14.6 in 0740 AM 02/01 33.94N/78.54W 2 NNE Calabash 13.8 in 0700 AM 02/01 33.92N/78.57W 1 NW Ocean Isle Beach 12.0 in 0443 AM 02/01 33.90N/78.45W 1 SW Holden Beach 10.0 in 0857 AM 02/01 33.91N/78.31W Bolivia 9.0 in 0859 AM 02/01 34.07N/78.15W Southport 9.0 in 0920 AM 02/01 33.93N/78.02W 4 ESE Supply 9.0 in 0800 AM 02/01 34.00N/78.21W Calabash 8.5 in 1000 AM 02/01 33.90N/78.58W 2 NE Oak Island 8.1 in 0700 AM 02/01 33.94N/78.14W Boiling Spring Lake 8.0 in 0855 AM 02/01 34.03N/78.07W 1 N Calabash 8.0 in 0856 AM 02/01 33.91N/78.58W Oak Island 8.0 in 0857 AM 02/01 33.92N/78.17W 3 N Varnamtown 8.0 in 0739 AM 02/01 33.98N/78.24W Shallotte 7.5 in 0931 AM 02/01 33.98N/78.39W 2 WNW Calabash 7.4 in 0700 AM 02/01 33.91N/78.61W Leland 7.0 in 0700 AM 02/01 34.24N/78.01W Winnabow 7.0 in 0730 AM 02/01 34.15N/78.10W 1 NE Southport 6.5 in 0700 AM 02/01 33.93N/78.01W 4 SSW Belville 6.0 in 0923 AM 02/01 34.18N/78.00W ...Columbus County... Tabor City 16.0 in 0900 AM 02/01 34.15N/78.87W Cerro Gordo 14.0 in 0557 AM 02/01 34.32N/78.93W Evergreen 12.0 in 0745 AM 02/01 34.42N/78.90W Nakina 11.0 in 1000 AM 02/01 34.13N/78.67W Chadbourn 10.0 in 0850 AM 02/01 34.32N/78.83W 2 N Whiteville 9.0 in 0800 AM 02/01 34.37N/78.71W ...New Hanover County... 1 WNW Seagate 9.5 in 0943 AM 02/01 34.21N/77.86W 1 N Carolina Beach 9.0 in 0910 AM 02/01 34.05N/77.90W 3 N Carolina Beach 9.0 in 1020 AM 02/01 34.08N/77.89W 1 ENE Bayshore 8.5 in 0910 AM 02/01 34.29N/77.77W 2 NE Windemere 8.5 in 1000 AM 02/01 34.26N/77.83W Bayshore 8.0 in 0718 AM 02/01 34.29N/77.79W Masonboro 7.6 in 0700 AM 02/01 34.17N/77.87W 1 NW Silver Lake 7.6 in 0807 AM 02/01 34.16N/77.93W 1 NNE Myrtle Grove 6.6 in 1000 AM 02/01 34.14N/77.87W 1 NE Bayshore 6.0 in 0900 AM 02/01 34.30N/77.78W Myrtle Grove 6.0 in 0854 AM 02/01 34.12N/77.89W Wrightsville Beach 6.0 in 0700 AM 02/01 34.21N/77.79W Wilmington 5.8 in 0800 AM 02/01 34.21N/77.91W 2 SSW Wilmington 5.5 in 0639 AM 02/01 34.19N/77.92W ...Pender County... 2 SW Maple Hill 12.5 in 0611 AM 02/01 34.65N/77.75W 2 NNW Hampstead 12.0 in 0430 AM 02/01 34.40N/77.71W 6 E Saint Helena 10.0 in 0800 AM 02/01 34.52N/77.81W Surf City 10.0 in 0500 AM 02/01 34.42N/77.56W Watha 9.2 in 0800 AM 02/01 34.64N/77.96W Burgaw 7.0 in 0930 AM 02/01 34.55N/77.93W 3 SSW Watha 6.5 in 0730 AM 02/01 34.60N/77.98W 3 NW Castle Hayne 5.1 in 0700 AM 02/01 34.38N/77.93W ...Robeson County... Fairmont 12.7 in 0700 AM 02/01 34.50N/79.12W 1 WSW Lumberton 10.0 in 0740 AM 02/01 34.63N/79.03W 1 WSW Lumberton 10.0 in 0741 AM 02/01 34.63N/79.02W 5 S Orrum 9.6 in 0830 AM 02/01 34.39N/79.00W Parkton 4.5 in 0830 AM 02/01 34.90N/79.01W ...South Carolina... ...Darlington County... 2 NE Clyde 6.0 in 0700 AM 02/01 34.40N/80.16W 5 NNE Timmonsville 5.0 in 0850 AM 02/01 34.21N/79.91W ...Dillon County... Lake View 12.0 in 0551 AM 02/01 34.34N/79.17W 2 ENE Dillon 9.2 in 0700 AM 02/01 34.43N/79.33W 1 SSW Little Rock 8.0 in 0700 AM 02/01 34.46N/79.41W ...Florence County... Florence 6.0 in 0545 AM 02/01 34.18N/79.78W Scranton 5.5 in 0700 AM 02/01 33.92N/79.74W 2 WSW Effingham 3.5 in 0500 AM 02/01 34.06N/79.79W ...Georgetown County... Pawleys Island 2.0 in 0820 AM 02/01 33.42N/79.13W 5 NNE Georgetown 1.4 in 0800 AM 02/01 33.43N/79.25W ...Horry County... 2 ENE Little River 8.0 in 1129 AM 02/01 33.89N/78.60W North Myrtle Beach 8.0 in 0548 AM 02/01 33.83N/78.67W Longs 7.7 in 0900 AM 02/01 33.93N/78.73W Aynor 7.5 in 1148 AM 02/01 34.00N/79.20W Bayboro 7.0 in 0900 AM 02/01 34.02N/79.02W Socastee 6.0 in 0850 AM 02/01 33.69N/79.01W 3 SE Longs 5.3 in 0700 AM 02/01 33.89N/78.69W Myrtle Beach 5.0 in 0700 AM 02/01 33.70N/78.89W 3 SSW Socastee 4.5 in 0800 AM 02/01 33.64N/79.03W 3 S Red Hill 2.9 in 0700 AM 02/01 33.75N/79.02W ...Marion County... 1 SSE Mullins 8.0 in 0740 AM 02/01 34.19N/79.25W Marion 5.0 in 0940 AM 02/01 34.18N/79.40W ...Marlboro County... Wallace 6.0 in 0109 AM 02/01 34.72N/79.84W && -
January 30th- Feb 1st ULL and coastal storm obs
donsutherland1 replied to JoshM's topic in Southeastern States
083 NOUS42 KMHX 011814 PNSMHX NCZ029-044>047-079>081-090>092-094-193>196-198-199-203>205-020614- Public Information Statement National Weather Service Newport/Morehead City NC 114 PM EST Sun Feb 1 2026 ...Total SNOWFALL REPORTS Through Noon... Location Amount Time/Date Provider ...North Carolina... ...Beaufort County... 1 ESE Bath 17.0 in 1043 AM 02/01 Public 1 ESE Bayview 15.0 in 0947 AM 02/01 Public 3 S Old Ford 13.5 in 1015 AM 02/01 Public 3 E Belhaven 13.0 in 0939 AM 02/01 Public 1 NNW Belhaven 13.0 in 0947 AM 02/01 Public 4 N Cox Crossing 13.0 in 1133 AM 02/01 Public 2 SW Long Acre VFD 11.9 in 0900 AM 02/01 Trained Spotter 1 SW Washington 11.0 in 0850 AM 02/01 Public 3 SSE Blounts Creek 11.0 in 0943 AM 02/01 Public 5 SW Aurora 11.0 in 1000 AM 02/01 Fire Dept/Rescue ...Carteret County... 1 SE Peletier 19.5 in 1004 AM 02/01 Public Cedar Point 0.9 WSW 16.0 in 0500 AM 02/01 COCORAHS 2 ENE Broad Creek 16.0 in 0631 AM 02/01 Public 1 SW Newport 15.2 in 0700 AM 02/01 Official NWS Obs Otway 15.0 in 0827 AM 02/01 Public 1 WSW Broad Creek 15.0 in 0900 AM 02/01 NWS Employee Beaufort 15.0 in 0900 AM 02/01 Public 2 SSE Newport 14.5 in 0944 AM 02/01 Public 2 ESE Stella 14.2 in 1140 AM 02/01 NWS Employee 2 E Stella 14.0 in 1055 AM 02/01 Public 1 WNW Harkers Island 14.0 in 1123 AM 02/01 Public 1 SSE North River 14.0 in 1140 AM 02/01 Public Cape Carteret 1.5 NE 13.6 in 0700 AM 02/01 COOP Morehead City 13.0 in 0456 AM 02/01 Public Morehead City 2.9 WNW 13.0 in 0750 AM 02/01 COCORAHS 1 S Otway 13.0 in 0923 AM 02/01 Public 1 E Harkers Island 13.0 in 1020 AM 02/01 Trained Spotter Morehead City 5.7 W 12.5 in 0700 AM 02/01 COCORAHS Emerald Isle 2.1 E 10.0 in 0700 AM 02/01 COCORAHS 1 W Mitchell Village 10.0 in 0800 AM 02/01 Trained Spotter 1 W North River 10.0 in 0845 AM 02/01 NWS Employee Beaufort 3.8 N 8.5 in 0700 AM 02/01 COCORAHS ...Craven County... James City 2.5 S 18.0 in 0700 AM 02/01 COCORAHS 4 E James City 17.5 in 1104 AM 02/01 Public New Bern 7.3 ESE 17.0 in 0730 AM 02/01 COCORAHS 5 SSE Minnesott Beach 16.0 in 1049 AM 02/01 Public Trent Woods 1.2 ENE 15.5 in 0600 AM 02/01 COCORAHS 1 S New Bern 15.0 in 0918 AM 02/01 Public Bridgeton 14.2 in 0909 AM 02/01 Trained Spotter 1 ENE Trent Woods 14.0 in 0629 AM 02/01 Public 3 NNW Riverdale 14.0 in 0804 AM 02/01 Public Vanceboro 14.0 in 1120 AM 02/01 Public 1 SE Riverdale 13.5 in 0952 AM 02/01 Public 2 NNW Riverdale 13.5 in 1050 AM 02/01 Public New Bern 1.3 NNE 13.0 in 0700 AM 02/01 COCORAHS Trent Woods 1.3 WNW 13.0 in 0725 AM 02/01 COCORAHS 1 WNW Coastal Carolina Regio 12.5 in 0700 AM 02/01 COCORAHS Havelock 1.9 SSE 12.2 in 0800 AM 02/01 COCORAHS ...Dare County... 1 SSW Southern Shores 11.0 in 0730 AM 02/01 COCORAHS Duck 7.0 in 0730 AM 02/01 Trained Spotter 1 SSE Wright Brothers Nation 6.0 in 0929 AM 02/01 Trained Spotter Wanchese 2.8 in 0730 AM 02/01 COCORAHS Frisco 2.0 in 1140 AM 02/01 Public ...Duplin County... Beulaville 13.0 in 0700 AM 02/01 Broadcast Media Potters Hill 12.0 in 0823 AM 02/01 Public 1 WNW Albertson 12.0 in 0925 AM 02/01 Broadcast Media Potters Hill 12.0 in 0942 AM 02/01 Trained Spotter Wallace 14.8 E 11.0 in 0700 AM 02/01 COCORAHS Faison 3.3 SSE 11.0 in 0900 AM 02/01 COCORAHS 1 E Rose Hill 10.0 in 1044 AM 02/01 Public Rose Hill 10.0 in 1135 AM 02/01 Public Magnolia 7.0 in 0715 AM 02/01 Trained Spotter ...Hyde County... Scranton 5.6 SW 12.0 in 0700 AM 02/01 COCORAHS Sladesville 12.0 in 0957 AM 02/01 Trained Spotter Ocracoke 0.2 ESE 3.0 in 0800 AM 02/01 COCORAHS ...Jones County... Trenton 16.5 in 0706 AM 02/01 Public Trenton 15.0 in 0839 AM 02/01 Broadcast Media Wise Forks 13.0 in 0930 AM 02/01 Public ...Lenoir County... Pink Hill 16.0 in 0648 AM 02/01 Public Kinston 5.1 WNW 15.0 in 0700 AM 02/01 COCORAHS Kinston 14.0 in 0703 AM 02/01 Trained Spotter 4 ENE Sandy Bottom 13.5 in 0728 AM 02/01 Trained Spotter 1 NE Kinston 13.0 in 0820 AM 02/01 Kinston 4.6 ESE 11.5 in 0700 AM 02/01 COCORAHS La Grange 5.5 NE 10.5 in 0720 AM 02/01 COCORAHS Pink Hill 2.5 NE 10.0 in 0810 AM 02/01 COCORAHS ...Martin County... 3 W Williamston 13.0 in 0951 AM 02/01 Public Williamston 9.5 in 0741 AM 02/01 Public Williamston 8.9 SSE 6.5 in 0741 AM 02/01 COCORAHS ...Onslow County... Swansboro 17.0 in 0718 AM 02/01 Public 2 NW Hammocks Beach State Pa 16.0 in 0730 AM 02/01 Public 3 S Silverdale 16.0 in 0900 AM 02/01 NWS Employee Half Moon 14.0 in 0922 AM 02/01 Public 1 SSW Holly Ridge 13.0 in 0646 AM 02/01 Public 2 NW Midway Park 13.0 in 0720 AM 02/01 Public Jacksonville 3.3 W 13.0 in 0800 AM 02/01 COCORAHS 3 NW Half Moon 13.0 in 1021 AM 02/01 Public 1 S Camp Lejeune Center 13.0 in 1121 AM 02/01 Public Holly Ridge 3.7 E 12.5 in 0700 AM 02/01 COCORAHS Richlands 12.5 in 1119 AM 02/01 Public 4 SE Cypress Creek 12.5 in 1201 PM 02/01 Trained Spotter 2 SE Jacksonville 12.3 in 0630 AM 02/01 Trained Spotter 2 SSE Pumpkin Center 12.0 in 0907 AM 02/01 Trained Spotter Kellum 11.0 in 0700 AM 02/01 Trained Spotter ...Pamlico County... Reelsboro 19.0 in 0727 AM 02/01 Public Grantsboro 18.0 in 0639 AM 02/01 Public 1 SE Minnesott Beach 17.0 in 0631 AM 02/01 Public Bayboro 14.0 in 0728 AM 02/01 Public Bayboro 3 SW 13.0 in 0700 AM 02/01 COOP Merritt 1.5 WSW 13.0 in 0700 AM 02/01 COCORAHS ...Pitt County... 4 WSW Greenville 15.0 in 0830 AM 02/01 Public 4 WNW Falkland 14.0 in 0956 AM 02/01 Trained Spotter Grifton 13.5 in 0923 AM 02/01 Public 1 W Shelmerdine 12.5 in 0730 AM 02/01 Public 1 SE Winterville 12.2 in 0900 AM 02/01 Public 1 SE Winterville 12.1 in 0921 AM 02/01 Public Greenville 5.7 NW 12.0 in 0700 AM 02/01 COCORAHS 1 S Dowdy Ficklen Stadium 12.0 in 0729 AM 02/01 Public Farmville 0.8 ESE 11.7 in 0700 AM 02/01 COCORAHS 1 NNE Bell Arthur 11.5 in 0755 AM 02/01 Public 1 N Ayden 11.0 in 0912 AM 02/01 Greenville 5.0 SE 10.5 in 0800 AM 02/01 COCORAHS 2 N Winterville 10.0 in 1031 AM 02/01 Public 4 SE Winterville 9.0 in 0914 AM 02/01 Public 2 NNE Winterville 7.5 in 1025 AM 02/01 Trained Spotter ...Tyrrell County... Gum Neck (COOP) 16.1 in 0700 AM 02/01 COOP Columbia 4.9 W 11.0 in 0700 AM 02/01 COCORAHS 1 NNW Alligator 10.0 in 0554 AM 02/01 Public && -
January 30th- Feb 1st ULL and coastal storm obs
donsutherland1 replied to JoshM's topic in Southeastern States
There was no recent data. I will check when I get home in about an hour. -
January 30th- Feb 1st ULL and coastal storm obs
donsutherland1 replied to JoshM's topic in Southeastern States
162 NOUS42 KILM 011137 PNSILM NCZ087-096-099-105>110-SCZ017-023-024-032-033-039-053>056-012337- Public Information Statement Spotter Reports National Weather Service Wilmington NC 637 AM EST Sun Feb 01 2026 The following are unofficial observations taken during the past 6 hours for the storm that has been affecting our region. Appreciation is extended to highway departments, cooperative observers, Skywarn spotters and media for these reports. This summary also is available on our home page at weather.gov/ilm ***********STORM TOTAL SNOWFALL (AT LEAST 2 INCH)*********** LOCATION TOTAL TIME/DATE COMMENTS SNOWFALL MEASURED (inches) NORTH CAROLINA ...Bladen County... White Lake 6.0 542 AM 2/01 Public 5 E Tar Heel 5.0 428 AM 2/01 White Oak ...Brunswick County... Ocean Isle Beach 15.0 540 AM 2/01 Public Longwood 14.0 515 AM 2/01 Public 1 NW Ocean Isle Beac 12.0 443 AM 2/01 Public Calabash 8.5 1241 AM 2/01 Public Southport 8.0 544 AM 2/01 Public Bolivia 6.0 115 AM 2/01 Public Leland 5.0 521 AM 2/01 Public ...Columbus County... Cerro Gordo 14.0 557 AM 2/01 Public Tabor City 14.0 522 AM 2/01 Public Whiteville 11.0 200 AM 2/01 Public Clarendon 8.5 1248 AM 2/01 Public Evergreen 7.0 1241 AM 2/01 Public 5 W Lake Waccamaw 6.5 1239 AM 2/01 Hallsboro 2 NW Whiteville 6.0 1239 AM 2/01 Public ...New Hanover County... 1 ESE Wrightsboro 3.4 100 AM 2/01 NWS Wilmington ...Pender County... 2 NNW Hampstead 12.0 430 AM 2/01 Castle Bay Hampstead 11.0 330 AM 2/01 Public 2 NNW Topsail Beach 9.5 118 AM 2/01 NWS Employee ...Robeson County... Lumberton 12.0 550 AM 2/01 Public 4 SE Lumberton 10.5 202 AM 2/01 Public 7 NE Orrum 9.0 121 AM 2/01 Burnt Islands community Fairmont 9.0 212 AM 2/01 Public Orrum 8.0 123 AM 2/01 Public Pembroke 7.5 215 AM 2/01 Public SOUTH CAROLINA ...Darlington County... North Hartsville 7.0 149 AM 2/01 Public ...Dillon County... Lake View 12.0 555 AM 2/01 Public 3 SW Little Rock 7.0 115 AM 2/01 Public Dillon 7.0 201 AM 2/01 Public 2 SSW South Of The B 5.0 113 AM 2/01 Hamer community ...Florence County... 2 W Florence 8.0 256 AM 2/01 Public Florence 6.0 606 AM 2/01 Public ...Georgetown County... Murrells Inlet 5.5 300 AM 2/01 Public ...Horry County... North Myrtle Beach 8.0 548 AM 2/01 Public Loris 7.0 320 AM 2/01 Public Little River 5.5 208 AM 2/01 Public Conway 5.0 1253 AM 2/01 Public Galivants Ferry 5.0 131 AM 2/01 Public 3 SW Myrtle Beach 5.0 209 AM 2/01 Market Common Surfside Beach 2.5 118 AM 2/01 Public ...Marlboro County... Wallace 6.0 109 AM 2/01 Public 1 SSE Brownsville 4.0 1258 AM 2/01 Public ...Williamsburg County... Greeleyville 3.0 138 AM 2/01 Public 10 E Trio 3.0 232 AM 2/01 Warsaw community && -
January 30th- Feb 1st ULL and coastal storm obs
donsutherland1 replied to JoshM's topic in Southeastern States
120 NOUS42 KRAH 011048 PNSRAH NCZ007>011-021>028-038>043-073>078-083>086-088-089-012248- Public Information Statement National Weather Service Raleigh NC 548 AM EST Sun Feb 1 2026 ...SNOWFALL REPORTS FROM SATURDAY THROUGH EARLY SUNDAY MORNING... Location Amount Time/Date Provider ...Alamance County... 2 WNW Glen Raven 7.0 in 0911 PM 01/31 2 NNE Burlington 6.5 in 0230 AM 02/01 Public Glen Raven 6.0 in 0815 PM 01/31 1 NW Graham 6.0 in 1045 PM 01/31 Public 2 WNW Glen Raven 5.5 in 0604 PM 01/31 4 SSW Mebane 5.1 in 1044 PM 01/31 Public ...Anson County... Wadesboro 5.5 in 1200 AM 02/01 Public ...Chatham County... Siler City 8.0 in 0100 AM 02/01 Public 1 N Siler City 6.0 in 1130 PM 01/31 Public Goldston 5.0 in 1145 PM 01/31 Public 3 WSW Carpenter 2.8 in 0954 PM 01/31 Public ...Cumberland County... 1 SE Bonnie Doone 5.0 in 0311 AM 02/01 3 SSW Fayetteville 4.5 in 0453 AM 02/01 1 SE Fayetteville 3.5 in 0100 AM 02/01 Public 1 SE Bonnie Doone 3.4 in 1239 AM 02/01 2 S Fayetteville 3.2 in 1215 AM 02/01 Cocorahs Spring Lake 2.0 in 1100 PM 01/31 Public ...Davidson County... Lexington 16.0 in 0940 PM 01/31 Public 5 NNW High Rock 16.0 in 1115 PM 01/31 Public 5 SW Lexington 16.0 in 1130 PM 01/31 Public 5 SSW Thomasville 15.5 in 0730 PM 01/31 Denton 14.0 in 0820 PM 01/31 Public 2 S Thomasville 13.8 in 1104 PM 01/31 ...Durham County... 1 NE Rougemont 6.2 in 1049 PM 01/31 1 NE Rougemont 4.5 in 0752 PM 01/31 3 N Durham 4.0 in 0815 PM 01/31 Public 6 WNW Gorman 2.7 in 0906 PM 01/31 Public 2 N Durham 2.5 in 0930 PM 01/31 2 NNE Research Triangle 2.0 in 1103 PM 01/31 ...Edgecombe County... 1 NW Princeville 10.0 in 0100 AM 02/01 Public 1 NW Princeville 10.0 in 0200 AM 02/01 Public 2 ENE Rocky Mount 7.0 in 0830 PM 01/31 Public ...Forsyth County... 4 S Winston-Salem 11.0 in 0731 PM 01/31 1 N Winston-Salem 10.0 in 0745 PM 01/31 Broadcast Media 3 S Clemmons 9.0 in 0850 PM 01/31 4 ENE Stanleyville 9.0 in 1000 PM 01/31 Trained Spotter 3 E Stanleyville 9.0 in 1139 PM 01/31 3 E Walkertown 8.5 in 1153 PM 01/31 2 S Winston-Salem 7.5 in 0630 PM 01/31 3 SSW Winston-Salem 7.5 in 1012 PM 01/31 ...Franklin County... 2 NE Purnell 4.5 in 1155 PM 01/31 3 NE Youngsville 3.5 in 1055 PM 01/31 Trained Spotter ...Granville County... Oxford 6.0 in 0100 AM 02/01 Public Stovall 5.5 in 1045 PM 01/31 Public Oxford 5.0 in 1000 PM 01/31 Public 1 WNW Berea 4.0 in 1030 PM 01/31 Public Creedmoor 3.0 in 1100 PM 01/31 Public 1 NW Butner 3.0 in 1150 PM 01/31 Trained Spotter ...Guilford County... Jamestown 13.0 in 1110 PM 01/31 Public 2 SW High Point 12.8 in 0717 PM 01/31 4 NNW Jamestown 11.7 in 1130 PM 01/31 Broadcast Media 2 NNW Archdale 11.5 in 0945 PM 01/31 Broadcast Media Jamestown 11.3 in 0915 PM 01/31 Public 1 NNW Colfax 11.0 in 1030 PM 01/31 3 S Greensboro 10.9 in 1042 PM 01/31 null Piedmont Triad Interna 10.4 in 0500 AM 02/01 Official NWS Obs 2 NW Greensboro 10.0 in 0958 PM 01/31 2 NW Greensboro 9.5 in 0730 PM 01/31 2 ENE Stokesdale 9.0 in 0500 PM 01/31 Public 2 WNW Monticello 9.0 in 1049 PM 01/31 ...Halifax County... Scotland Neck 6.0 in 1030 PM 01/31 Public Enfield 5.5 in 1215 AM 02/01 Public 8 W Halifax 4.3 in 1020 PM 01/31 Public Roanoke Rapids 4.0 in 0930 PM 01/31 Public ...Harnett County... 4 SW Angier 3.5 in 0245 AM 02/01 Public 2 SSW Benson 2.0 in 1141 PM 01/31 1 ENE Buies Creek 2.0 in 0215 AM 02/01 Public 2 SSW Benson 1.0 in 1004 PM 01/31 ...Hoke County... 3 NNW Rockfish 6.0 in 0539 AM 02/01 Public 2 E Raeford 5.0 in 0141 AM 02/01 3 WSW Silver City 3.5 in 0846 PM 01/31 Raeford 3.0 in 1055 PM 01/31 Public ...Johnston County... Smithfield 6.0 in 1030 PM 01/31 Public Smithfield 6.0 in 1053 PM 01/31 3 N Flowers 5.0 in 1040 PM 01/31 3 ESE Clayton 4.5 in 1005 PM 01/31 NWS Employee Middlesex 4.1 SSW 4.5 in 1159 PM 01/31 COCORAHS Emit 4.0 in 0935 PM 01/31 Public ...Lee County... Sanford 5.0 in 0815 PM 01/31 Public 1 NNW Cumnock 4.0 in 0322 AM 02/01 ...Montgomery County... Badin Lake 8.8 in 1255 AM 02/01 Public 4 SE Eldorado 7.5 in 1245 AM 02/01 Public 5 NNE Norwood 6.0 in 0726 PM 01/31 3 SSW Biscoe 5.5 in 0407 AM 02/01 ...Moore County... 1 NW Pinehurst 7.5 in 0430 AM 02/01 Public 4 NNW Robbins 7.0 in 1212 AM 02/01 Pinebluff 7.0 in 1250 AM 02/01 Public Southern Pines 5.0 in 1000 PM 01/31 Public Seven Lakes 4.5 in 1015 PM 01/31 Trained Spotter 1 NW Pinehurst 4.5 in 1100 PM 01/31 Public 1 NNE Taylortown 4.0 in 0803 PM 01/31 ...Nash County... 3 SW Rocky Mount 6.0 in 0800 PM 01/31 Broadcast Media Red Oak 5.0 in 0940 PM 01/31 Public Battleboro 5.0 in 1100 PM 01/31 Public ...Orange County... 5 ESE Carr 6.0 in 0100 AM 02/01 Public 5 SW Rougemont 4.0 in 0924 PM 01/31 5 SSE Efland 4.0 in 1159 PM 01/31 Hillsborough 3.5 in 0935 PM 01/31 Public 5 SSE Efland 3.5 in 1005 PM 01/31 1 SW Chapel Hill 3.3 in 0940 PM 01/31 Public Chapel Hill 3.2 in 0930 PM 01/31 Public 2 NW Chapel Hill 3.2 in 0932 PM 01/31 ...Person County... Roxboro 6.5 in 1000 PM 01/31 Public 1 SW Roxboro 6.5 in 1045 PM 01/31 Public 3 NW Roxboro 6.5 in 1100 PM 01/31 Public ...Randolph County... 2 WSW Trinity 12.6 in 0658 PM 01/31 Randleman 10.5 in 0945 PM 01/31 Public 1 S Asheboro 10.0 in 1200 AM 02/01 Public 5 WSW Asheboro 9.0 in 1030 PM 01/31 Cocorahs ...Richmond County... Ellerbe 6.0 in 1010 PM 01/31 Public Rockingham 5.0 in 0945 PM 01/31 Public ...Sampson County... 5 E Falcon 4.0 in 1245 AM 02/01 Public Newton Grove 2.0 in 1100 PM 01/31 Public ...Scotland County... 2 NNW East Laurinburg 6.0 in 1215 AM 02/01 Public ...Stanly County... Locust 10.0 in 0940 PM 01/31 Public 2 ENE Finger 10.0 in 0302 AM 02/01 Public Stanfield 9.0 in 1000 PM 01/31 Public Badin 9.0 in 1115 PM 01/31 Public Norwood 7.0 in 1000 PM 01/31 Public Albemarle 7.0 in 1000 PM 01/31 Public ...Vance County... 6 N Dabney 5.0 in 1210 AM 02/01 Public Henderson 4 NNE 3.0 in 0945 PM 01/31 COOP ...Wake County... Knightdale 5.0 in 0100 AM 02/01 Public Rolesville 4.7 in 1035 PM 01/31 Public Knightdale 4.5 in 1035 PM 01/31 Public 2 NW Rolesville 4.5 in 1115 PM 01/31 7 SE Gorman 4.3 in 0230 AM 02/01 Cocorahs 2 S Youngsville 3.9 in 1200 AM 02/01 Cocorahs Wendell 3.5 in 1044 PM 01/31 Public Wake Forest 3.0 in 0830 PM 01/31 Public 1 NNW Rdu International 2.9 in 0500 AM 02/01 Official NWS Obs 2 NW Raleigh 2.5 in 0955 PM 01/31 Public 3 WSW Garner 2.4 in 1045 PM 01/31 4 SSW Raleigh 2.3 in 0500 AM 02/01 Official NWS Obs 4 S Lake Wheeler 2.2 in 0150 AM 02/01 NWS Employee 1 NNE Cary 2.0 in 1150 PM 01/31 2 WSW Holly Springs 2.0 in 0245 AM 02/01 NWS Employee 2 SSW Cary 2.0 in 0450 AM 02/01 4 NNE Lake Wheeler 1.8 in 1115 PM 01/31 5 N Lake Wheeler 1.8 in 0124 AM 02/01 4 SW Rolesville 1.5 in 0845 PM 01/31 Trained Spotter 1 NNW Garner 1.5 in 1210 AM 02/01 Public 3 E Lake Wheeler 1.3 in 1145 PM 01/31 NWS Employee ...Warren County... Norlina 4.0 in 0100 AM 02/01 Public ...Wayne County... 1 SSW Elroy 7.5 in 1000 PM 01/31 Public Goldsboro 5.5 in 0700 PM 01/31 Public Seven Springs 5.5 in 0900 PM 01/31 Public Mar-Mac 4.5 in 0830 PM 01/31 Public ...Wilson County... 2 ESE New Hope 10.0 in 1141 PM 01/31 2 ESE New Hope 8.5 in 1001 PM 01/31 2 NNE Wilson 8.0 in 0200 AM 02/01 Public 2 ESE New Hope 6.0 in 0851 PM 01/31 2 ESE New Hope 6.0 in 0953 PM 01/31 Trained Spotter 2 SW Wilson 5.5 in 0940 PM 01/31 Public 2 ESE New Hope 5.0 in 0815 PM 01/31 New Hope 4.0 in 0745 PM 01/31 Trained Spotter && -
February 2026 OBS & Discussion
donsutherland1 replied to Stormlover74's topic in New York City Metro
There were a few flurries in Larchmont, NY. -
January 30th- Feb 1st ULL and coastal storm obs
donsutherland1 replied to JoshM's topic in Southeastern States
Yes. There were numerous 12” or above amounts. -
January 30th- Feb 1st ULL and coastal storm obs
donsutherland1 replied to JoshM's topic in Southeastern States
Charlotte picked up 11.0” of snow yesterday. That tied December 29, 1880 for the fourth highest daily figure on record.- 937 replies
-
- 10
-

-
January 30th- Feb 1st ULL and coastal storm obs
donsutherland1 replied to JoshM's topic in Southeastern States
So far, Lexington, NC in Davidson County has picked up 16.0" of snow. 5 SW Thomasville, also in Davidson County, has 15.5". -
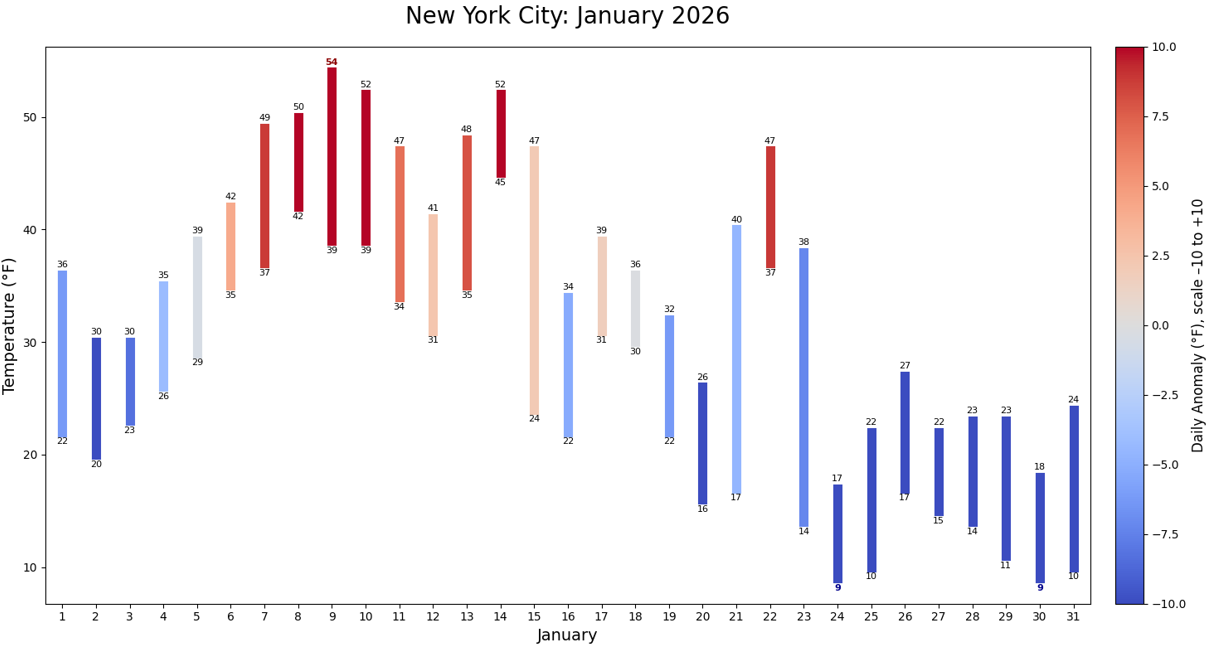
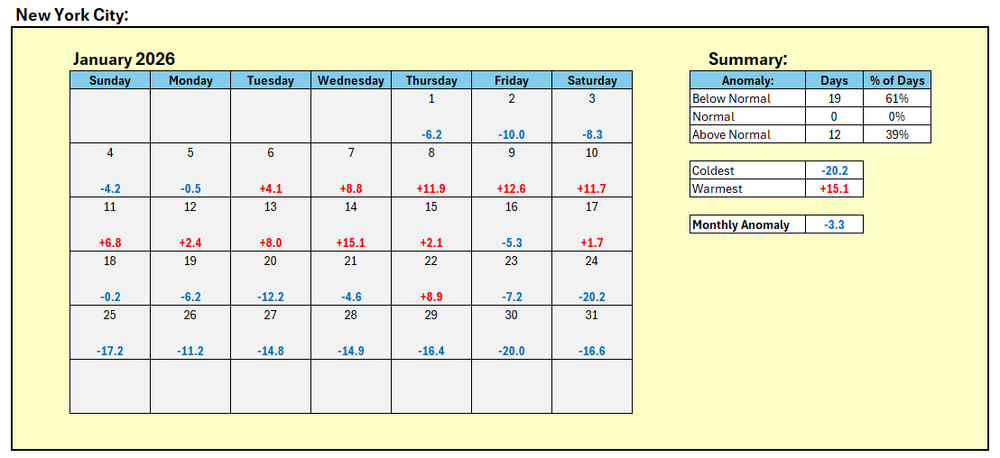
January finished with a mean temperature of 30.4° (3.3° below normal) in New York City's Central Park.

-
February 2026 OBS & Discussion
donsutherland1 replied to Stormlover74's topic in New York City Metro
Today is NYC's 8th consecutive subfreezing day. -
There should certainly be opportunities.
-
It's fading and will continue to fade during February. There will likely be above normal tornado activity during March-May.
-
January 30th- Feb 1st ULL and coastal storm obs
donsutherland1 replied to JoshM's topic in Southeastern States
8" or Above Snowfall Amounts: Location State Amount Source 5 NNE Faust NC 14.5 Public 1 SW Kannapolis NC 12.5 Trained Spotter Rockwell NC 12.0 Public Faith NC 12.0 Public 6 ENE Huntersville NC 12.0 Public China Grove NC 11.5 Fire Dept/Rescue Sylva NC 11.0 Public 4 NNW Craven NC 11.0 Public 1 W Concord NC 11.0 Public 5 W Salisbury NC 10.0 Trained Spotter 3 WNW Sunburst NC 10.0 Public 2 NNE Sylva NC 10.0 Public 2 E Kannapolis NC 10.0 Public 1 E Concord NC 10.0 CO-OP Observer 4 E Huntersville NC 9.5 Public 2 W Paw Creek NC 9.5 Public 1 ENE Mooresville NC 9.5 Public Tuckasegee NC 9.0 Public Salisbury NC 9.0 Public Elk Park NC 9.0 Public Davidson NC 9.0 Public Balsam NC 9.0 Public 5 NE Croft NC 9.0 Public 4 ENE Paw Creek NC 9.0 Trained Spotter 3 SSW Cherokee NC 9.0 Public 2 S Maggie Valley NC 9.0 Public 3 SSW Candler NC 8.7 Public Marshall NC 8.5 Public 3 SW Kannapolis NC 8.3 Public 3 WSW Woodfin NC 8.2 Public 3 NW Mooresville NC 8.2 Public Troutman NC 8.0 Public Marion NC 8.0 Public Maiden NC 8.0 Fire Dept/Rescue Clyde NC 8.0 Public Bryson City NC 8.0 Public Boiling Springs Nc NC 8.0 Public Belmont NC 8.0 Public 4 NNE Maggie Valley NC 8.0 Public 4 N Eastanolee GA 8.0 Public 3 NNE Cullowhee NC 8.0 Public 2 WNW High Shoals NC 8.0 Trained Spotter 2 WNW Concord NC 8.0 Public 2 WNW Balsam NC 8.0 Public 2 ESE Sunburst NC 8.0 Public 1 WNW Clayton GA 8.0 Broadcast Media 1 W Broad Creek NC 8.0 Public 1 SW Newport NC 8.0 NWS Employee 1 ESE Mount Holly NC 8.0 Public -
January 30th- Feb 1st ULL and coastal storm obs
donsutherland1 replied to JoshM's topic in Southeastern States
Yes. It could be a top 5 or bigger snowstorm. -
January 30th- Feb 1st ULL and coastal storm obs
donsutherland1 replied to JoshM's topic in Southeastern States
As of 4 pm, Charlotte, NC has picked up 6.1" of snow. That breaks the daily record for January 31 of 0.9" from 1948. That makes the current storm Charlotte's biggest since February 11-13, 2014 when 8.4" fell. Charlotte could see its first 10" or above snowstorm since February 26-27, 2004. The daily snowfall of 6.1" is Charlotte's biggest daily snowfall since February 26, 2004 when 11.6" accumulated. The snow continues to fall heavily as of 5:15 pm. -
January is concluding with a monthly mean temperature of 30.4° (3.3° below the 1991-2020 baseline and 2.2° below the 1981-2010 baseline). January 2026 is the coldest month since January 2022 when the monthly average temperature was 30.3°. The January 24-31 period has had a mean temperature of 16.9°. That is the coldest eight-day period since December 31, 2017-January 7, 2018 when the eight-day average temperature was 16.4°. Temperatures should begin to moderate tomorrow into early next week and could briefly rise to or above freezing. Nevertheless, readings are likely to remain below normal into at least next weekend. Overall, January 20th-February 3rd will likely be the coldest and perhaps snowiest two-week period this winter. The forecast WPO-/EPO-/AO-/PNA+ pattern is typically the coldest pattern in January and among the coldest during the first half of February. A persistently positive PNA will have above climatological risk of moderate or significant snowfalls. For perspective, the coldest two-week period this winter prior to January 20th was January 3-16, 2026 and January 4-17, 2026 with a mean temperature of 30.3°. The snowiest two-week period was December 14-27, 2025 when 7.2" of snow fell. Already, snowfall since January 20th has surpassed that figure. The ENSO Region 1+2 anomaly was -0.3°C and the Region 3.4 anomaly was -0.7°C for the week centered around January 14. For the past six weeks, the ENSO Region 1+2 anomaly has averaged -0.48°C and the ENSO Region 3.4 anomaly has averaged -0.68°C. La Niña conditions will likely continue into at least late winter. The SOI was +19.18 today. The preliminary Arctic Oscillation (AO) was -2.880 today.