michsnowfreak
-
Posts
18,418 -
Joined
-
Last visited
Content Type
Profiles
Blogs
Forums
American Weather
Media Demo
Store
Gallery
Everything posted by michsnowfreak
-

2026-2027 Super El Nino
michsnowfreak replied to Stormchaserchuck1's topic in Weather Forecasting and Discussion
It's no more pathetic than having a constant warm bias. Anthonys response originated from bluewave literally saying the reason all time historic winters havent been broken the past decade is a warming globe. Thats an insane position. So we're supposed to get the most severe winter on record every decade then topple it the next decade? Some of the things that were said in these enso threads the past few years were absolutely ridiculous and proven immediately untrue the following winters, whether you want to call it a forecast or not. The bias in general is why SO many people dont post here anymore. -
2026-2027 Super El Nino
michsnowfreak replied to Stormchaserchuck1's topic in Weather Forecasting and Discussion
Why would I expect a repeat of the most severe winter on record? The 2013-14 winter locally was unlike anything in the cimate record dating back to the 1870s. It steamrolled any of the vaunted '70s winters. No winter for at least the previous 140 years could match it, but the reason no winter in the 11 years since matched it is due to global temp rises? And regarding winter 2025-26 being 2nd warmest for the CONUS...that proves my point EXACTLY. It was a Winnipeg winter here. Constant cold, constant glittery snowpack, no huge storms. The worst thing it had going for it was that the cold suppressed the big storms. 99% if it was a warmer winter it would have yielded more snow. Normies called it a harsh or even brutal winter. Tell them "but it was 2nd warmest on record in the Conus". "Conus temps" really have been one of the hot topics ever since the eastern warm winter streak ended in 2023-24. And BTW. I feel the same if its a colder conus winter but mild imby. Its all about my local weather (as it is for most weather enthusiasts). -
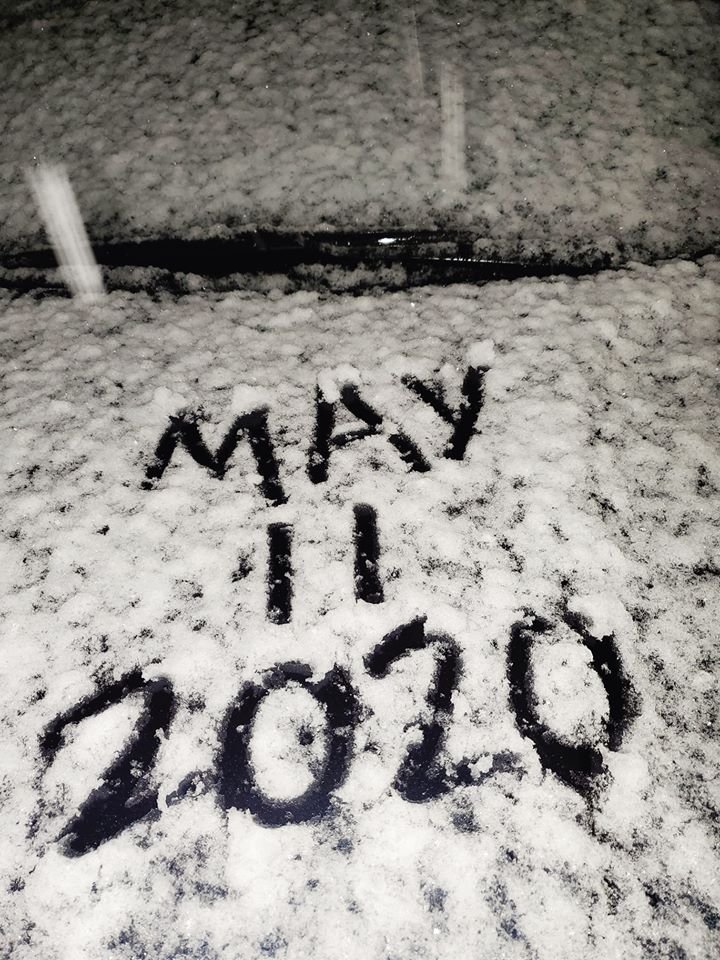
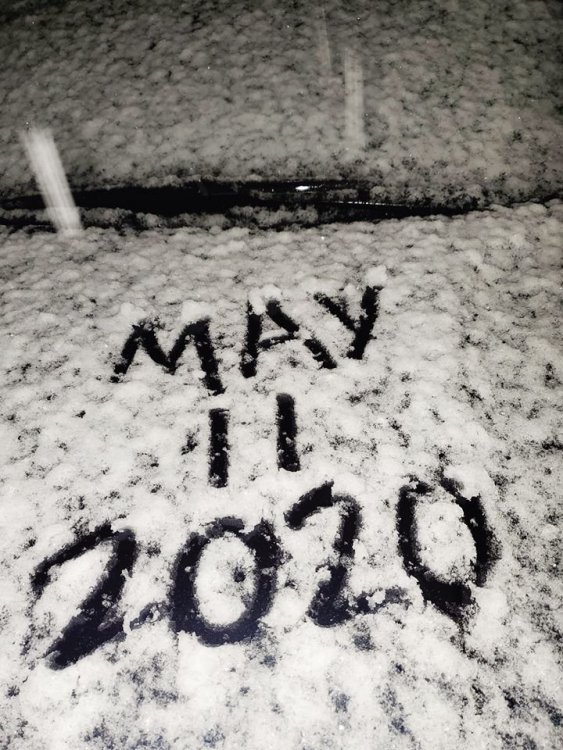
We had snow late evening May 10, 2020. I had 0.7", DTW 0.5".
-
2026-2027 Super El Nino
michsnowfreak replied to Stormchaserchuck1's topic in Weather Forecasting and Discussion
Thats always "relevant" in his posts lol. Just like the last 2 cold winters we had, global temps wont matter to most next winter, nor will how how strong the nino is. The sensible weather in anyones location is what most of us really care about. So as we get thru summer and towards Fall, it will be interesting to see what you, 40/70 and others who lack a strong bias and have a forecasting background start to think as the winter approaches. -
33 at DTW this morning. 27 at Ann Arbor.
-
Snow fell for several hours overnight. So both May 1 & 2 had a T of snow.
-
2026-2027 Super El Nino
michsnowfreak replied to Stormchaserchuck1's topic in Weather Forecasting and Discussion
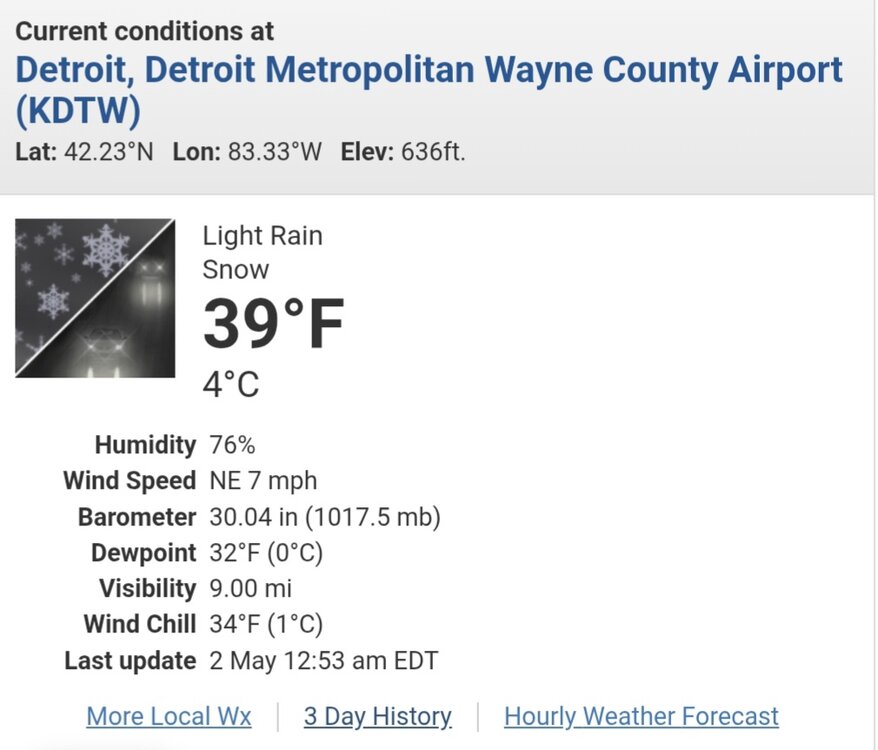
A bit of snow is falling tonight. This is the 5th year since 2016 to see May snow. Chuck called a cool May 2 months ago.
-
Snow mixed with rain here. In recent years it has snowed in May in 2026, 2023, 2021, 2020, & 2016.
-
2026-2027 Super El Nino
michsnowfreak replied to Stormchaserchuck1's topic in Weather Forecasting and Discussion
Do you have a list of years? -
2026-2027 Super El Nino
michsnowfreak replied to Stormchaserchuck1's topic in Weather Forecasting and Discussion
I dont really follow on Twitter too much. I mostly follow on here (this early on at least) and obviously several on here DO have an inherent warm bias. But once we get closer to Fall and I follow more closely, one of the first things I look for is the input from those who dont have a bias either way. -
2026-2027 Super El Nino
michsnowfreak replied to Stormchaserchuck1's topic in Weather Forecasting and Discussion
Strong Ninos are still generally the worst-case scenario for winter here, but again, we still get winter. Ironically, the strong Nino you guys would pick out of the big guns would probably be 1982-83, and that was the worst one here. Each still has different patterns, some big storms, and often decent spells of winter....its just the mean over the whole season is subpar relative to climate. The east is more feast/famine. The Great Lakes always save us to an extent. Even in the worst case scenarios we get plenty of mood flake days to feel like winter. Detroit and Boston average near identical seasonal snowfall. In the past 50 years....both places averaged 44". Yet, look at the top and bottom 5 in those 50 years at each location. Detroit Boston 20.0” – 1982-83 9.3” – 2011-12 23.4” – 1997-98 9.8” – 2023-24 23.5” – 2023-24 12.4” – 2022-23 23.7” – 1999-00 12.7” – 1979-80 24.1” – 2003-04 14.9” – 1994-95 94.9” – 2013-14 110.6” – 2014-15 74.0” – 1981-82 107.6” – 1995-96 71.7” – 2007-08 96.3” – 1993-94 69.1” – 2010-11 86.6” – 2004-05 65.7” – 2008-09 85.1” – 1977-78 -
2026-2027 Super El Nino
michsnowfreak replied to Stormchaserchuck1's topic in Weather Forecasting and Discussion
Its my understanding that the pre-1950 ENSO years are more subject to debate re: strength, but still cool to see which years were which. 2002-03 was another cold moderate Nino. 2009-10 was funky but cold in spots. And several others hovered near climo temp-wise. -
2026-2027 Super El Nino
michsnowfreak replied to Stormchaserchuck1's topic in Weather Forecasting and Discussion
Oh I do too. I take everything with a grain of salt at this stage. I have also said several times that I expect '26-27 winter to be milder here than the past 2. But these automatic assumptions of some torch winter and a super nino- not buying it at this stage. -
2026-2027 Super El Nino
michsnowfreak replied to Stormchaserchuck1's topic in Weather Forecasting and Discussion
So the model is simultaneously correct in jumping to a stronger Nino, but INCORRECT in staying consistent with a cold winter look in the Great Lakes, similiar to the last 2 winters. Got it. -
2026-2027 Super El Nino
michsnowfreak replied to Stormchaserchuck1's topic in Weather Forecasting and Discussion
I disagree. While the mean of a strong Nino is a milder than avg winter in the north, keep in mind theres tons of hugging the warmest and/or least wintry Ninos on record in here by some. Thats not how weather always works. The strong El Nino of 1911-12 was a brutally cold winter, one of the coldest on record. It definitely didnt fit the mold of a typical strong Nino. And yes, even back then (before we hear about a different climate) strong Ninos generally produced mild winters, including 1877-78 (year without a winter in the upper midwest) and 1918-19 (a winter far less snowy than any ive ever experience). Using the more common post-1950 list. Moderate are a mixed bag- several cold winters in there. And several of the strong Ninos averaged on the average to cool side of average here. -
2026-2027 Super El Nino
michsnowfreak replied to Stormchaserchuck1's topic in Weather Forecasting and Discussion
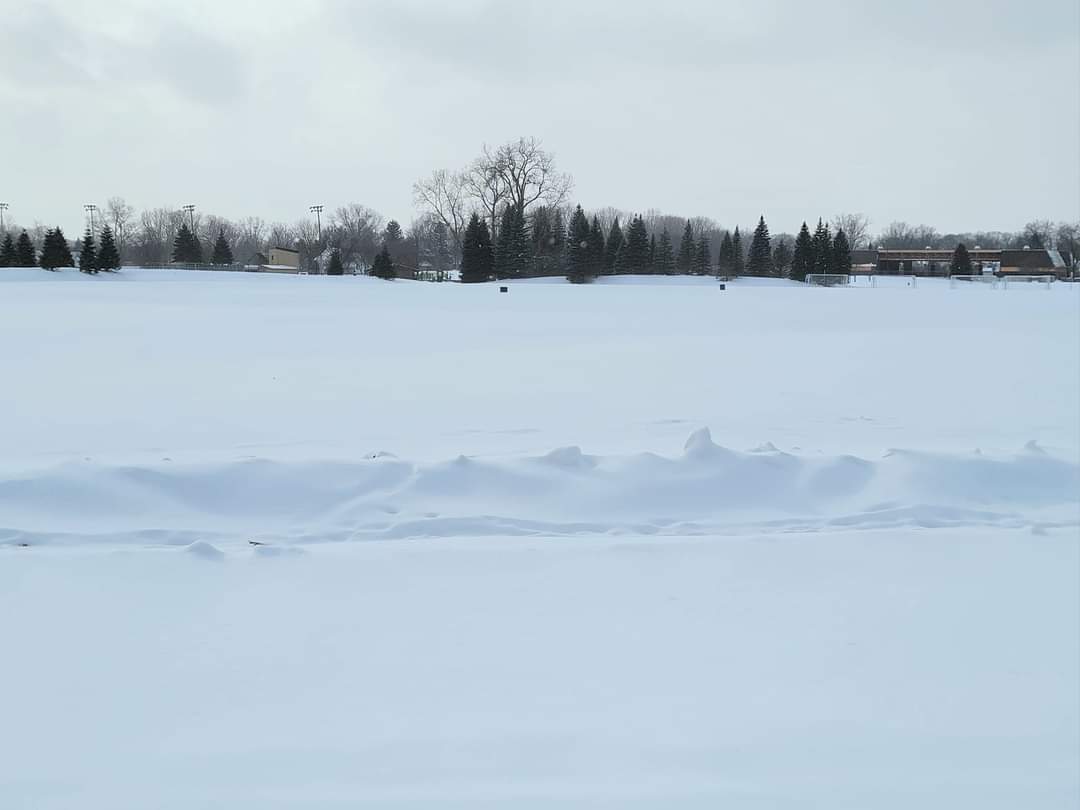
January 2024 actually was a decent winter month here. It was shockingly (for a strong nino) the wettest january on record at Detroit. Which jives with what you mentioned about strong ninos being wetter. There was a big cold snap mid month and the Plains actually finished the month colder than avg. It was the warm and very low snow December and February that made it such a bummer. This is a pic from Jan 2024. Much of the month resembled what winter in MI should. The problem is Dec and Feb didnt.
-
2026-2027 Super El Nino
michsnowfreak replied to Stormchaserchuck1's topic in Weather Forecasting and Discussion
Thats the way to run a strong nino. Cansips has been hellbent on a 3rd straight cold winter in the Great Lakes. -
2026-2027 Super El Nino
michsnowfreak replied to Stormchaserchuck1's topic in Weather Forecasting and Discussion
100%. Some are relying/hoping too much for the warmest possible scenario and im just not buying it at this time. -
2026-2027 Super El Nino
michsnowfreak replied to Stormchaserchuck1's topic in Weather Forecasting and Discussion
Yeah shutout may not be the best choice of words, I took it literally lol. 2015-16 was a better snow season here than 1997-98 or 2023-24. -
2026-2027 Super El Nino
michsnowfreak replied to Stormchaserchuck1's topic in Weather Forecasting and Discussion
Hmm while im not as familiar with east coast climate, that seems pretty much impossible to get a total shutout in new England. Shitty compard to climo, yes, but shutout or even close, never. Im in SE Michigan, i turn 43 next week and the least snowy winter Detroit has recorded during my lifetime was 23.4" in 1997-98. 2023-24 was right there at 23.5". Go north in Michigan and snow towns were calling 2023-24 with its 60, 80, 100" a "non-winter". So all of this worry about the worst case scenarios is STILL relative to one's climo. Even IF its a strong or super nino, many other factors come into play too. So I can say with 100% confidence that any area north of NYC will not be shutout. -
2026-2027 Super El Nino
michsnowfreak replied to Stormchaserchuck1's topic in Weather Forecasting and Discussion
Id think its way too early to say anything. I mean "potential" is there for a lot of stuff. But with the ability to make snow im sure ski areas will be fine regardless. -
We fairly frequently get snowpack with 1-2" water content but rarely more than that. The most water content i can recall was 2014 with about 4-5" water content by late Feb.
-
Not a chance. It will be the same crickets as during the cold winter. Unless the west continues to bake.
-
2026-2027 Super El Nino
michsnowfreak replied to Stormchaserchuck1's topic in Weather Forecasting and Discussion
Im taking a stab in the dark, but i think snowman is going with a super nino. -
2026-2027 Super El Nino
michsnowfreak replied to Stormchaserchuck1's topic in Weather Forecasting and Discussion
Not sold on a super el nino and especially not on a torch. I do think it will be milder here than the last 2 cold winters, however.