Terpeast
-
Posts
6,687 -
Joined
-
Last visited
Content Type
Profiles
Blogs
Forums
American Weather
Media Demo
Store
Gallery
Everything posted by Terpeast
-
Jan Medium/Long Range Disco 2: Total Obliteration is Coming
Terpeast replied to Jebman's topic in Mid Atlantic
Nice to see a 2-4/3-5er but I really don’t like the trend. I’m concerned -
Jan Medium/Long Range Disco 2: Total Obliteration is Coming
Terpeast replied to Jebman's topic in Mid Atlantic
Trend points to a rug pull -
Jan Medium/Long Range Disco 2: Total Obliteration is Coming
Terpeast replied to Jebman's topic in Mid Atlantic
Looks SE from earlier runs today, but not as suppressed as 0z/11 i take that back, even more S -
Jan Medium/Long Range Disco 2: Total Obliteration is Coming
Terpeast replied to Jebman's topic in Mid Atlantic
I’m on pivotal weather -
Jan Medium/Long Range Disco 2: Total Obliteration is Coming
Terpeast replied to Jebman's topic in Mid Atlantic
Looks a little slower to me. Or flatter -
Jan Medium/Long Range Disco 2: Total Obliteration is Coming
Terpeast replied to Jebman's topic in Mid Atlantic
Icon move its slp position 500 miles to the SE, lol I told you guys we shouldn’t be starting a thread until like Saturday -
Jan Medium/Long Range Disco 2: Total Obliteration is Coming
Terpeast replied to Jebman's topic in Mid Atlantic
Got it, thanks for the clarification. Tangentially related, I read a couple of AFDs noting the suppressed 12z/18z euro track but called it an outlier and didn’t want to jump on it yet, just monitoring that trend for now -
Jan Medium/Long Range Disco 2: Total Obliteration is Coming
Terpeast replied to Jebman's topic in Mid Atlantic
gfs trended opposite direction from euro today, but with 18z euro/eps that may have stopped. We’ll see what they decide to do next -
Jan Medium/Long Range Disco 2: Total Obliteration is Coming
Terpeast replied to Jebman's topic in Mid Atlantic
Day 5 WPC. Look at when they issued it. They had to have seen the 12z euro before issuing
-
Jan Medium/Long Range Disco 2: Total Obliteration is Coming
Terpeast replied to Jebman's topic in Mid Atlantic
Just checked back at previous euro runs, and they all had that feature even when they had the closer track. So I’m less sure now that it makes a difference, unless the kicker is getting stronger and faster. The atmosphere up that way is pretty chaotic so I don’t think any of the models are right about what will happen up there. May be even more of a wildcard than the cutter’s evolution -
Jan Medium/Long Range Disco 2: Total Obliteration is Coming
Terpeast replied to Jebman's topic in Mid Atlantic
Yeah I pointed that out earlier today. thing is, canadian had it too, just not as strong and further back. What the euro showed didn’t make sense to me -
Jan Medium/Long Range Disco 2: Total Obliteration is Coming
Terpeast replied to Jebman's topic in Mid Atlantic
Back to jan 16-17, I’ll see what tonight’s NWS AFDs have to say. Will be interesting to see how much stock they put into the 12z euro -
Jan Medium/Long Range Disco 2: Total Obliteration is Coming
Terpeast replied to Jebman's topic in Mid Atlantic
Yeah, so have I. I don’t know if I’ll even bother doing a full outlook for it unless either enso or pdo suddenly flip. Maybe a 4 bullet point outlook with a one-liner statement instead of a 30 page report. I’ll probably invest that time into planning a winter trip out west. -
Jan Medium/Long Range Disco 2: Total Obliteration is Coming
Terpeast replied to Jebman's topic in Mid Atlantic
Maybe a trip to Spokane where my brother lives. They’ve been KILLING it with nina winters -
Jan Medium/Long Range Disco 2: Total Obliteration is Coming
Terpeast replied to Jebman's topic in Mid Atlantic
GFS doubles down. Your move, Euro. -
Jan Medium/Long Range Disco 2: Total Obliteration is Coming
Terpeast replied to Jebman's topic in Mid Atlantic
Looks a little slower, but we'll see -
Jan Medium/Long Range Disco 2: Total Obliteration is Coming
Terpeast replied to Jebman's topic in Mid Atlantic
Haha yeah I gotta hand it to him, though. Heisy is sharp and picks up on things most of us don't see. -
Jan Medium/Long Range Disco 2: Total Obliteration is Coming
Terpeast replied to Jebman's topic in Mid Atlantic
That answered my question. Good sign if it’s the furthest South of the ensembles
-
Jan Medium/Long Range Disco 2: Total Obliteration is Coming
Terpeast replied to Jebman's topic in Mid Atlantic
Is that the one next to the 13? and how do you know that's the OP? -
Jan Medium/Long Range Disco 2: Total Obliteration is Coming
Terpeast replied to Jebman's topic in Mid Atlantic
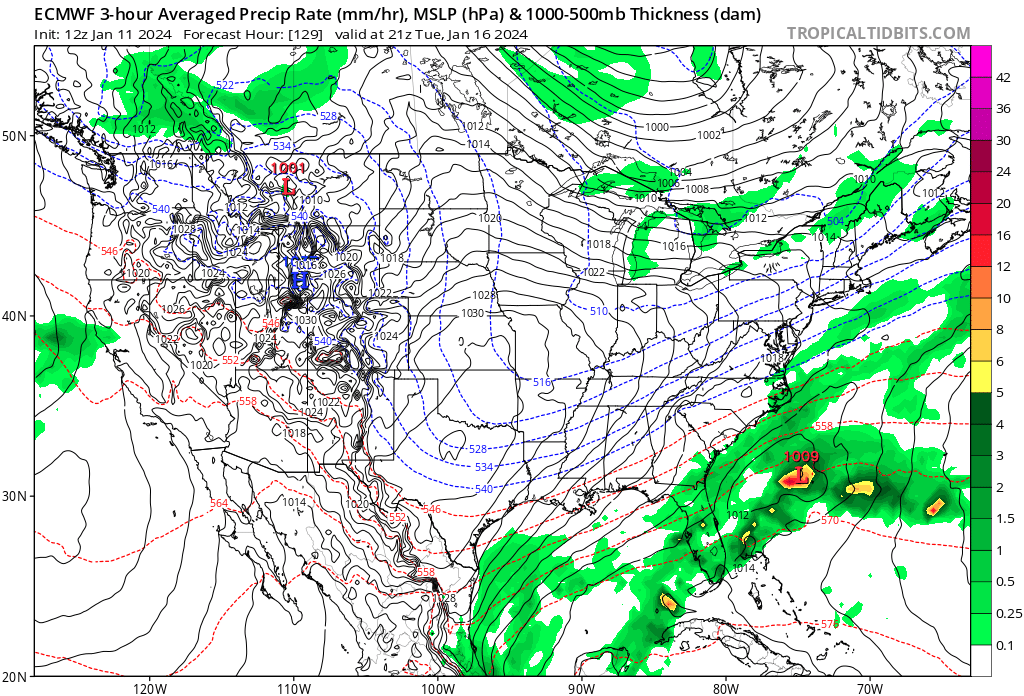
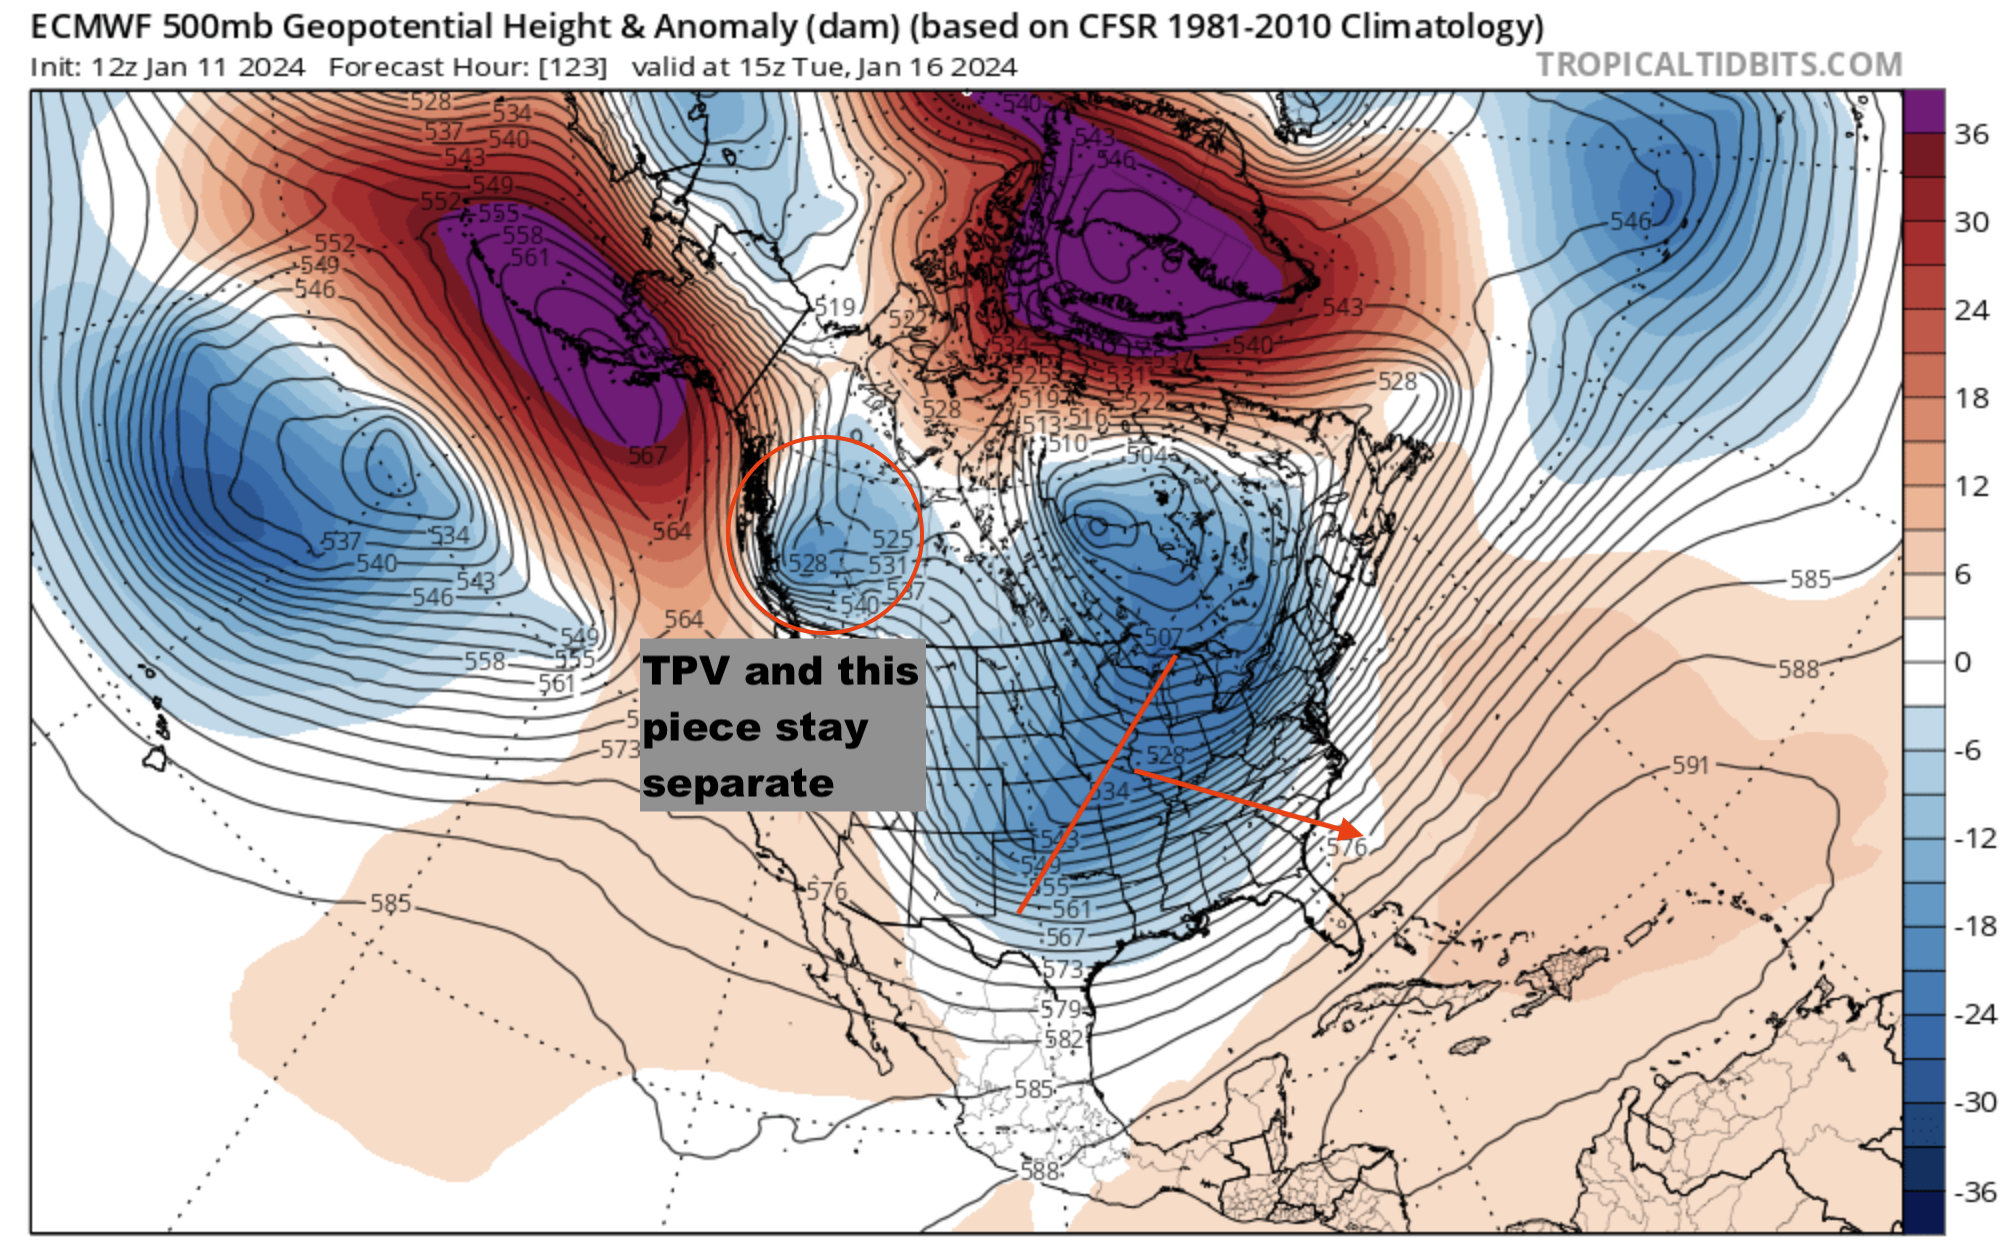
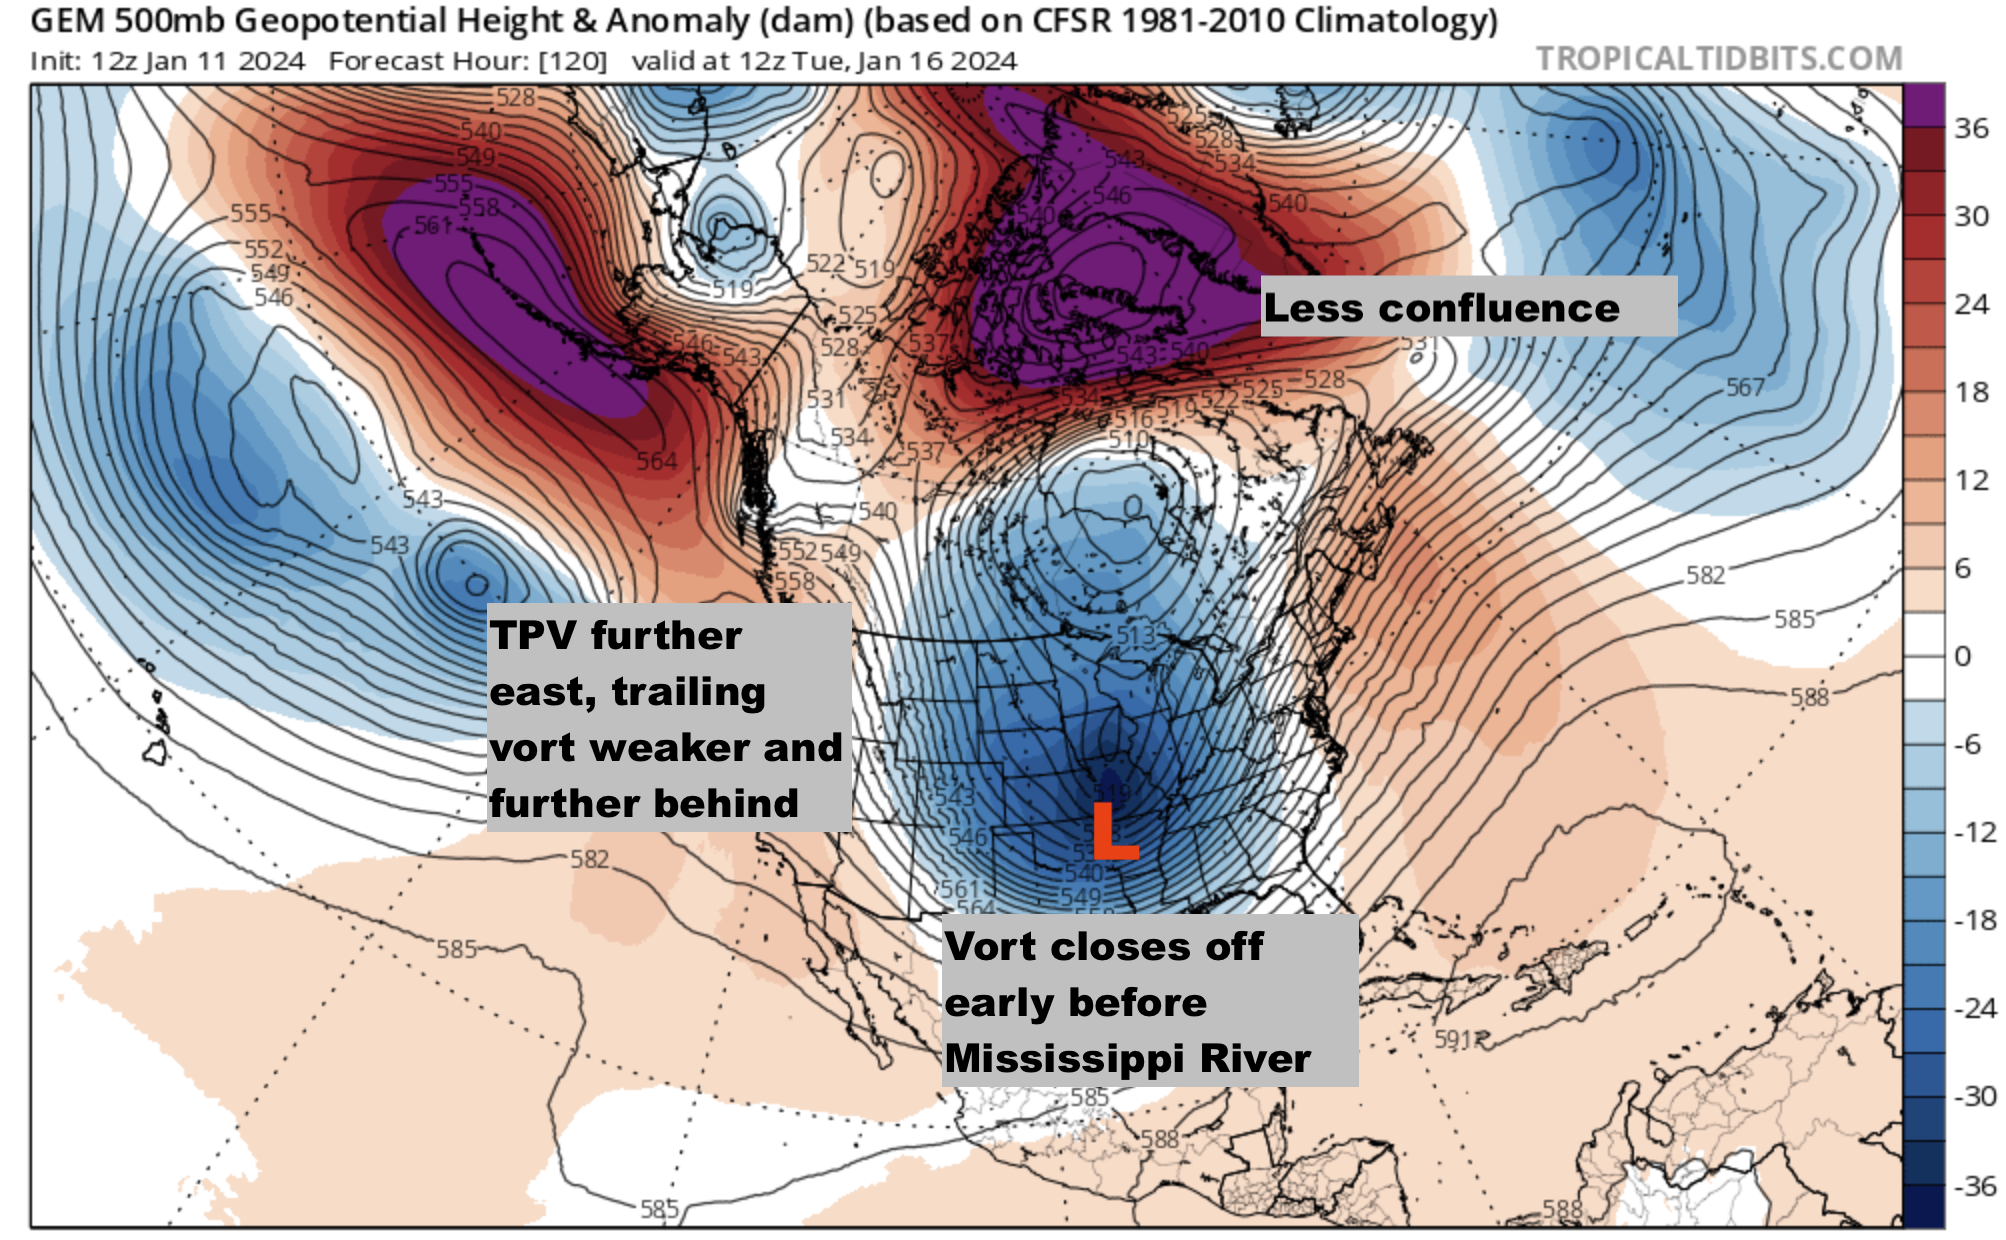
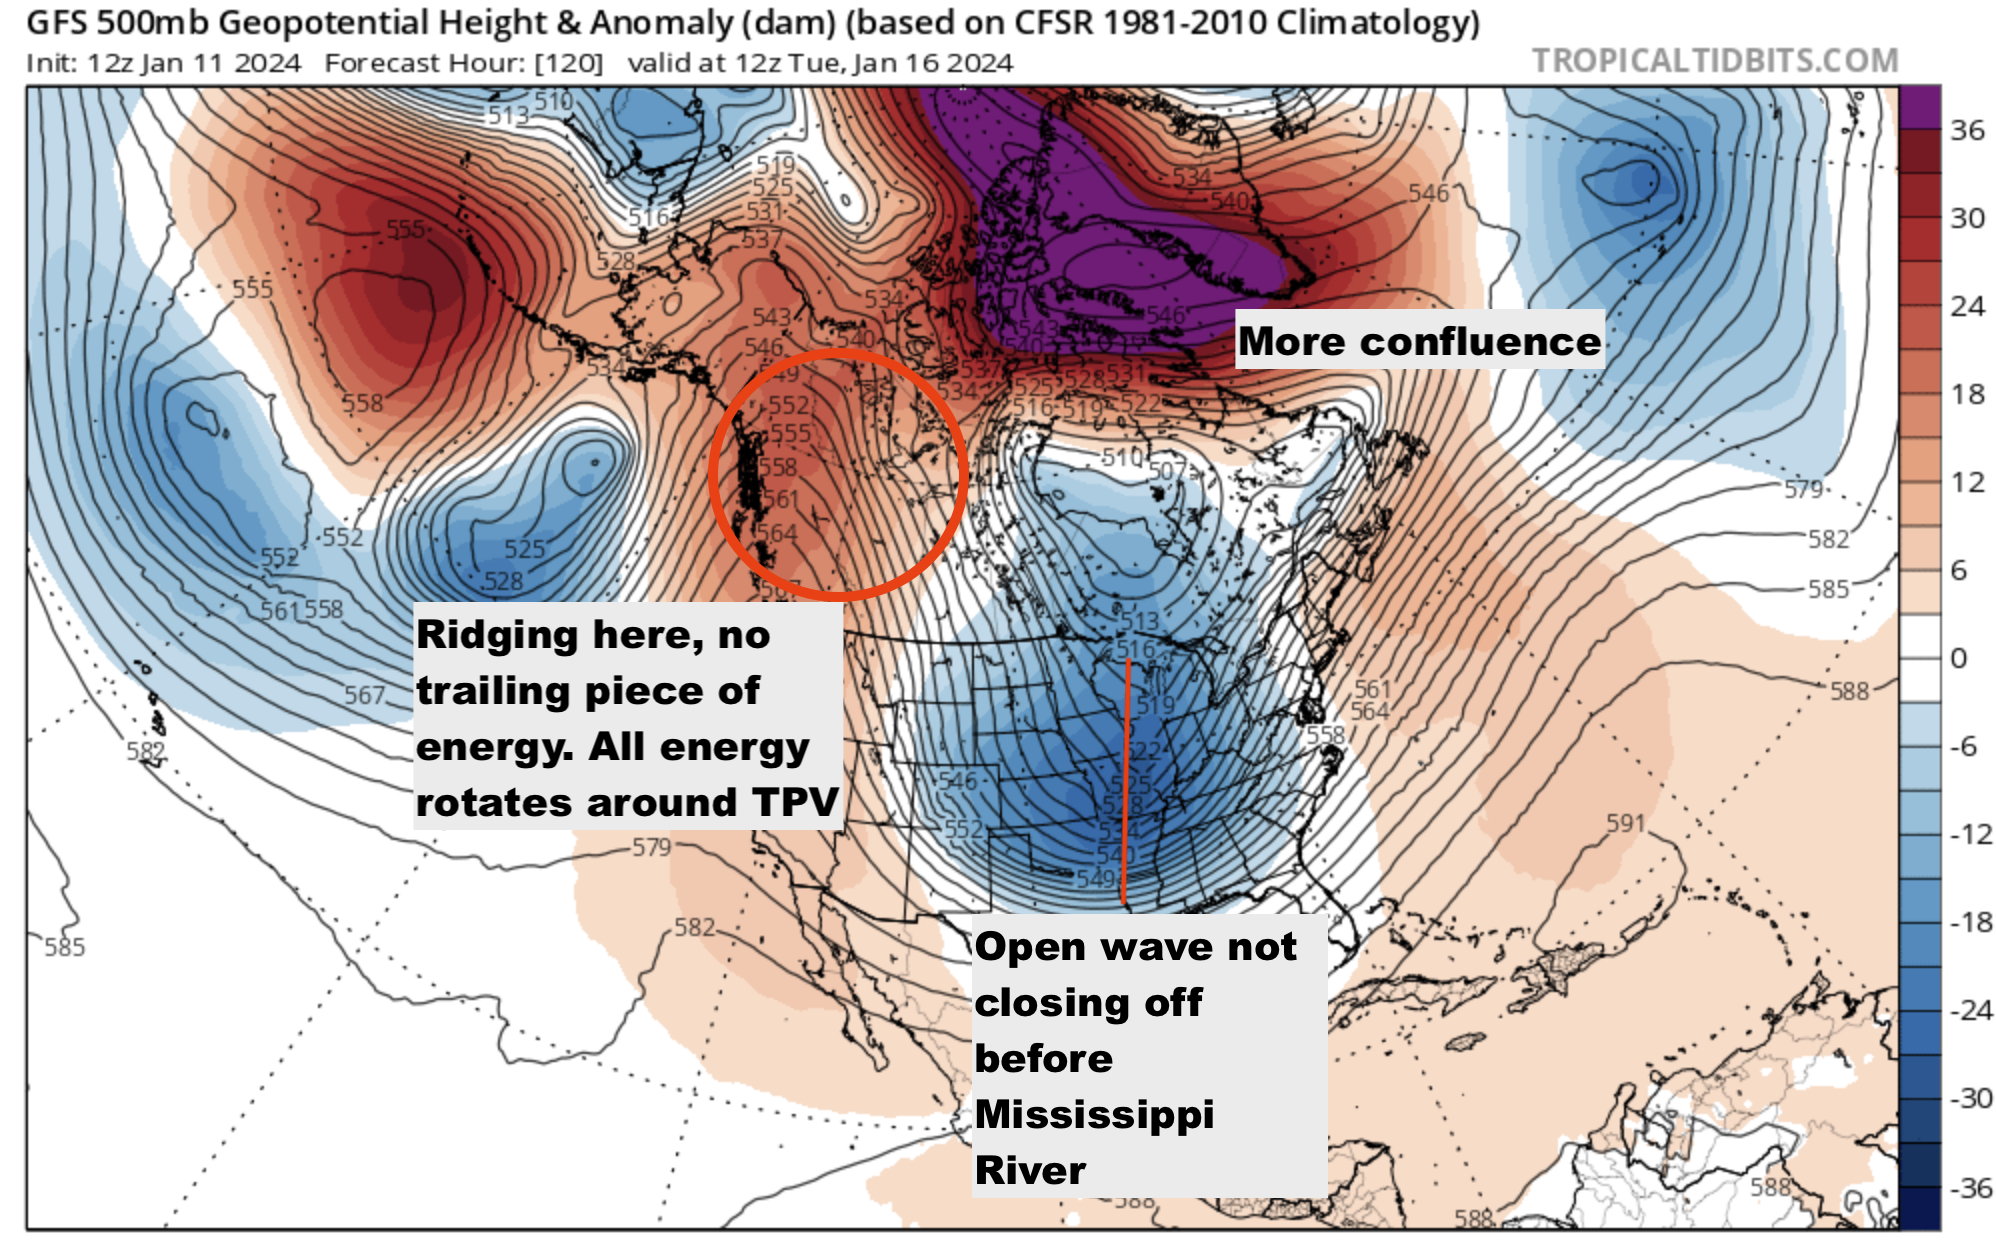
I think I know why the Euro spit out a way different solution, and I think it's weird. I'll also show why the CMC showed something different, like a closer track with ptype issues. Euro has this trailing vort that's pretty strong, but never phases with the TPV. Instead, they stay separate, while they squeeze the positively tilted wave further SE. Too much confluence over us. The Canadian otoh has a weaker trailing vort that's further behind... either less relevant, or loses energy to the lead vort that closes off west of the mississippi. This is the other end of the spectrum vs. the euro. Less confluence up top doesn't help either. Now the GFS shows the cleanest solution. Where is that trailing vort? There isn't one. Instead we have tall ridging into NW Canada/Alaska. We have an open wave rotating under the TPV with more confluence to the NE. I don't know what to make of the trailing vort shown on the Euro and Canadian, and the lack thereof on the GFS. Maybe they're both picking up on something that the GFS is missing. But it's something to keep an eye on. On the other hand, the TPV seems to be well modeled and in fairly good agreement with all 3 models. I think the Euro solution is weird because the strong trailing vort and the TPV never manages to phase. From a physics standpoint, I think they should. But they don't.


-
Jan Medium/Long Range Disco 2: Total Obliteration is Coming
Terpeast replied to Jebman's topic in Mid Atlantic
Now if you're a weenie, you'll love what Chuck is saying now. All it will take is for a slight 50-100 mile shift in the TPV to pull the track back up (or further suppress it) -
Jan Medium/Long Range Disco 2: Total Obliteration is Coming
Terpeast replied to Jebman's topic in Mid Atlantic
My hunch is that we'll see another tick north once the models resolve the next few days. That's been the repetitive theme as far as I can remember. -
Jan Medium/Long Range Disco 2: Total Obliteration is Coming
Terpeast replied to Jebman's topic in Mid Atlantic
Op euro probably on the SE side of the ensemble envelope, which means we can't rule a solution like that out. At least most members are more NW of the op -
Jan Medium/Long Range Disco 2: Total Obliteration is Coming
Terpeast replied to Jebman's topic in Mid Atlantic
Again, it goes back to clearing the cutter outta here before we can hone in on a solution. Sorry I sound like a broken record saying this but it is what it is -
Jan Medium/Long Range Disco 2: Total Obliteration is Coming
Terpeast replied to Jebman's topic in Mid Atlantic
This only increases the uncertainty even more